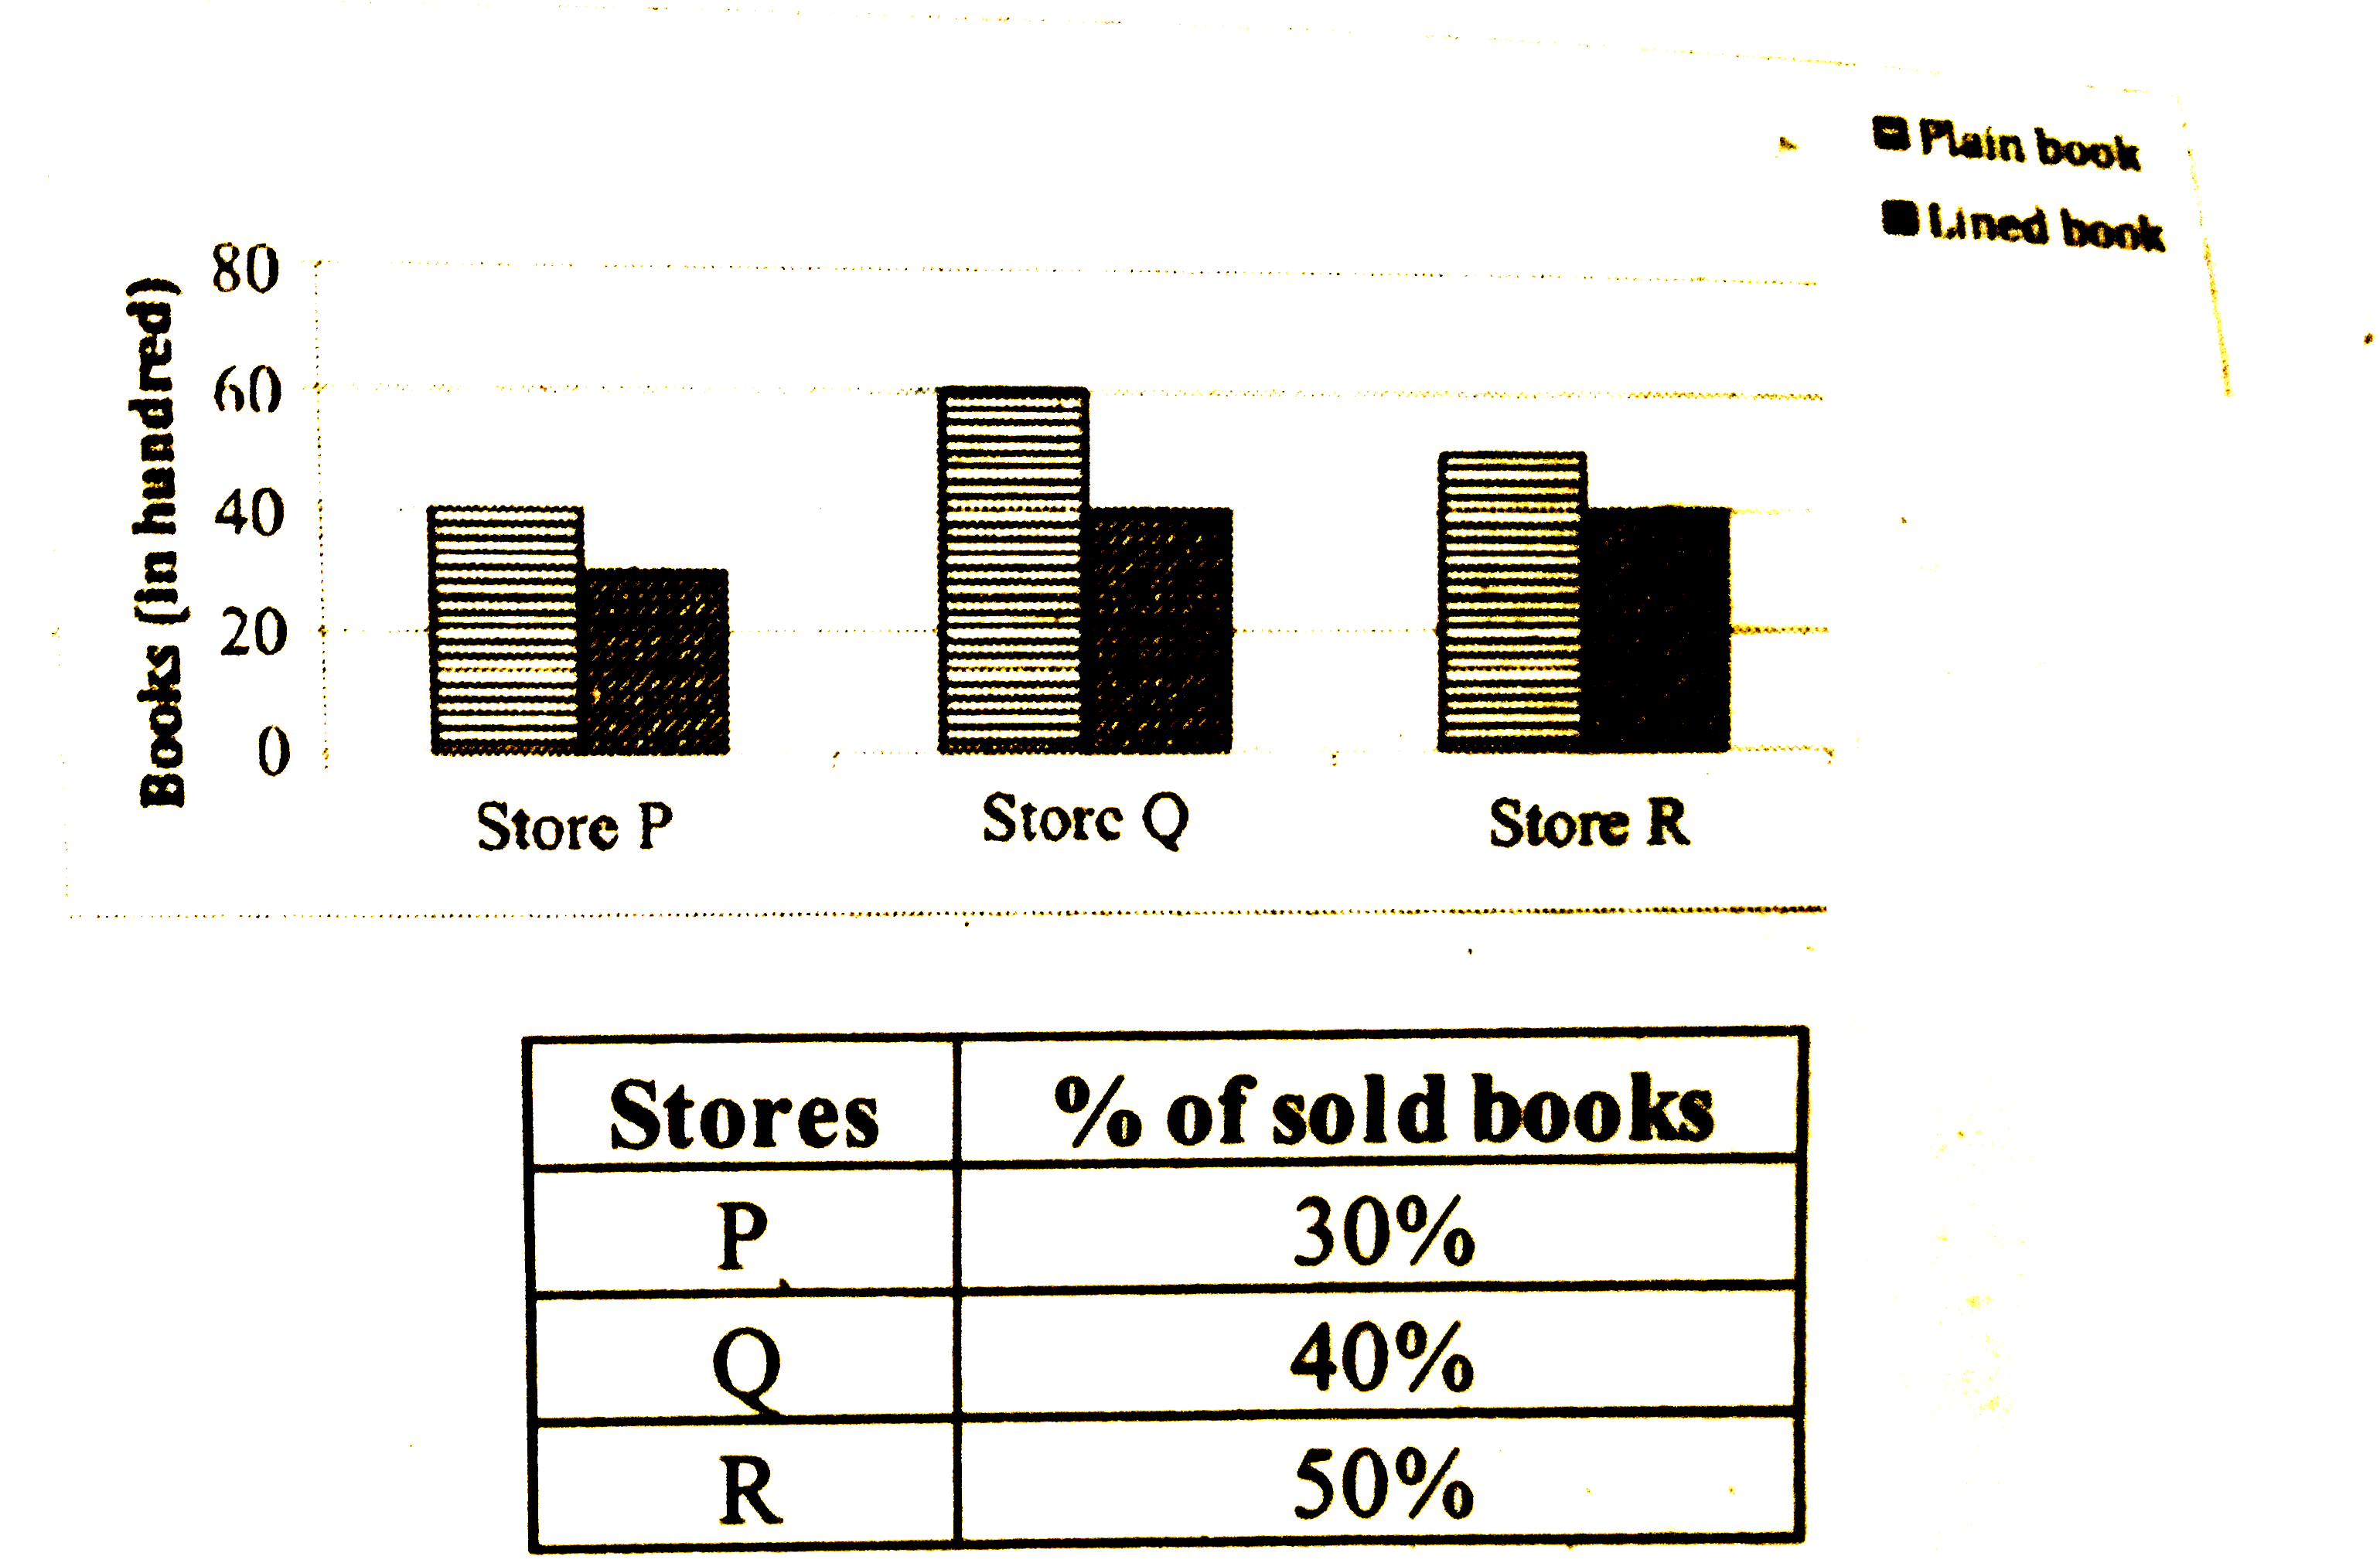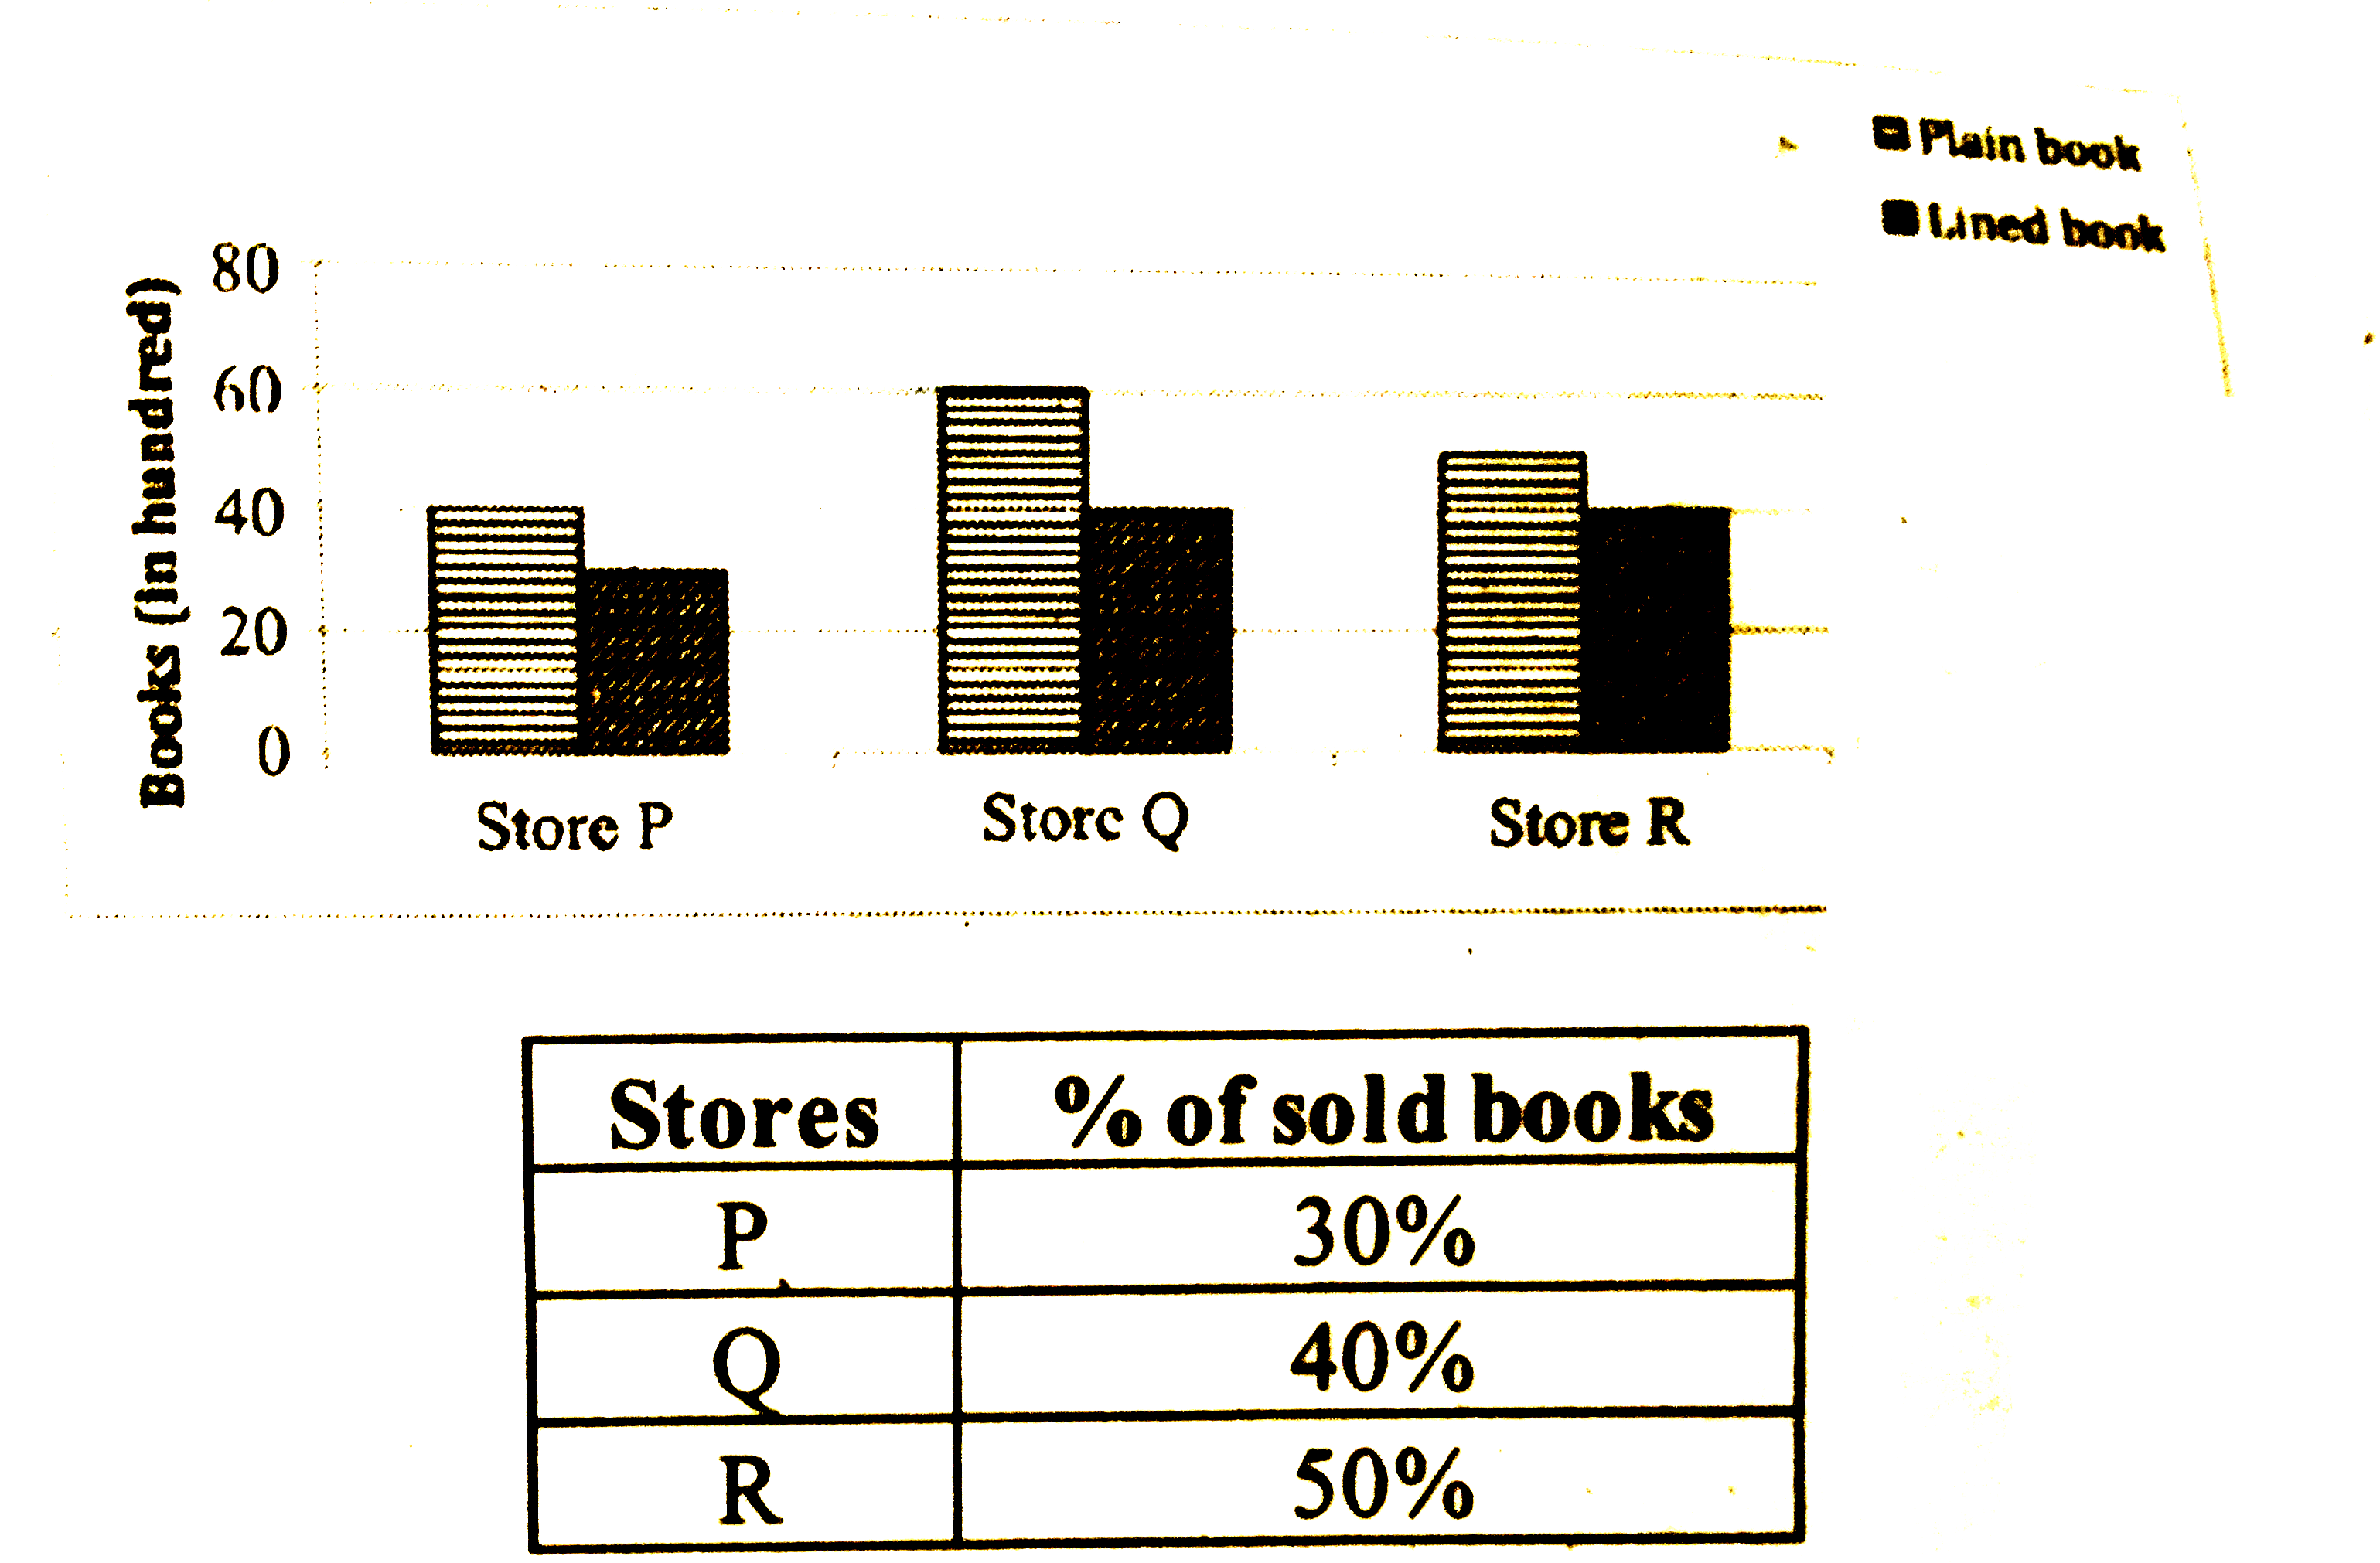
Unsold books of store P in approximately what percent more or less than total unsold books of store Q and R together.
a) 0.48
b) 0.53
c) 0.59
d) 0.52
The correct Answer is:B
Unsold books store P=7000×70100=4900
Unsold book of store Q and R together =1000×60100+9000×50100=10500
Required %=10500−490010500×100=53% (approx)
Topper's Solved these Questions
Similar Questions
Knowledge Check
The total marks obtained by the student in subjects C and E is approximately how much percent more than what he obtained in A and D together?
A0.0909B0.1025C0.0833D0.0726The table shows the production of different types of cars ( in thousands).

The average production of cars in 2018 is approximately what percent less than the total production of type D cars in 2015 and type B cars in 2017 taken together ?A45.8%B43.6%C42.4%D44.2%The table shows the production of different types of cars (in thousands).
यह तालिका एक कंपनी द्वारा अलग-अलग कारों के उत्पादन (हज़ार में ) को दर्शाती है |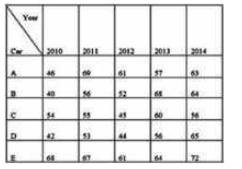 The average production of all type of cars in 2014 is approximately what percent less than the total production of type B cars in 2013 and type D cars in
2010 taken together?
2014 में सभी प्रकार की कारों का औसत उत्पादन 2013 में B प्रकार तथा 2010 में D प्रकार की कारों के कुल उत्पादन से लगभग कितना प्रतिशत कम है ?A0.418B0.449C0.432D0.444
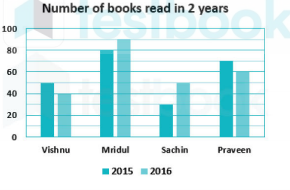
Directions: Read the bar graph carefully and answer the given questions.Books read by Praveen in the year 2015 is what percent more or less than the number of books read by Mridul in the year 2015 ?
View Solution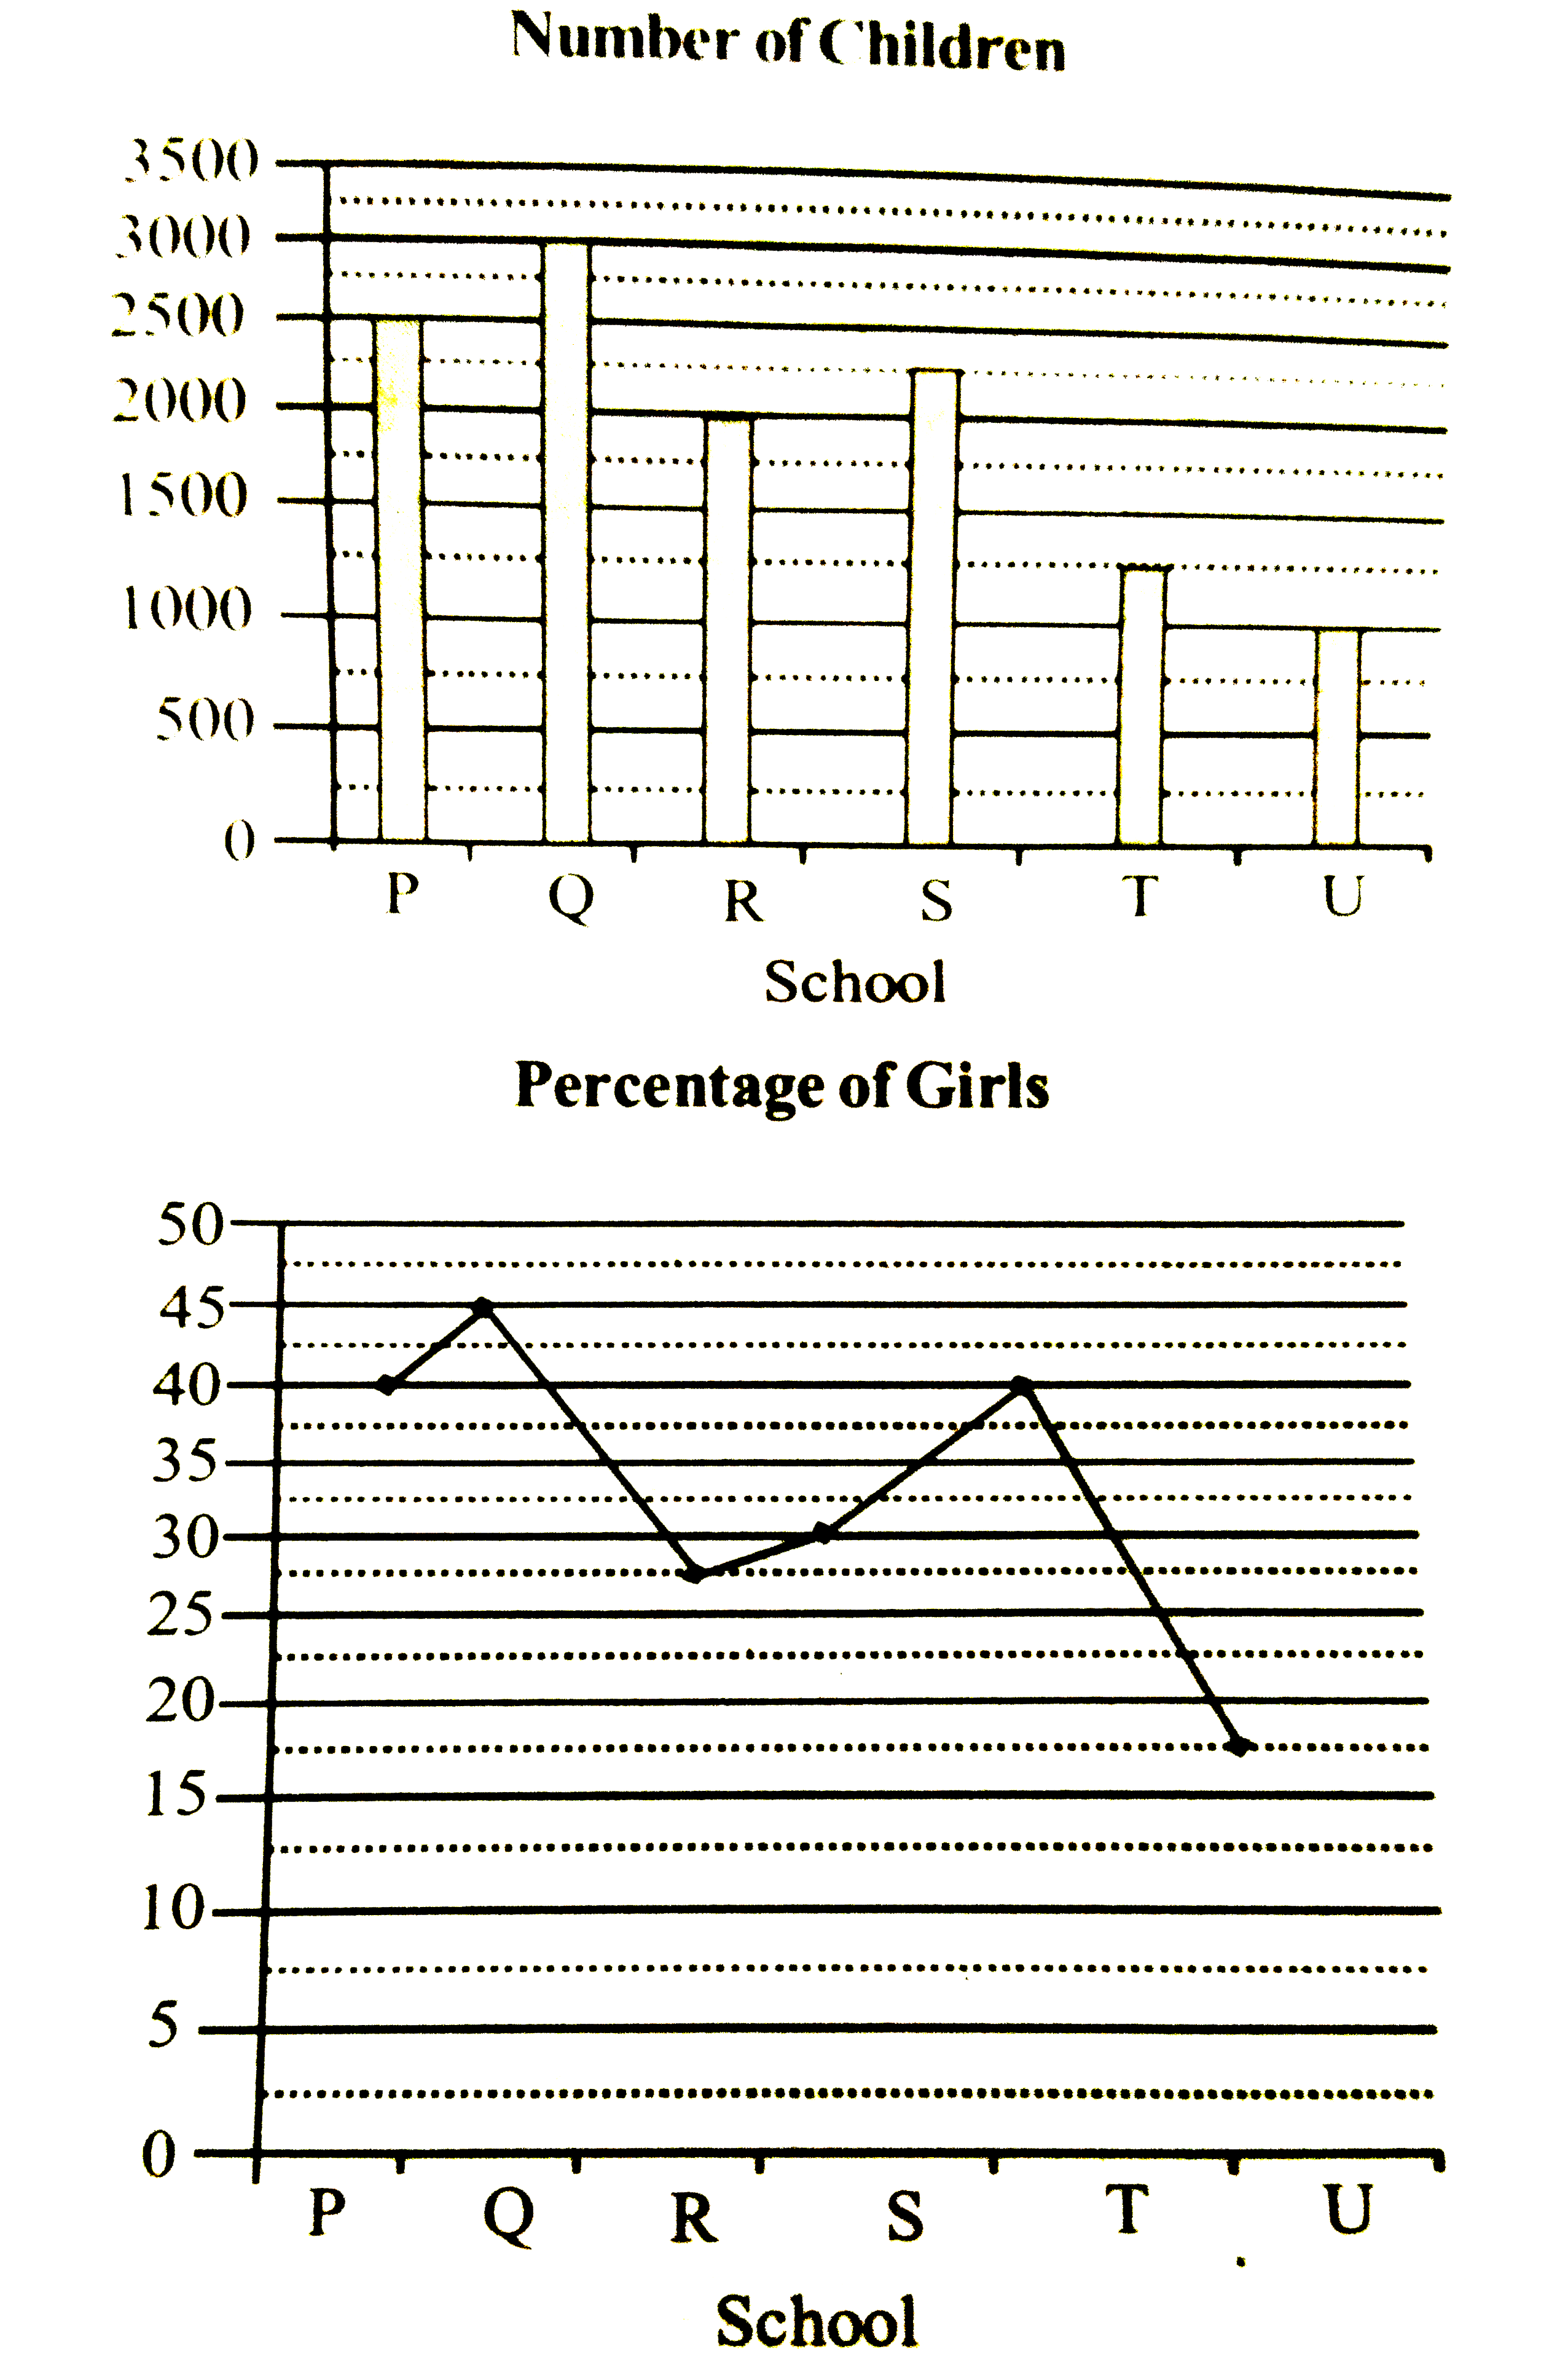
The total number of student in school R, is approximately what percent of the total number of student in school S?
View Solution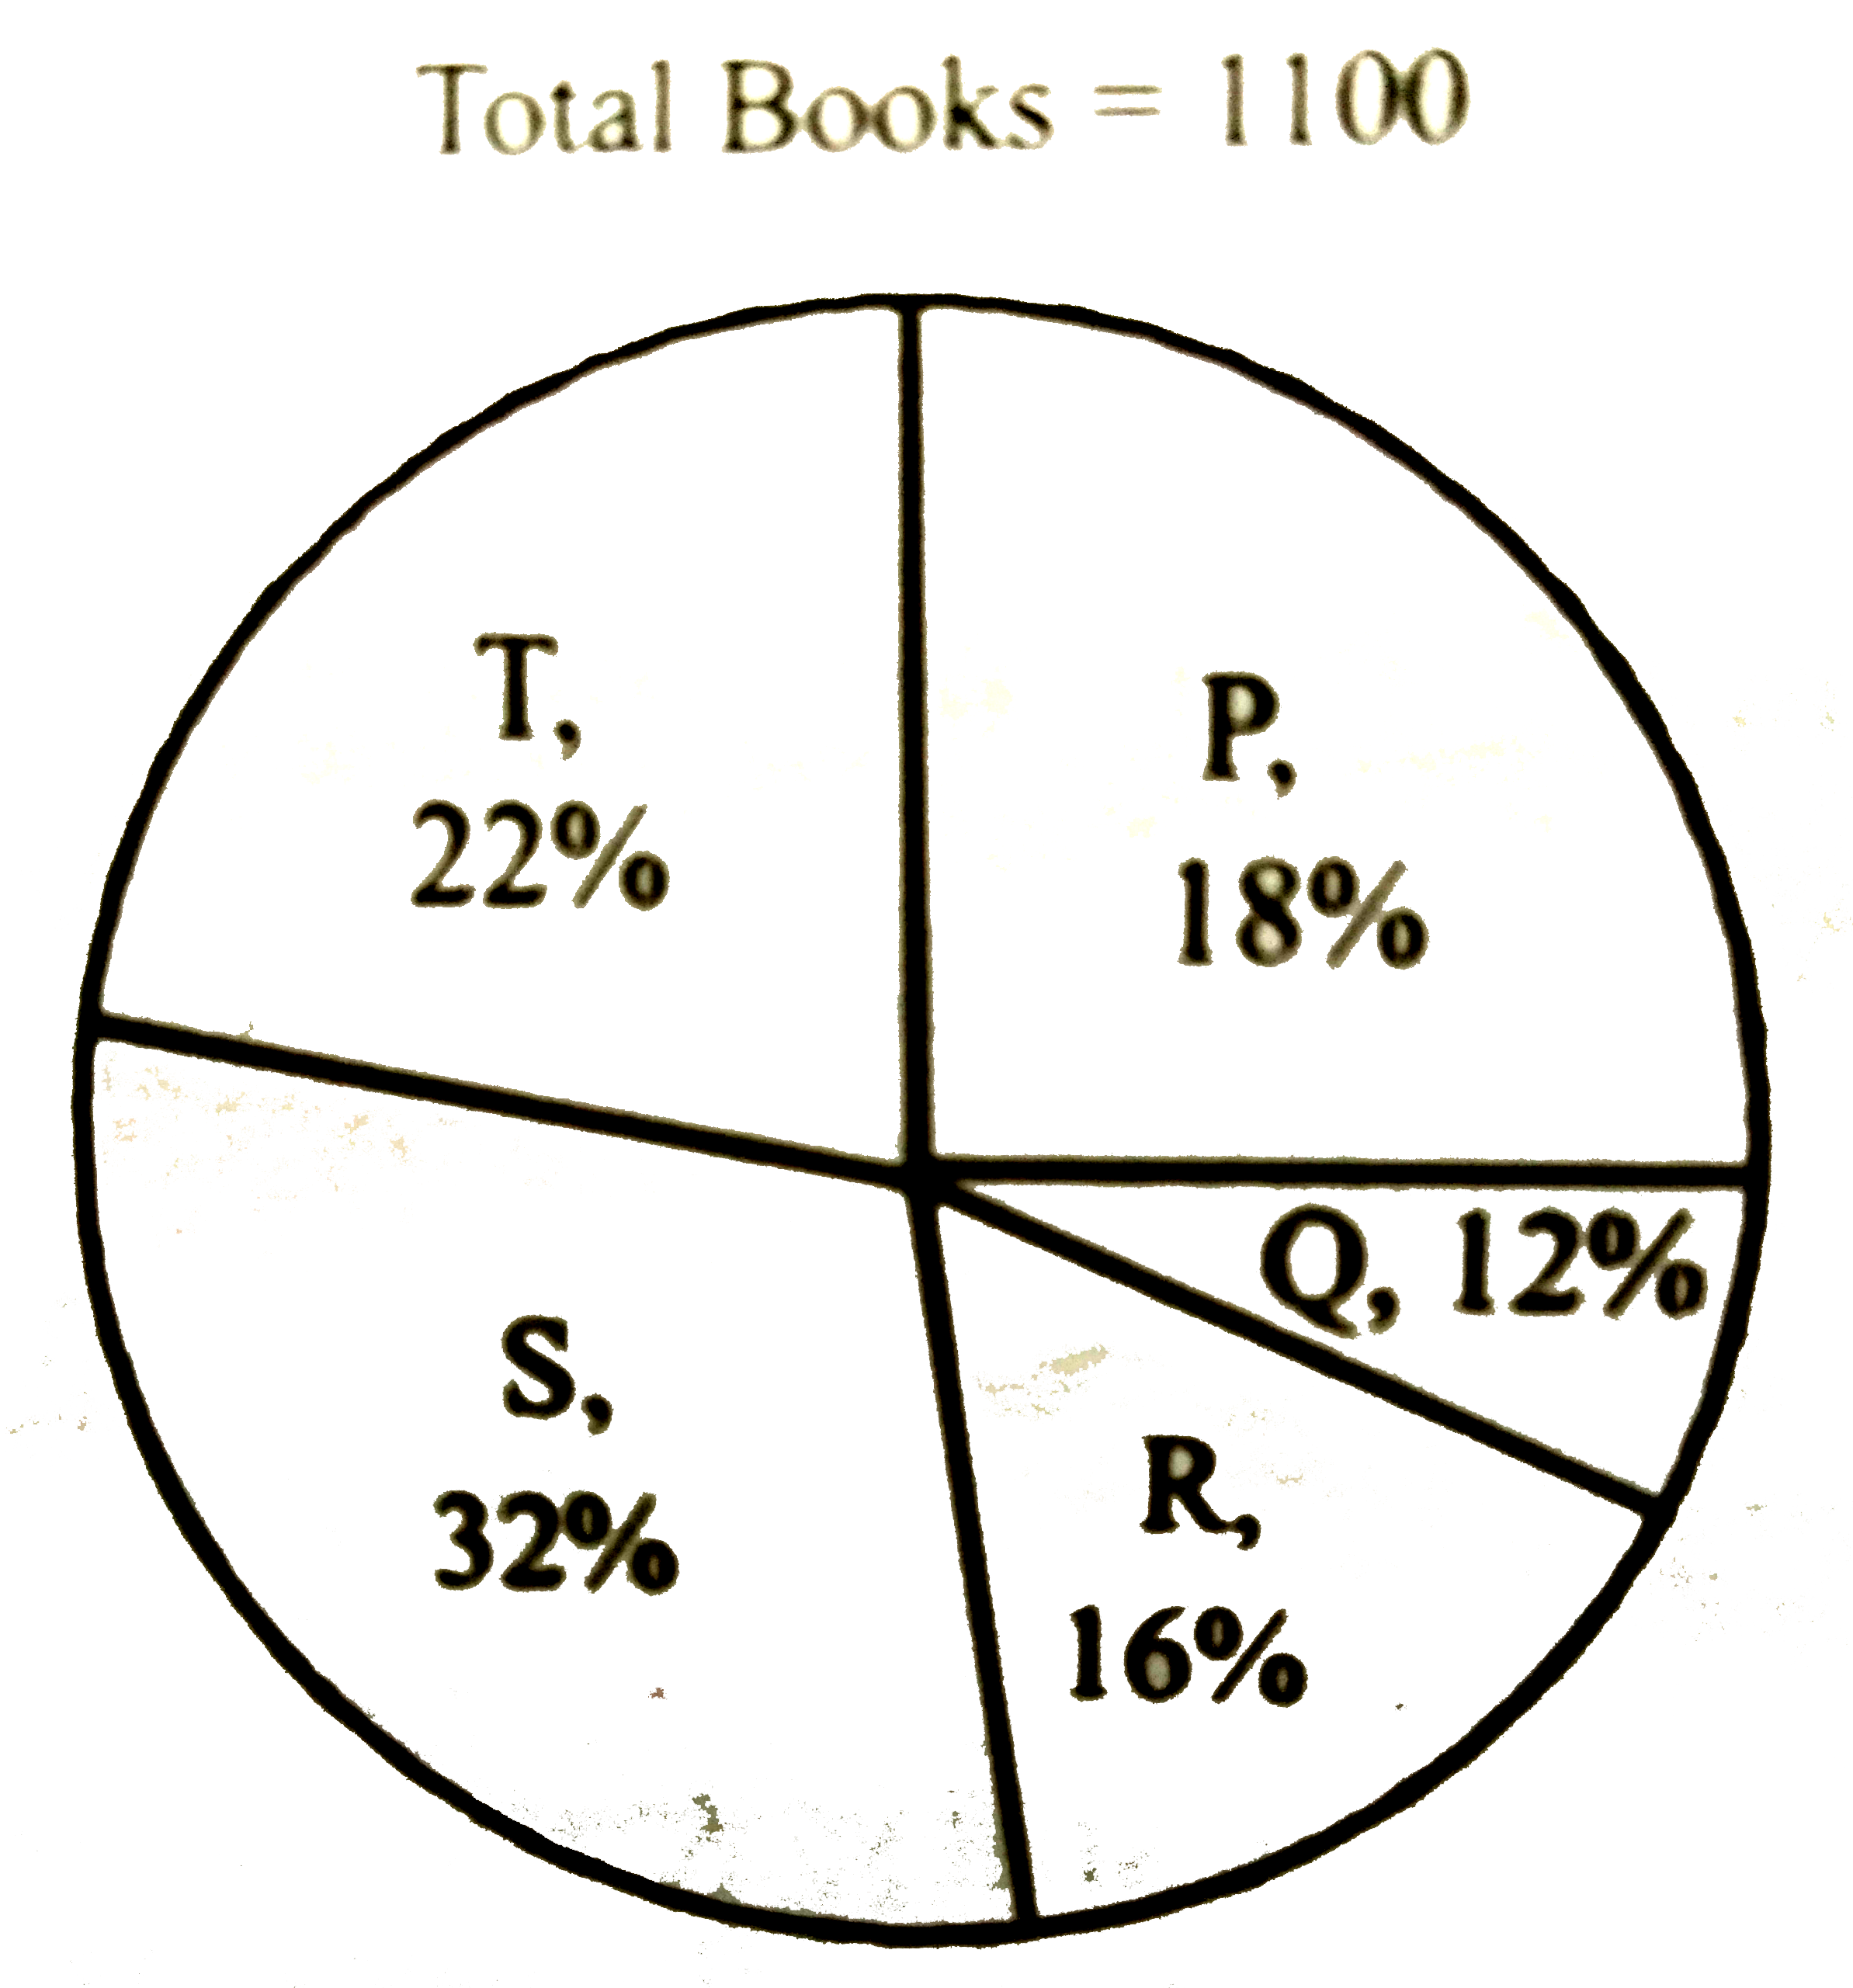
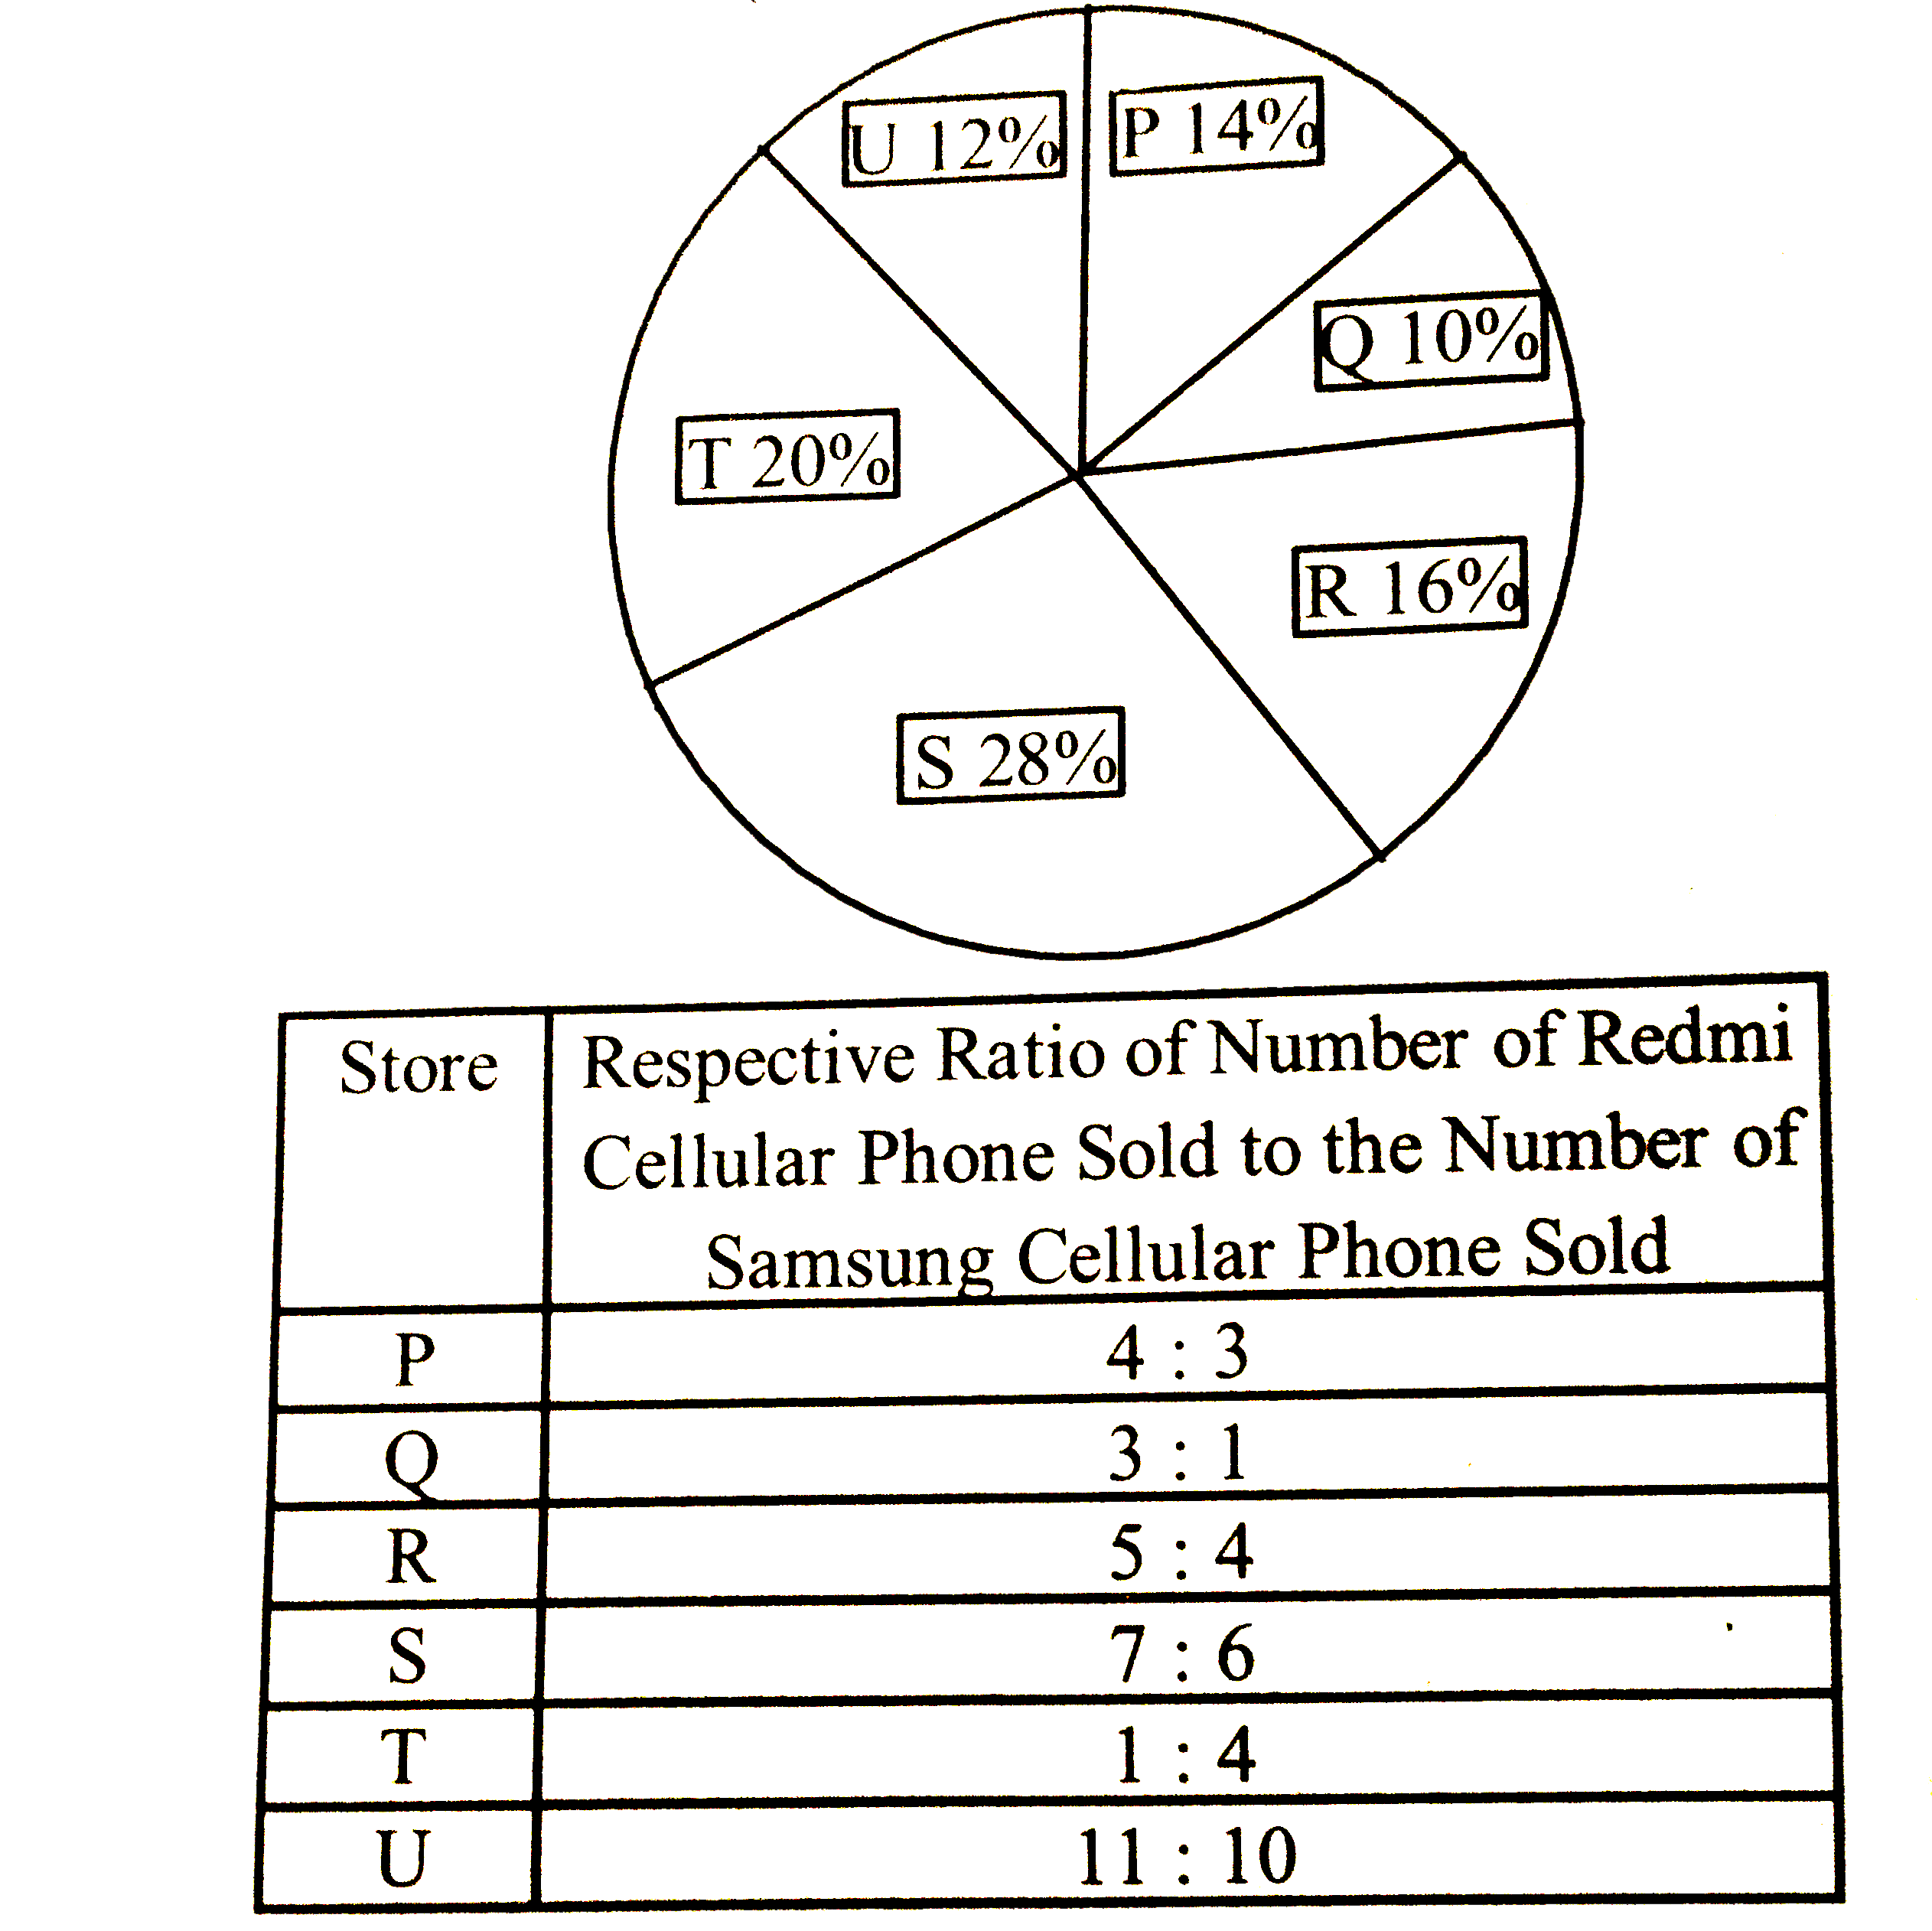
What is the ratio of total books sold by store P and R together to the total books sold by store S and T together
View SolutionThe table shows the production of different types of cars
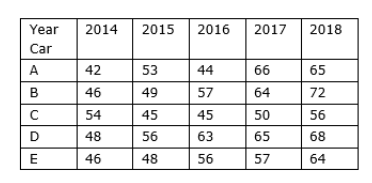
The average production of cars in 2018 is approximately what percent less than the total production of type D cars in 2015 and type b cars in 2017 taken together?
View Solutionthe given bar graph presents income and Expenditure of a company for the five years, 2014 to 2018
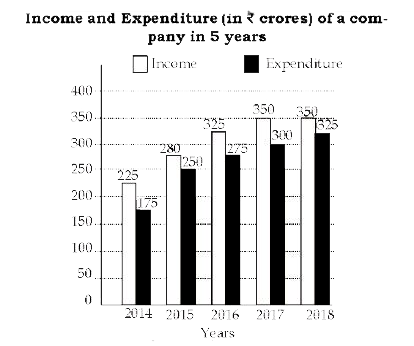
The total income of the company in 2015, 2017 and 2018 is approximately what percent less than the total Expenditure in the five years?
View Solution

