The following bar graph shows the price per square feet ( in Rs. ) of lands in different years.
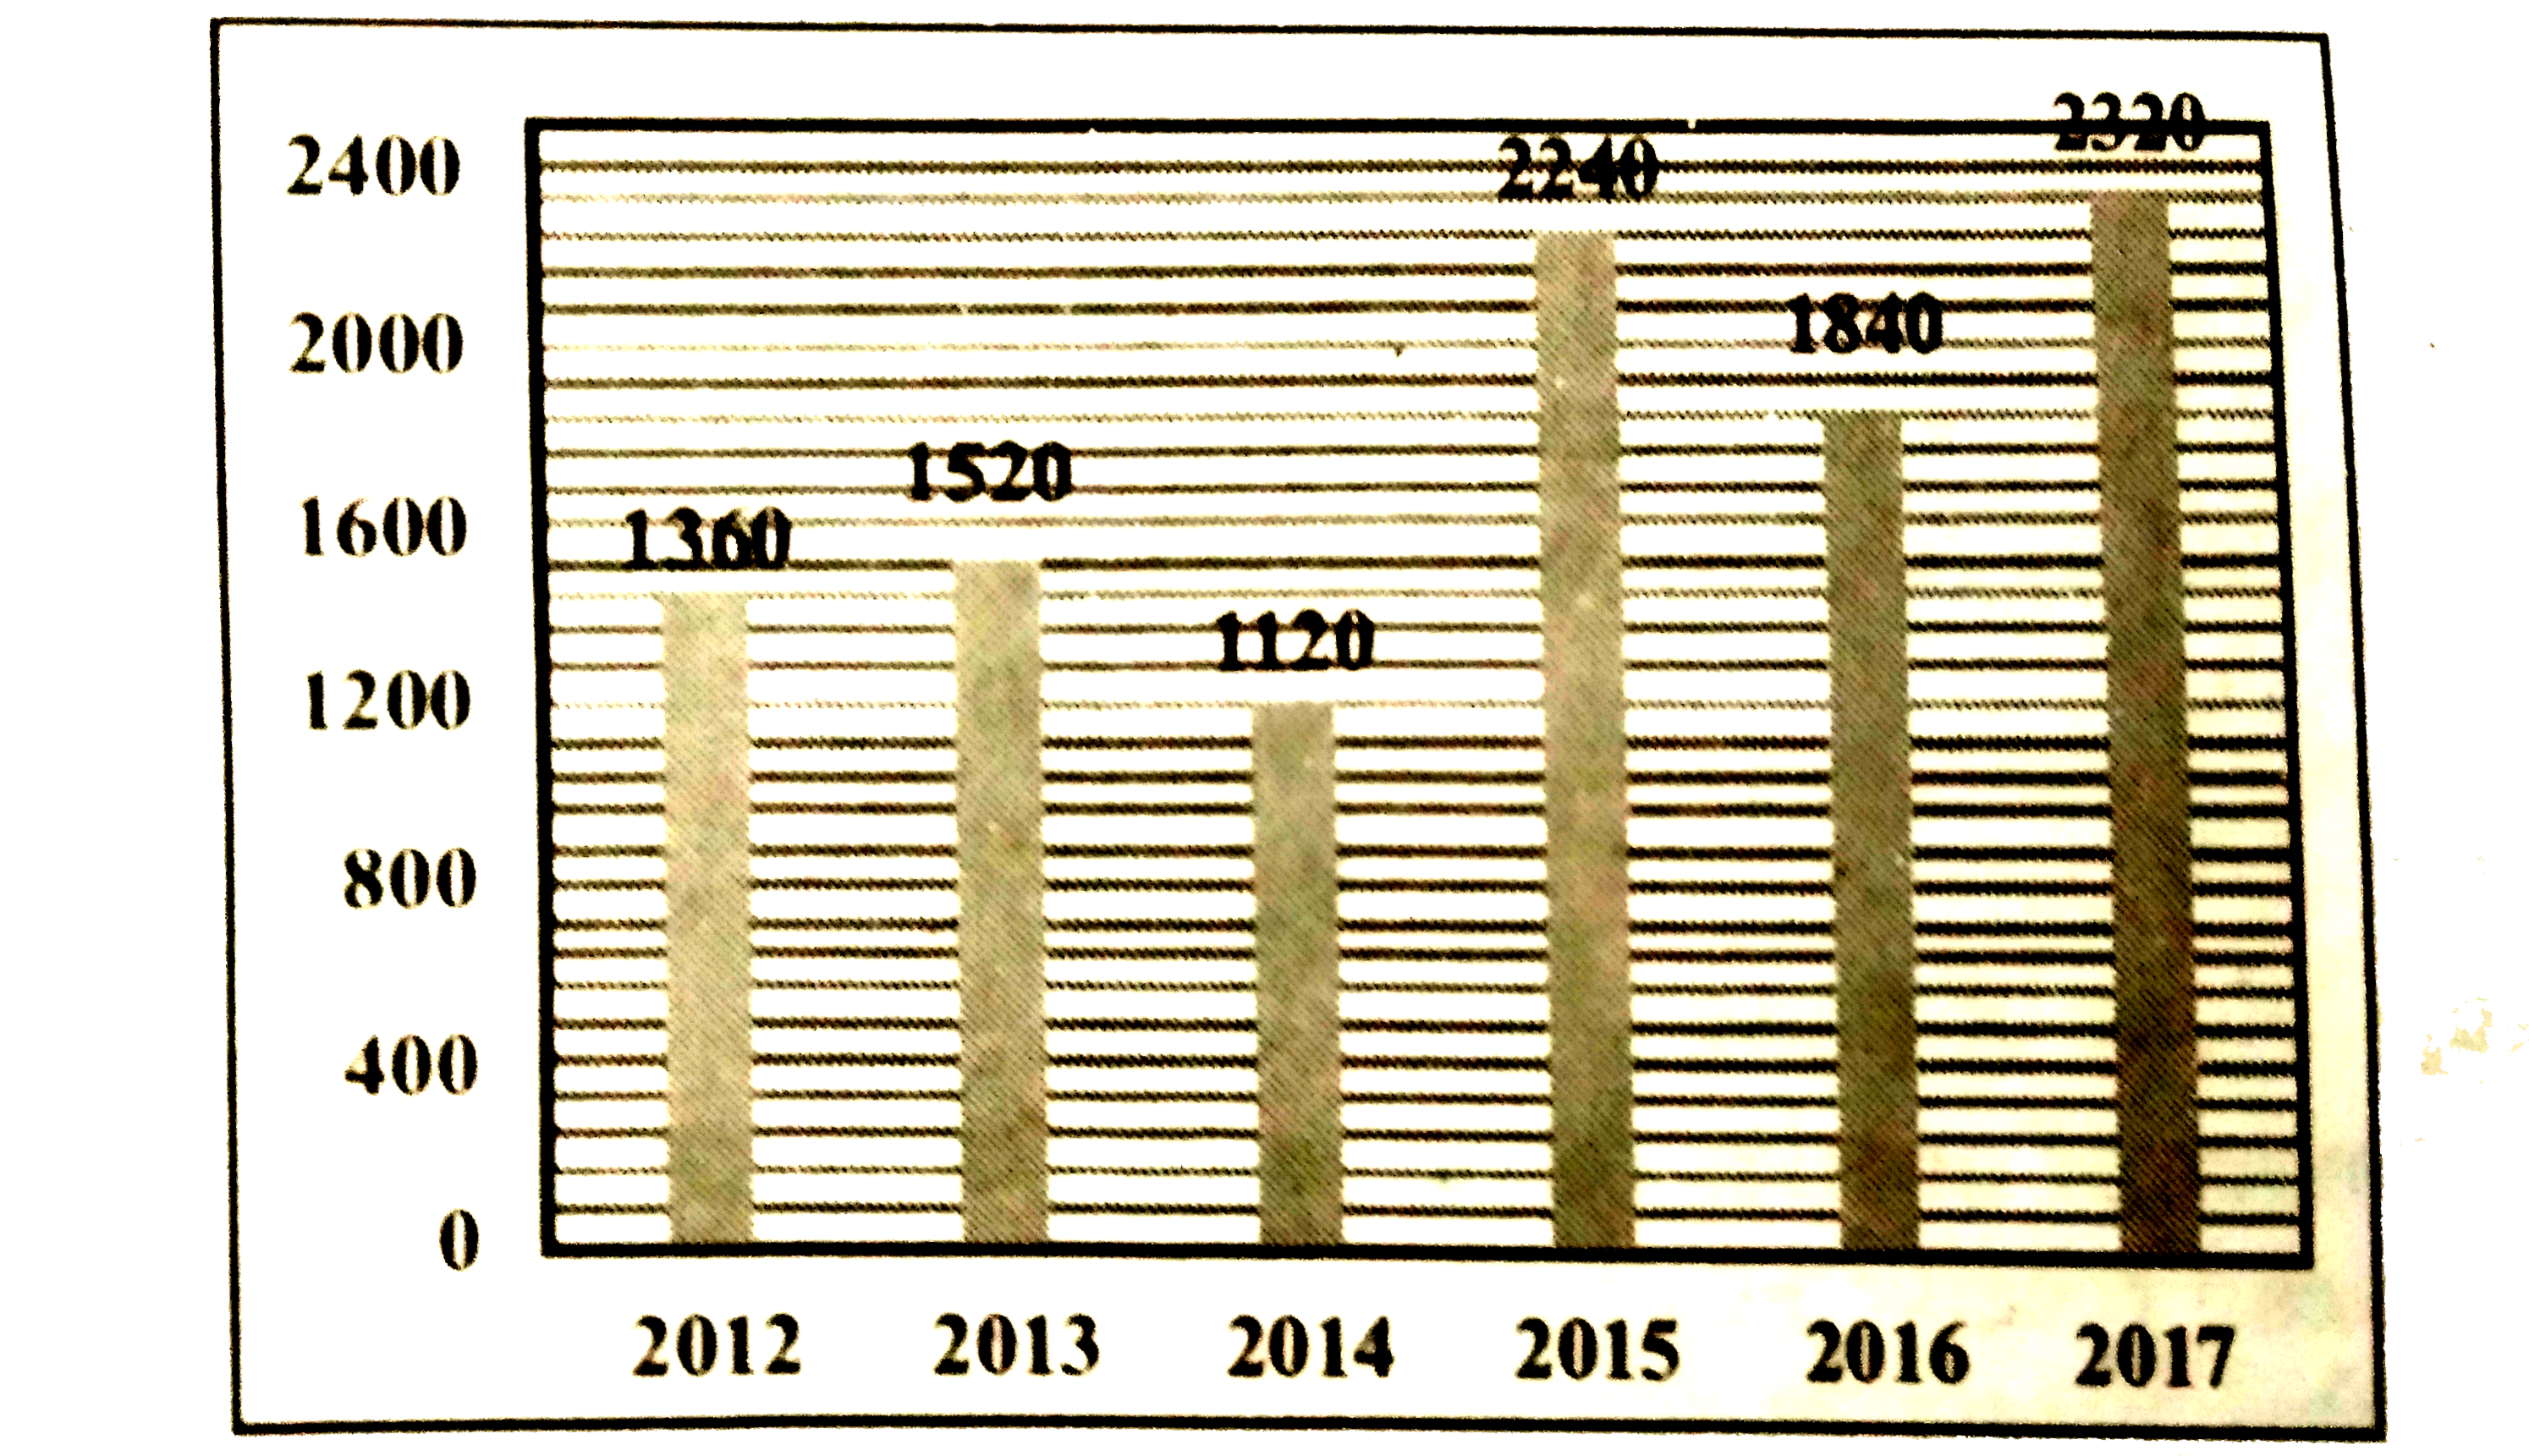
If Panas bought 3280 Square feet of land in the year 2014 and Nirmal bought 1820 Square feet of land in the year 2015, then find the ratio between the amount spent by Panas in the year 2014 to that of the amount spent bt Nirmal in the year 2015 ?
82:91
73:88
52:79
37:53
The correct Answer is:A
The amount spent by Panas in the year 2014 =>(3280∗1120)
The amount spent by Nirmal in the year 2015 =>(1820∗2240)
Required ratio =[3280∗1120]:[1820∗2240]
=2:91
Topper's Solved these Questions
Similar Questions
Study the following information carefully and answer the given questions: The following bar graph shows the price per square feet of lands in different years
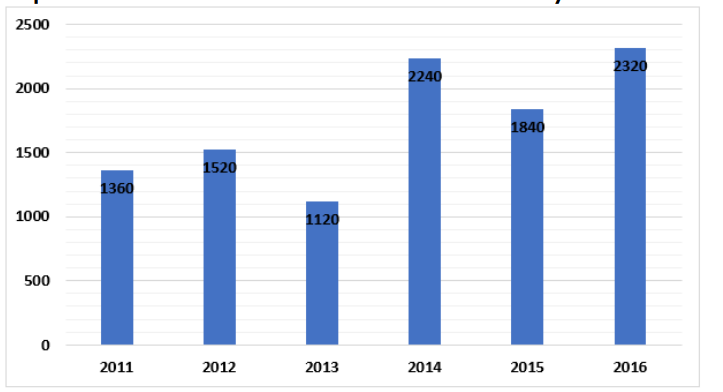
If Rahul bought 3280 Square feet of land in the year 2013 and Ragu bought 1820 Square feet of land in the year 2014, then find the ratio between the amount spent by Rahul in the year 2013 to that of the amount spent by Ragu in the year 2014?
View SolutionThe following bar graph shows the price per square feet ( in Rs. ) of lands in different years.
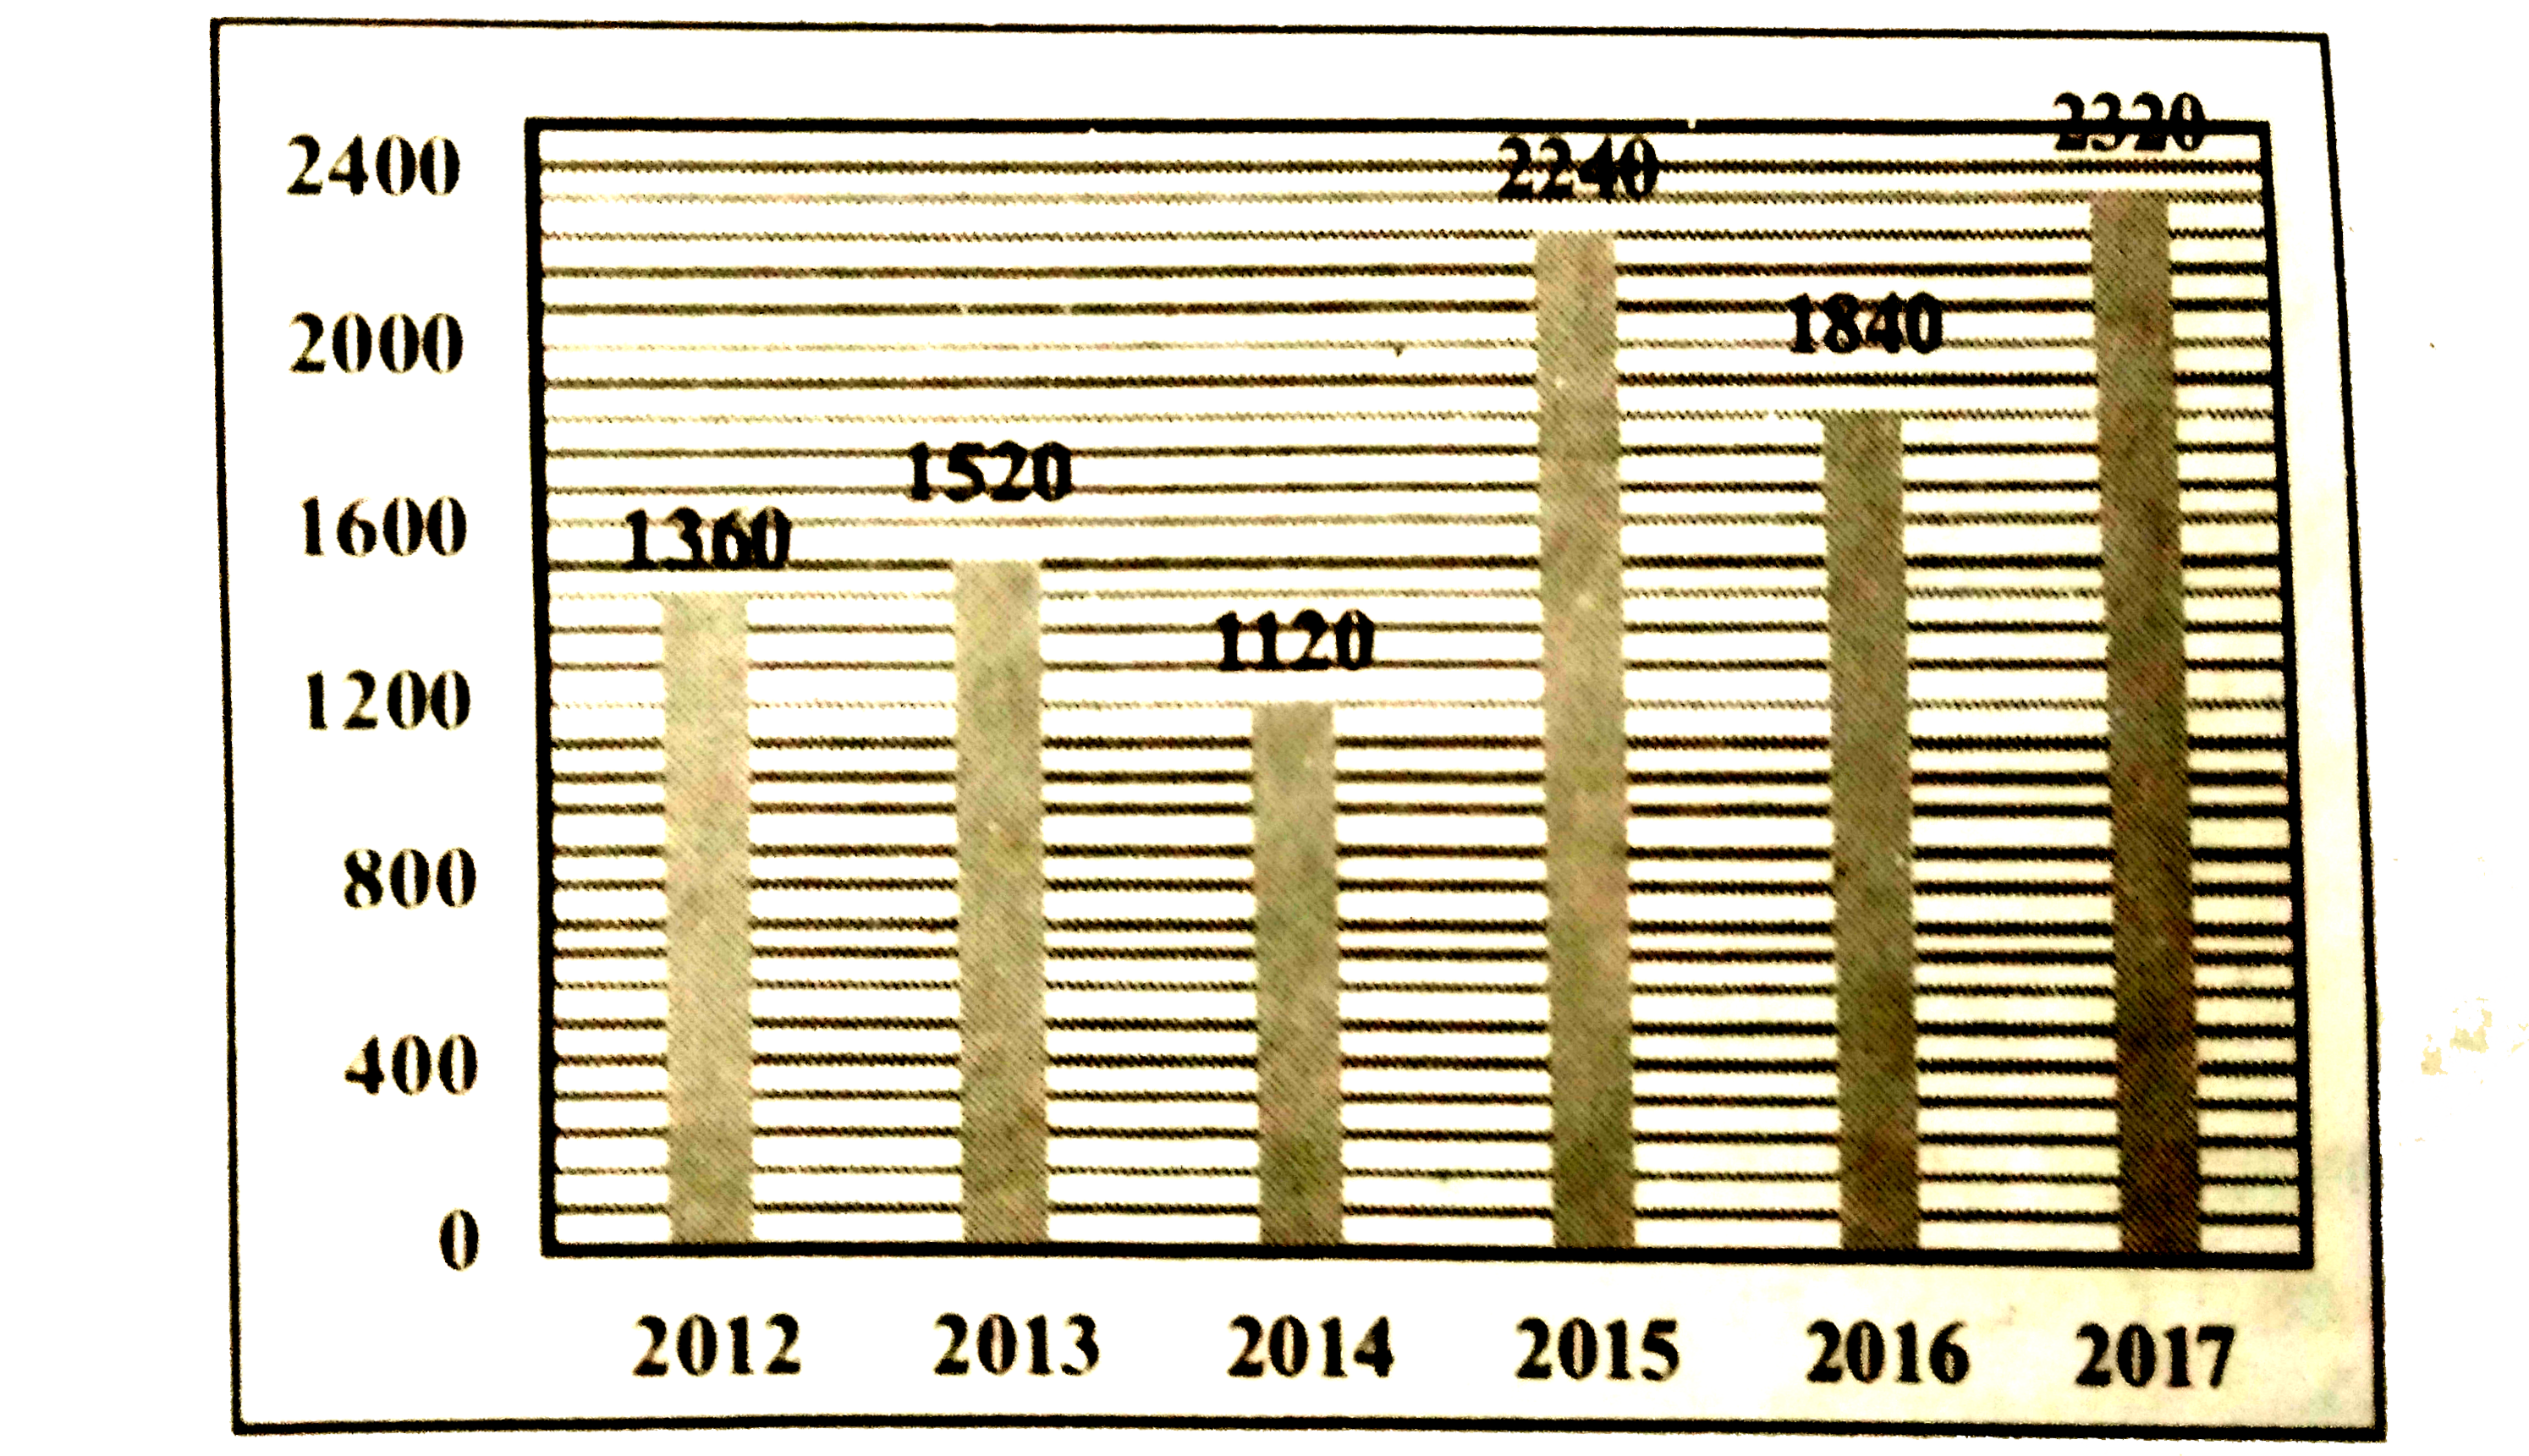
Find the average price per square feet of land in all the given years except 2016 ?
View Solution
Knowledge Check
The extra amount spent on commodities B and C in the year 2019 as compared to that in the year 2016, is:
ARs. 248BRs. 192CRs. 260DRs. 110The ratio of the total amount spent on A and D commodities in the year 2019 is:
A3:8B6:17C1:1D15:17
The following bar graph shows the price per square feet ( in Rs. ) of lands in different years.
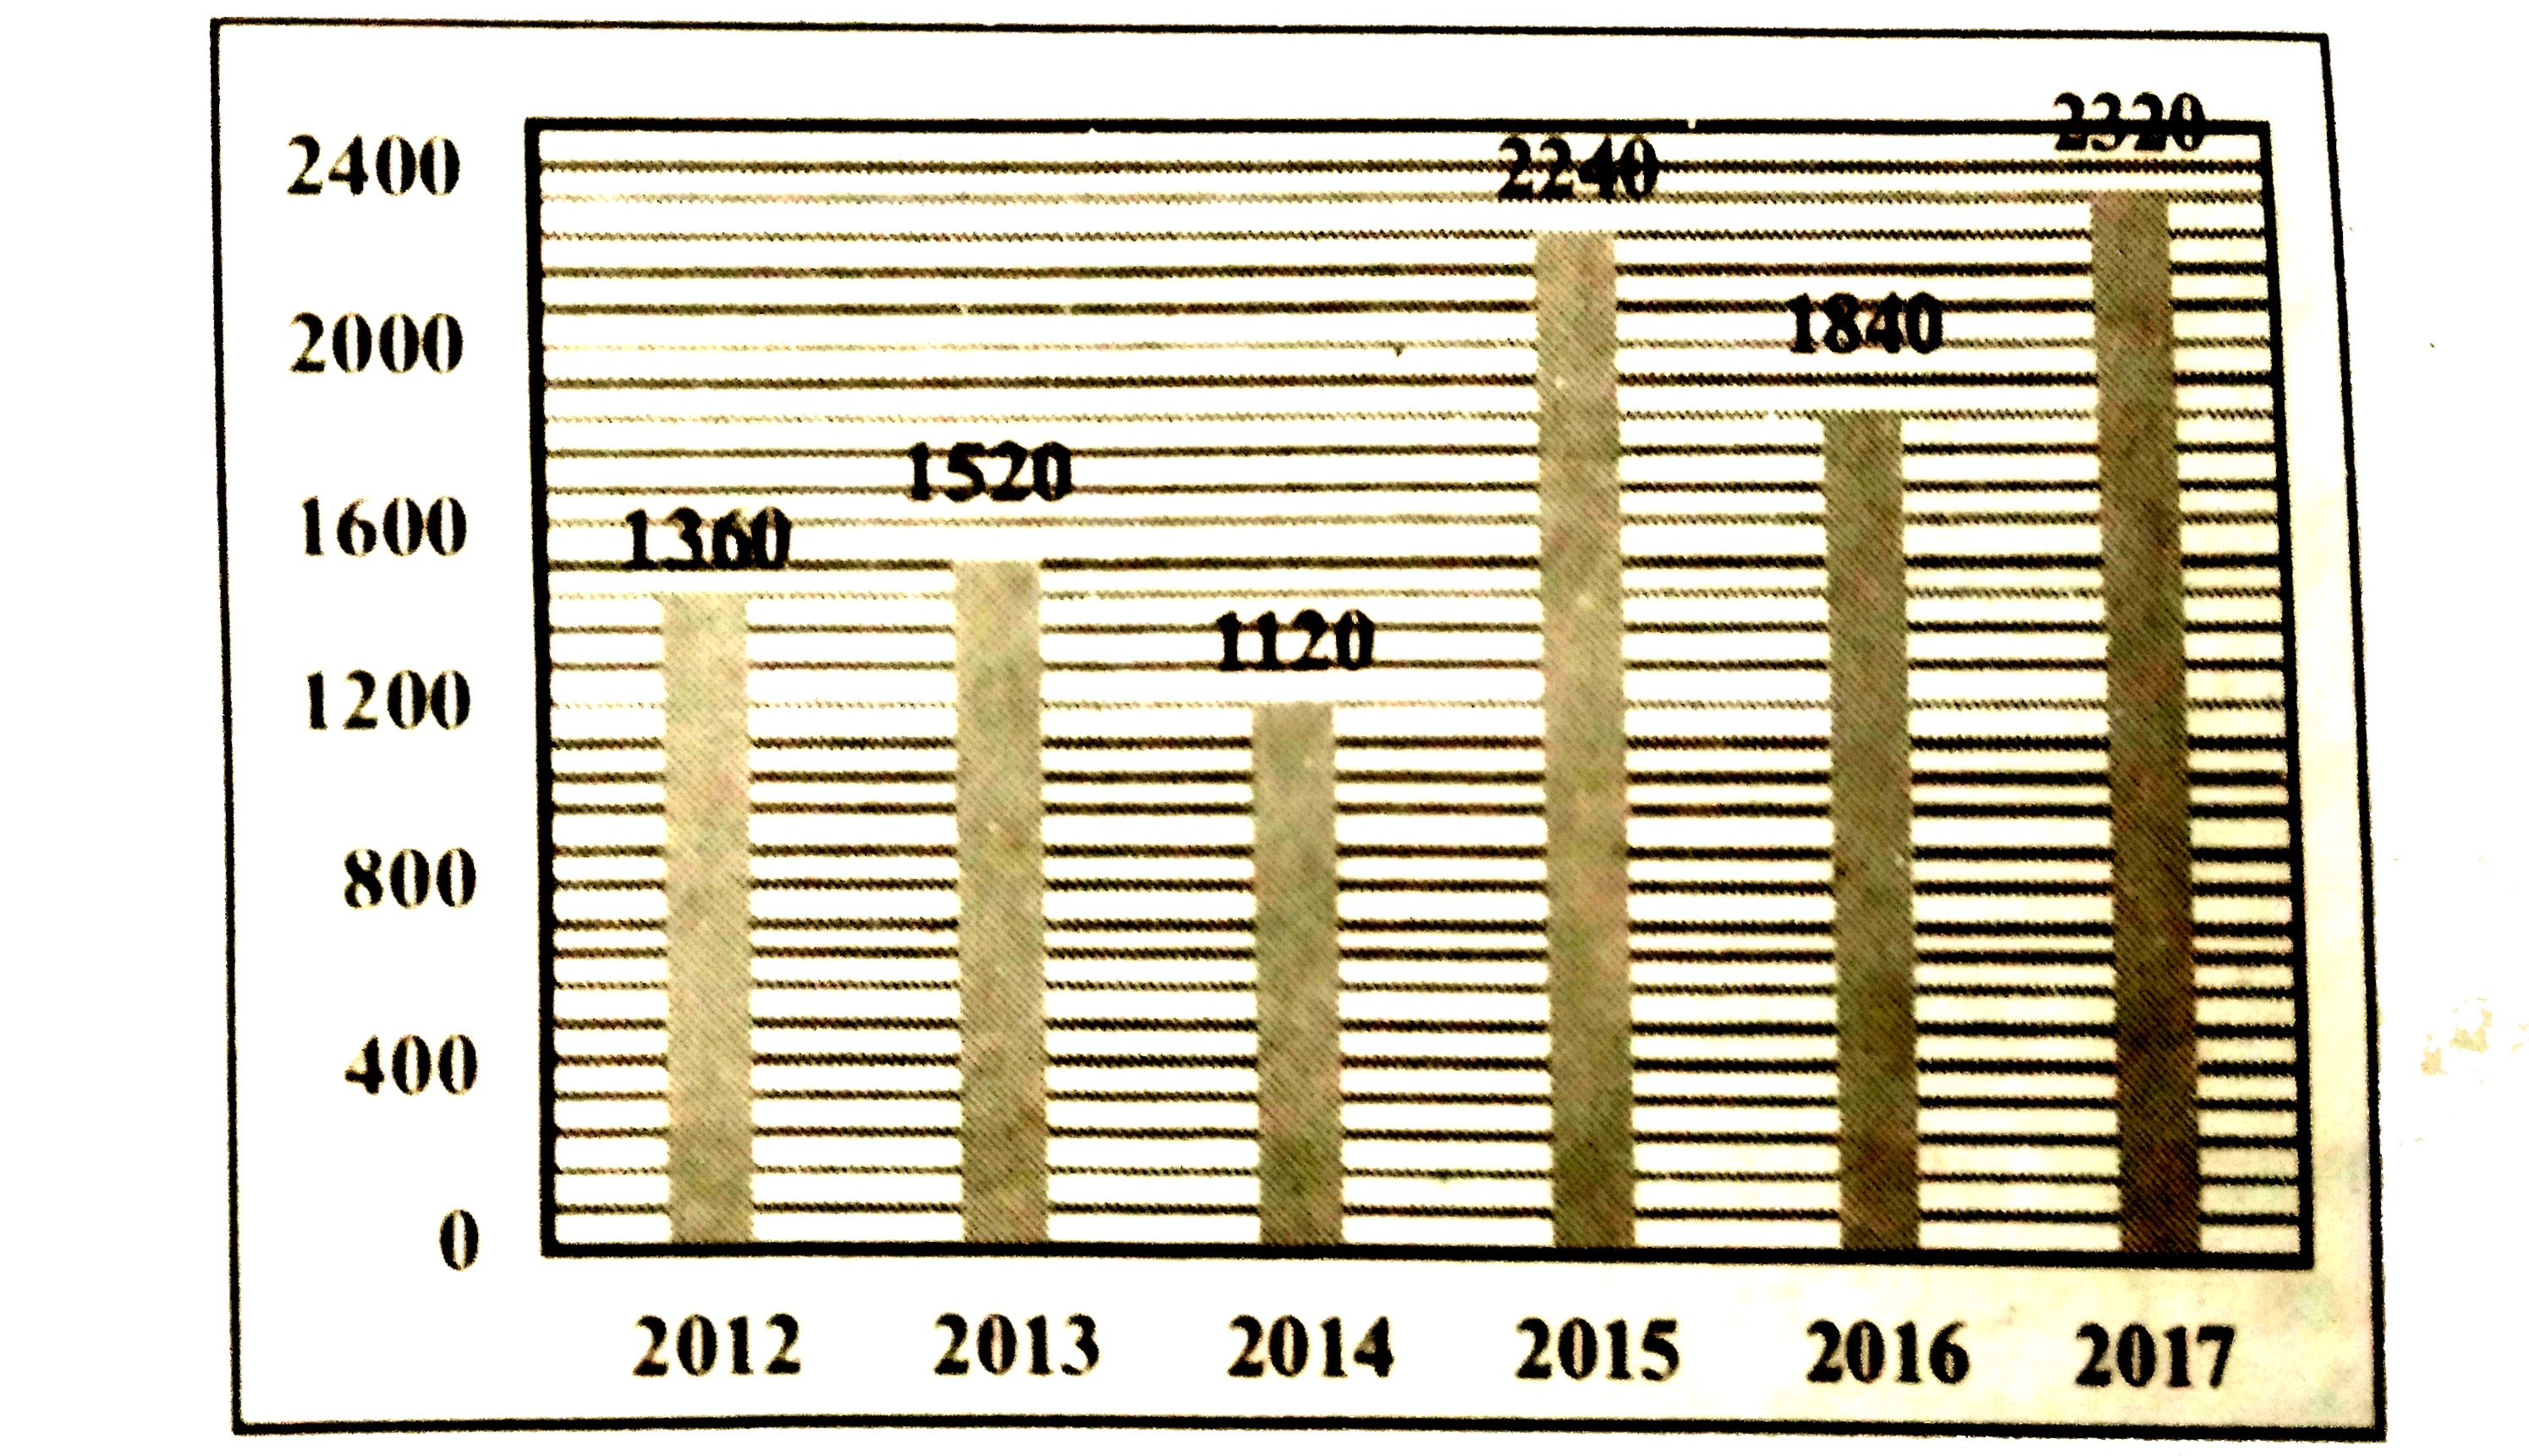
Dipika bought 1860 Square feet and 1240 Square feet of land in the year 2014 and 2017 respecrtively, then find the total amount spent by Dipak in both 2014 and 2017 together ?
View SolutionThe following bar graph shows the price per square feet ( in Rs. ) of lands in different years.
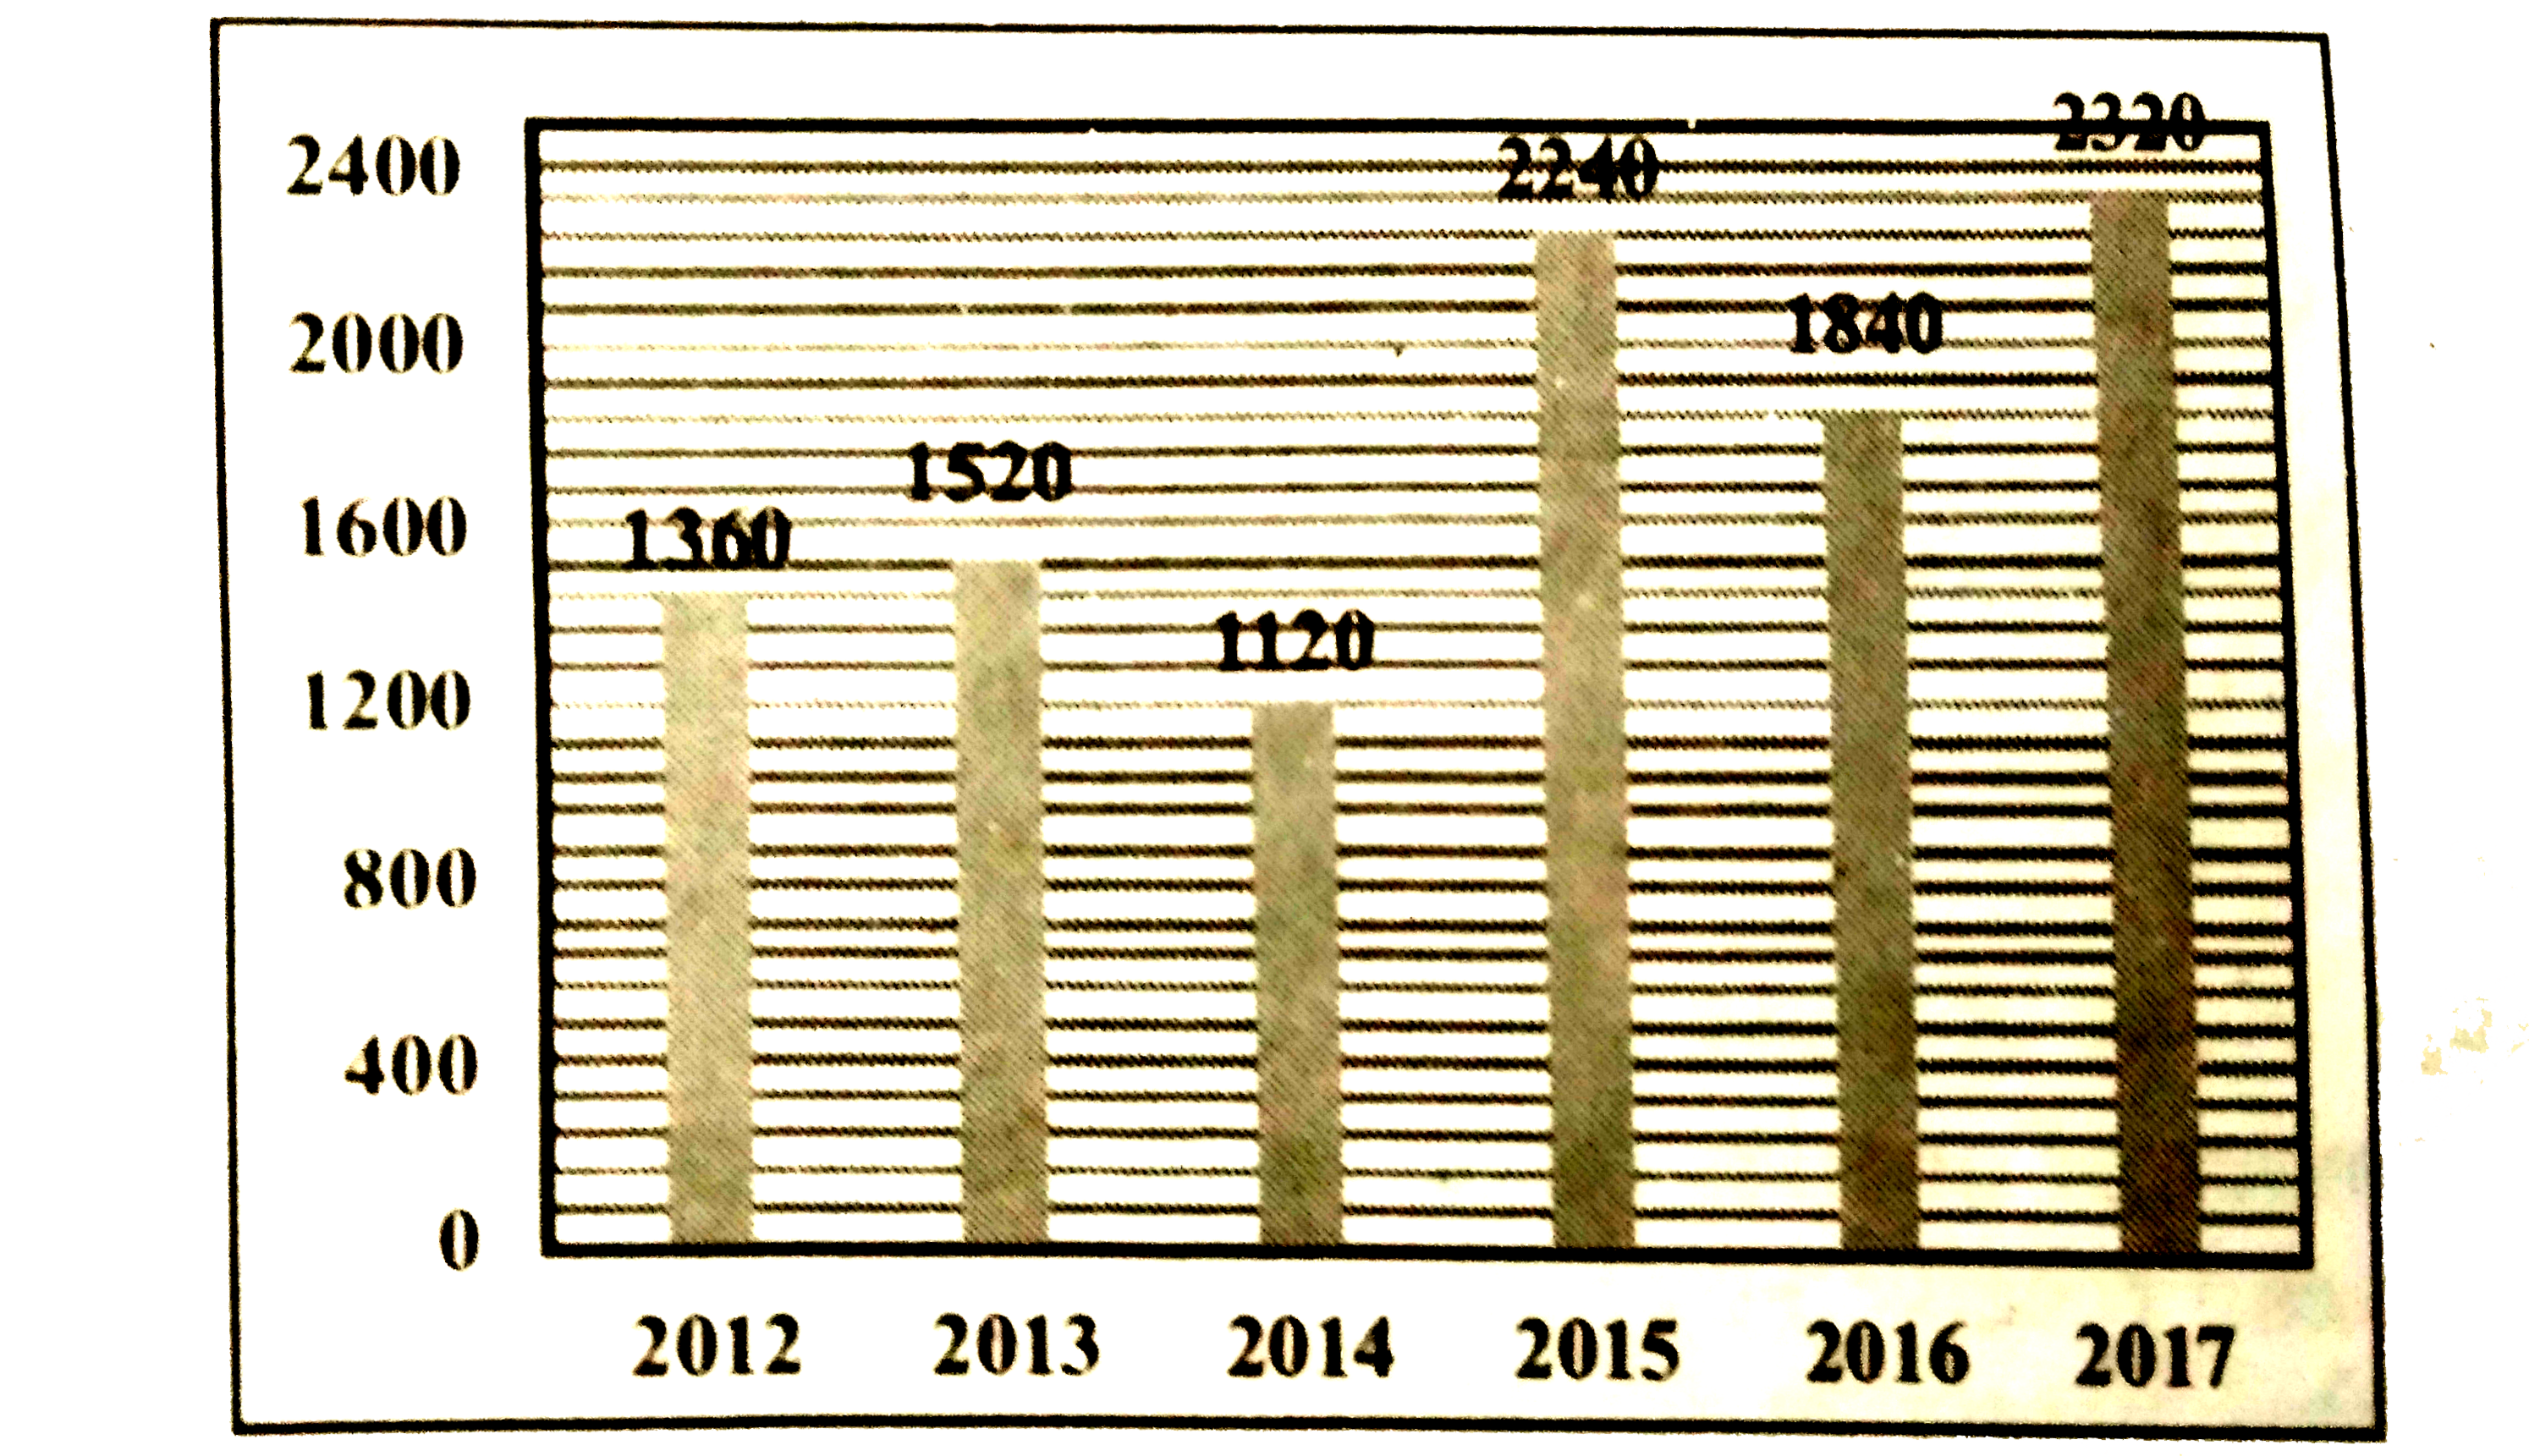
If the amount spent by Krishan to buy a land in the year 2013 is 38 laks, then find the area of land bought by Krishna in the year 2013?
View SolutionThe following bar graph shows the price per square feet ( in Rs. ) of lands in different years.
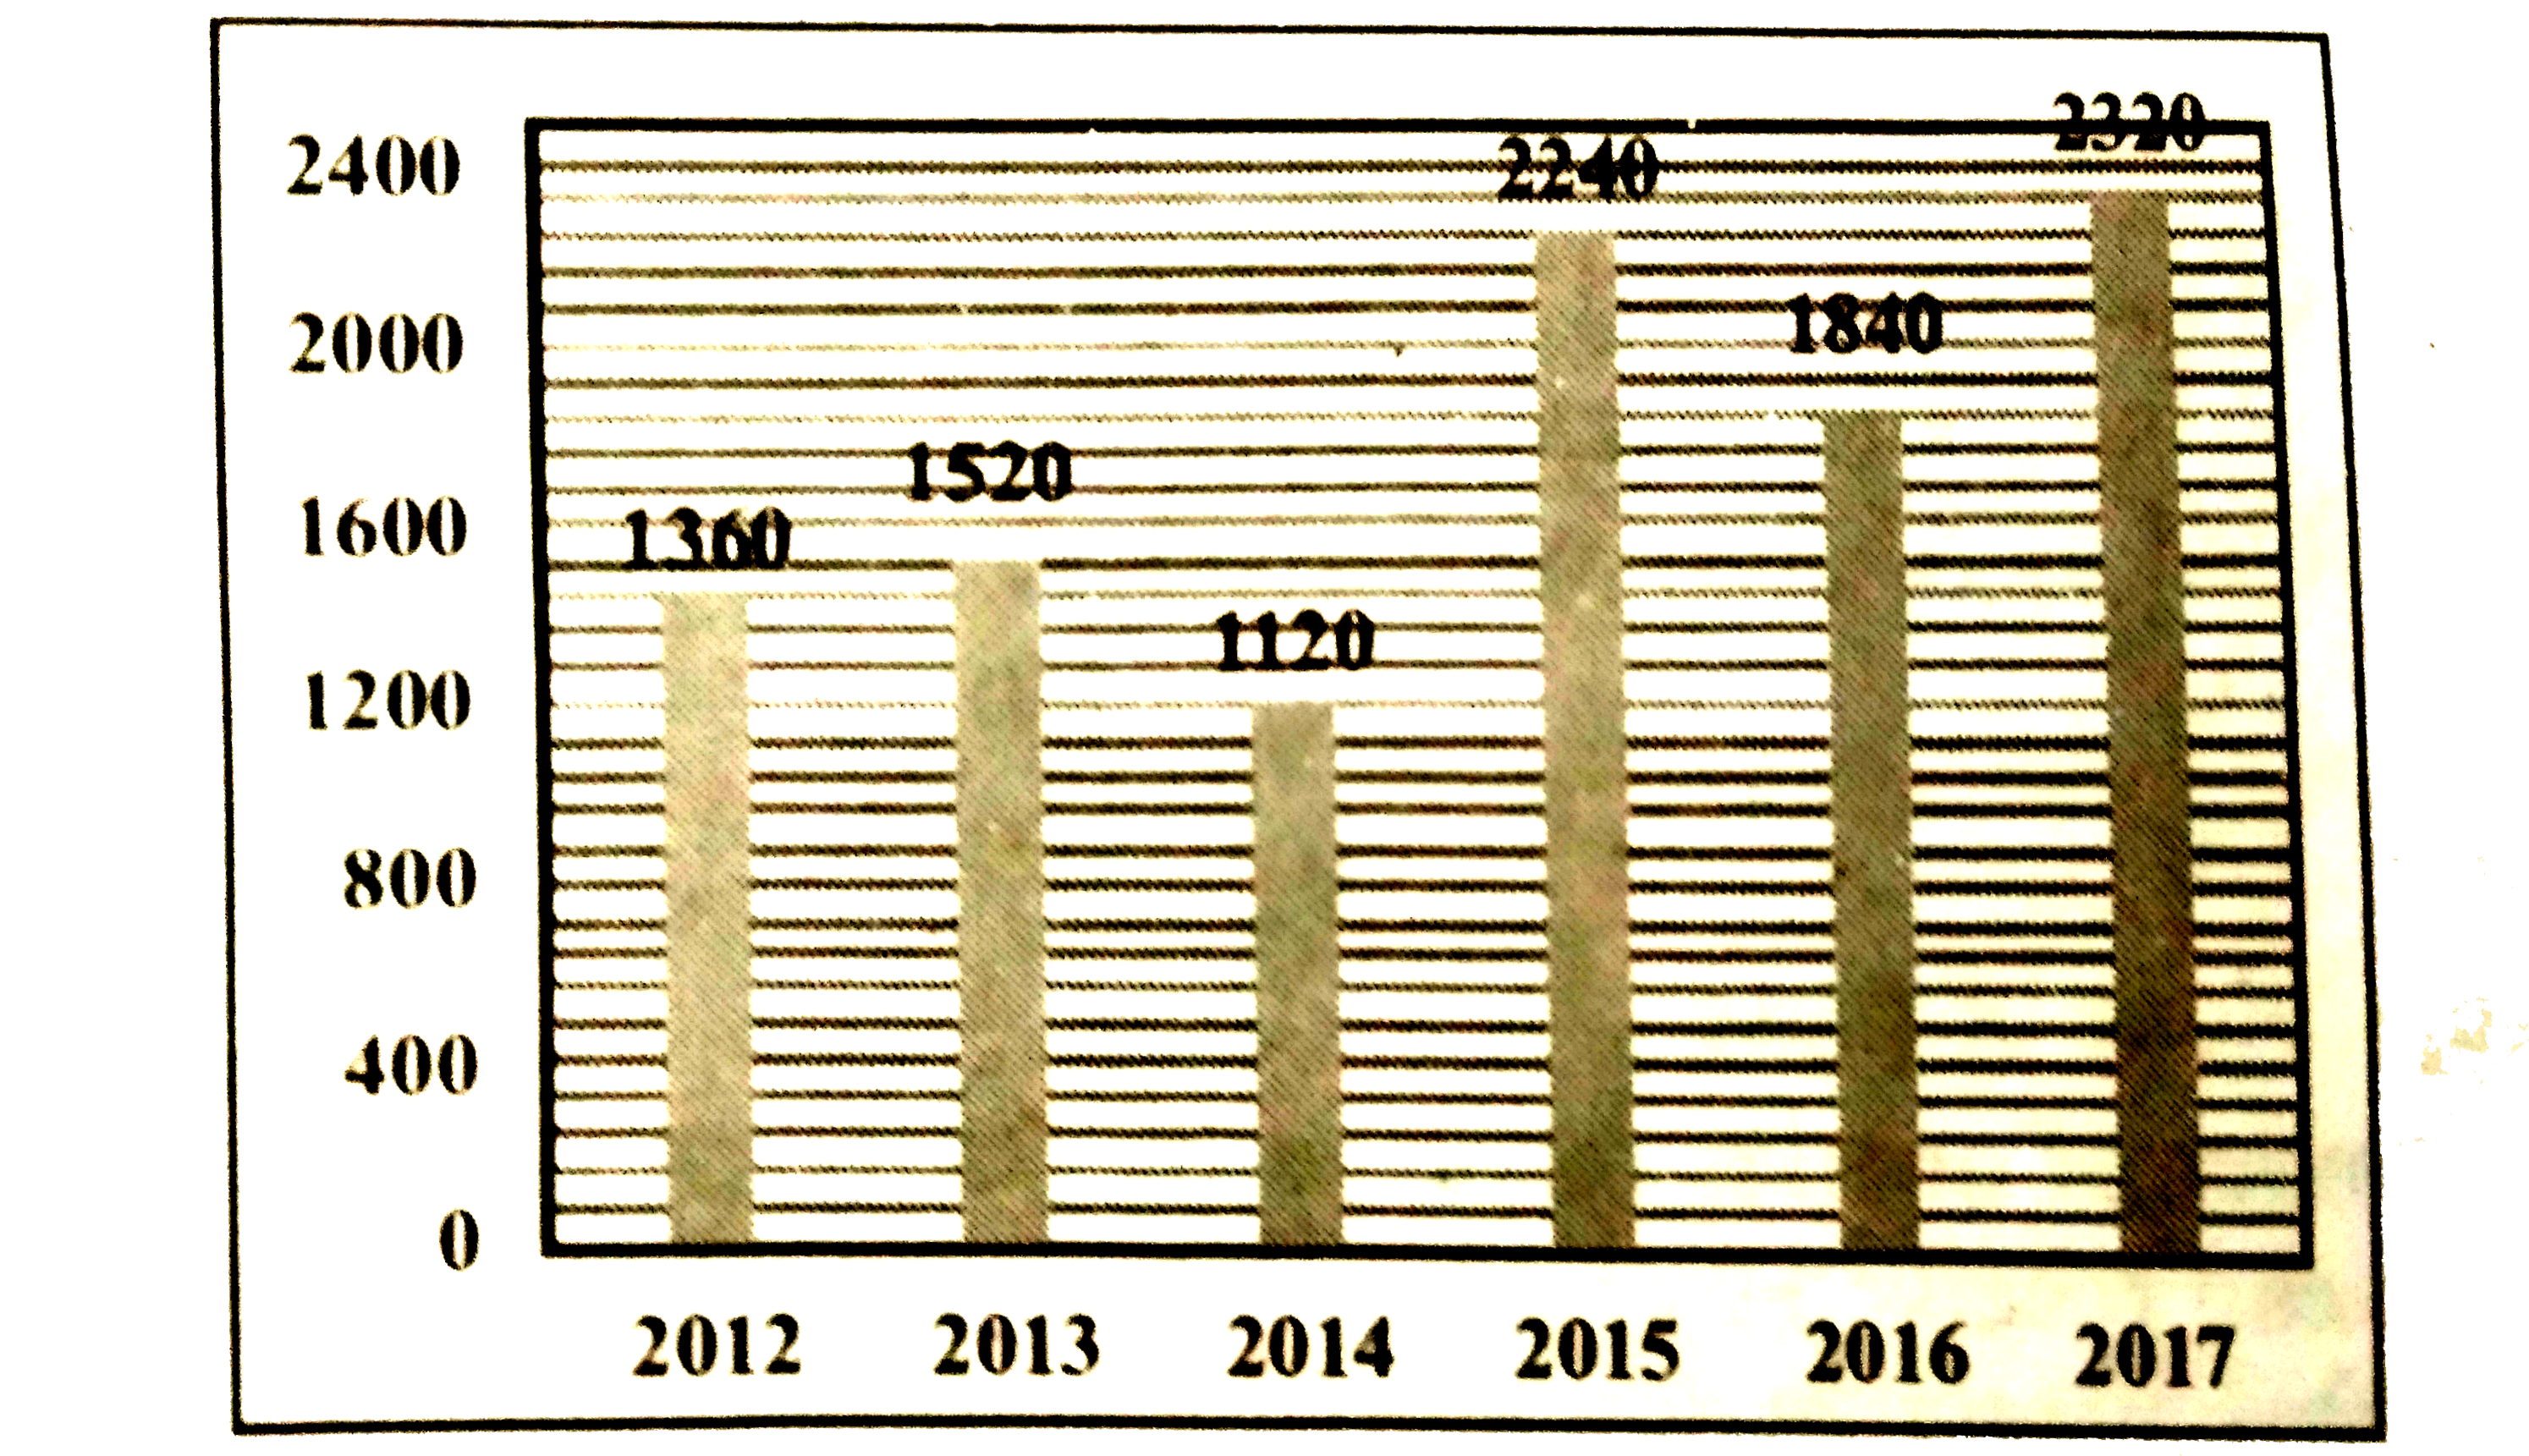
The price per square feet in the year 2012 and 2015 together is approximately what perentage of the price per square feet in the year 2013 and 2016 together?
View SolutionStudy the following information carefully and answer the given questions: The following bar graph shows the price per square feet of lands in different years

Ravi bought 1860 Square feet and 1240 Square feet of land in the year 2013 and 2016 respectively, then find the total amount spent by Ravi in both 2013 and 2016 together?
View Solution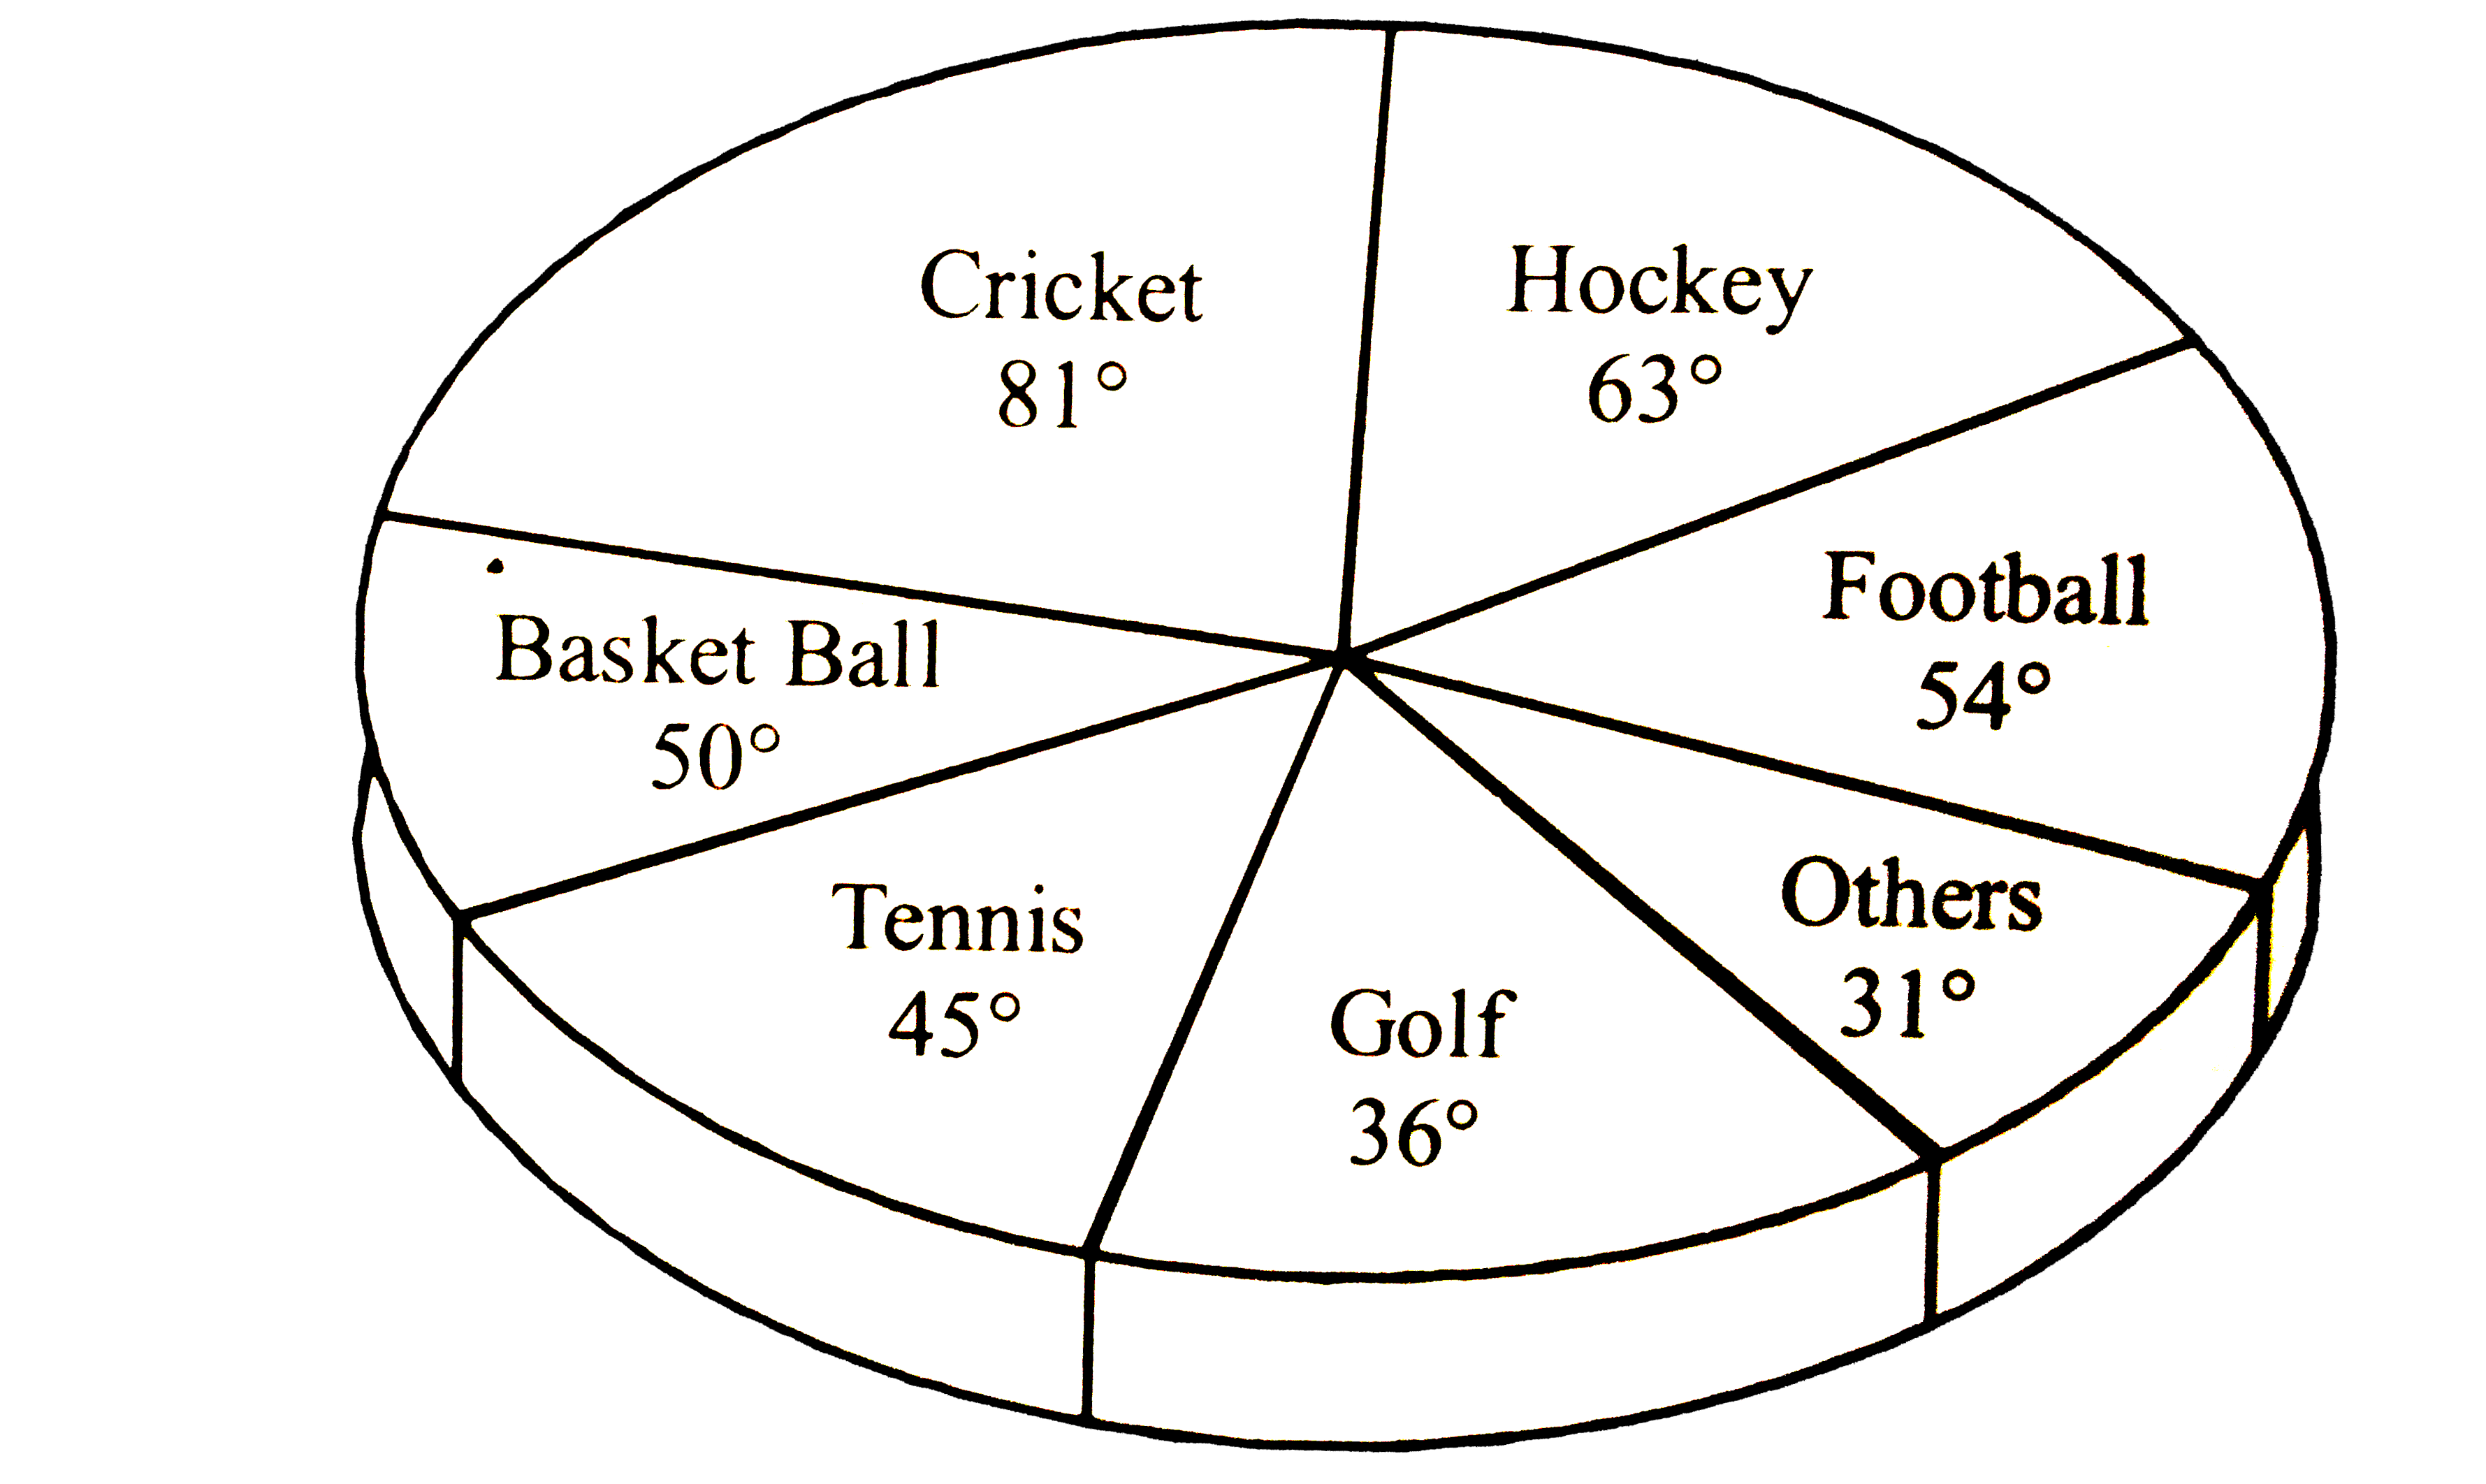
If the total amount spent on sports during the year was Rs. 2 crore, the amount spent on circket hockey together was
View Solution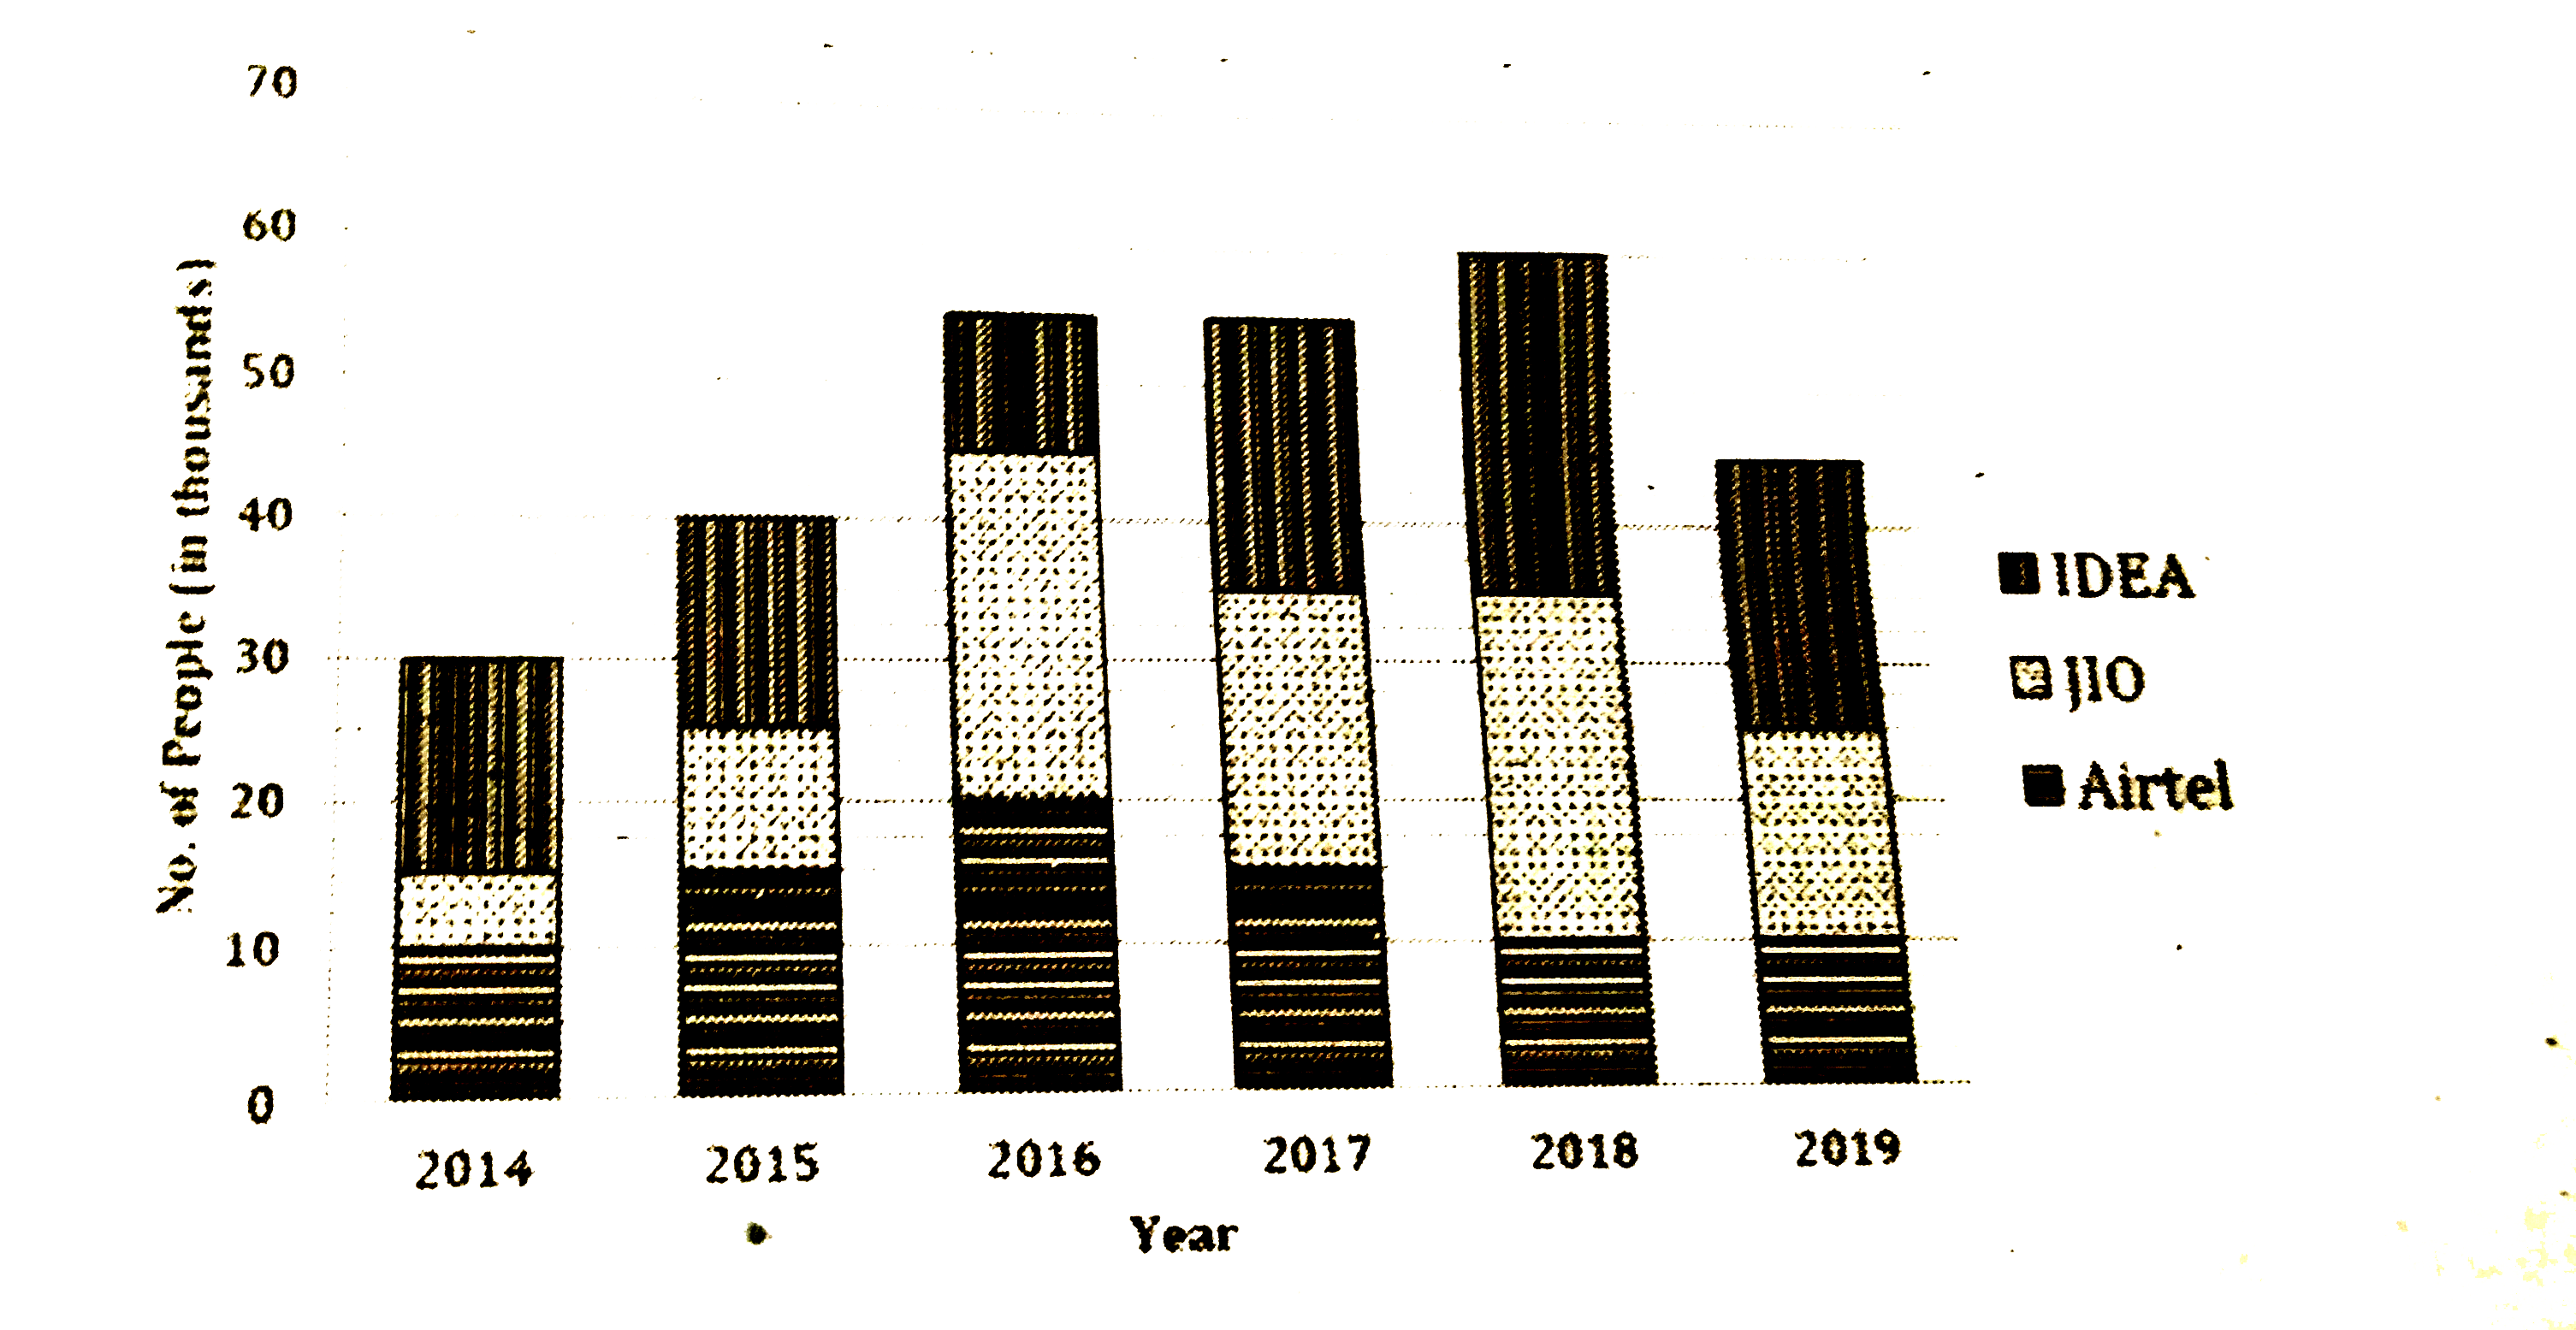
What is the ratio of the number of people using mobile service of AIRTEL in the year 2015 to that of whose using the same service in the year 2014 ?
View Solution
