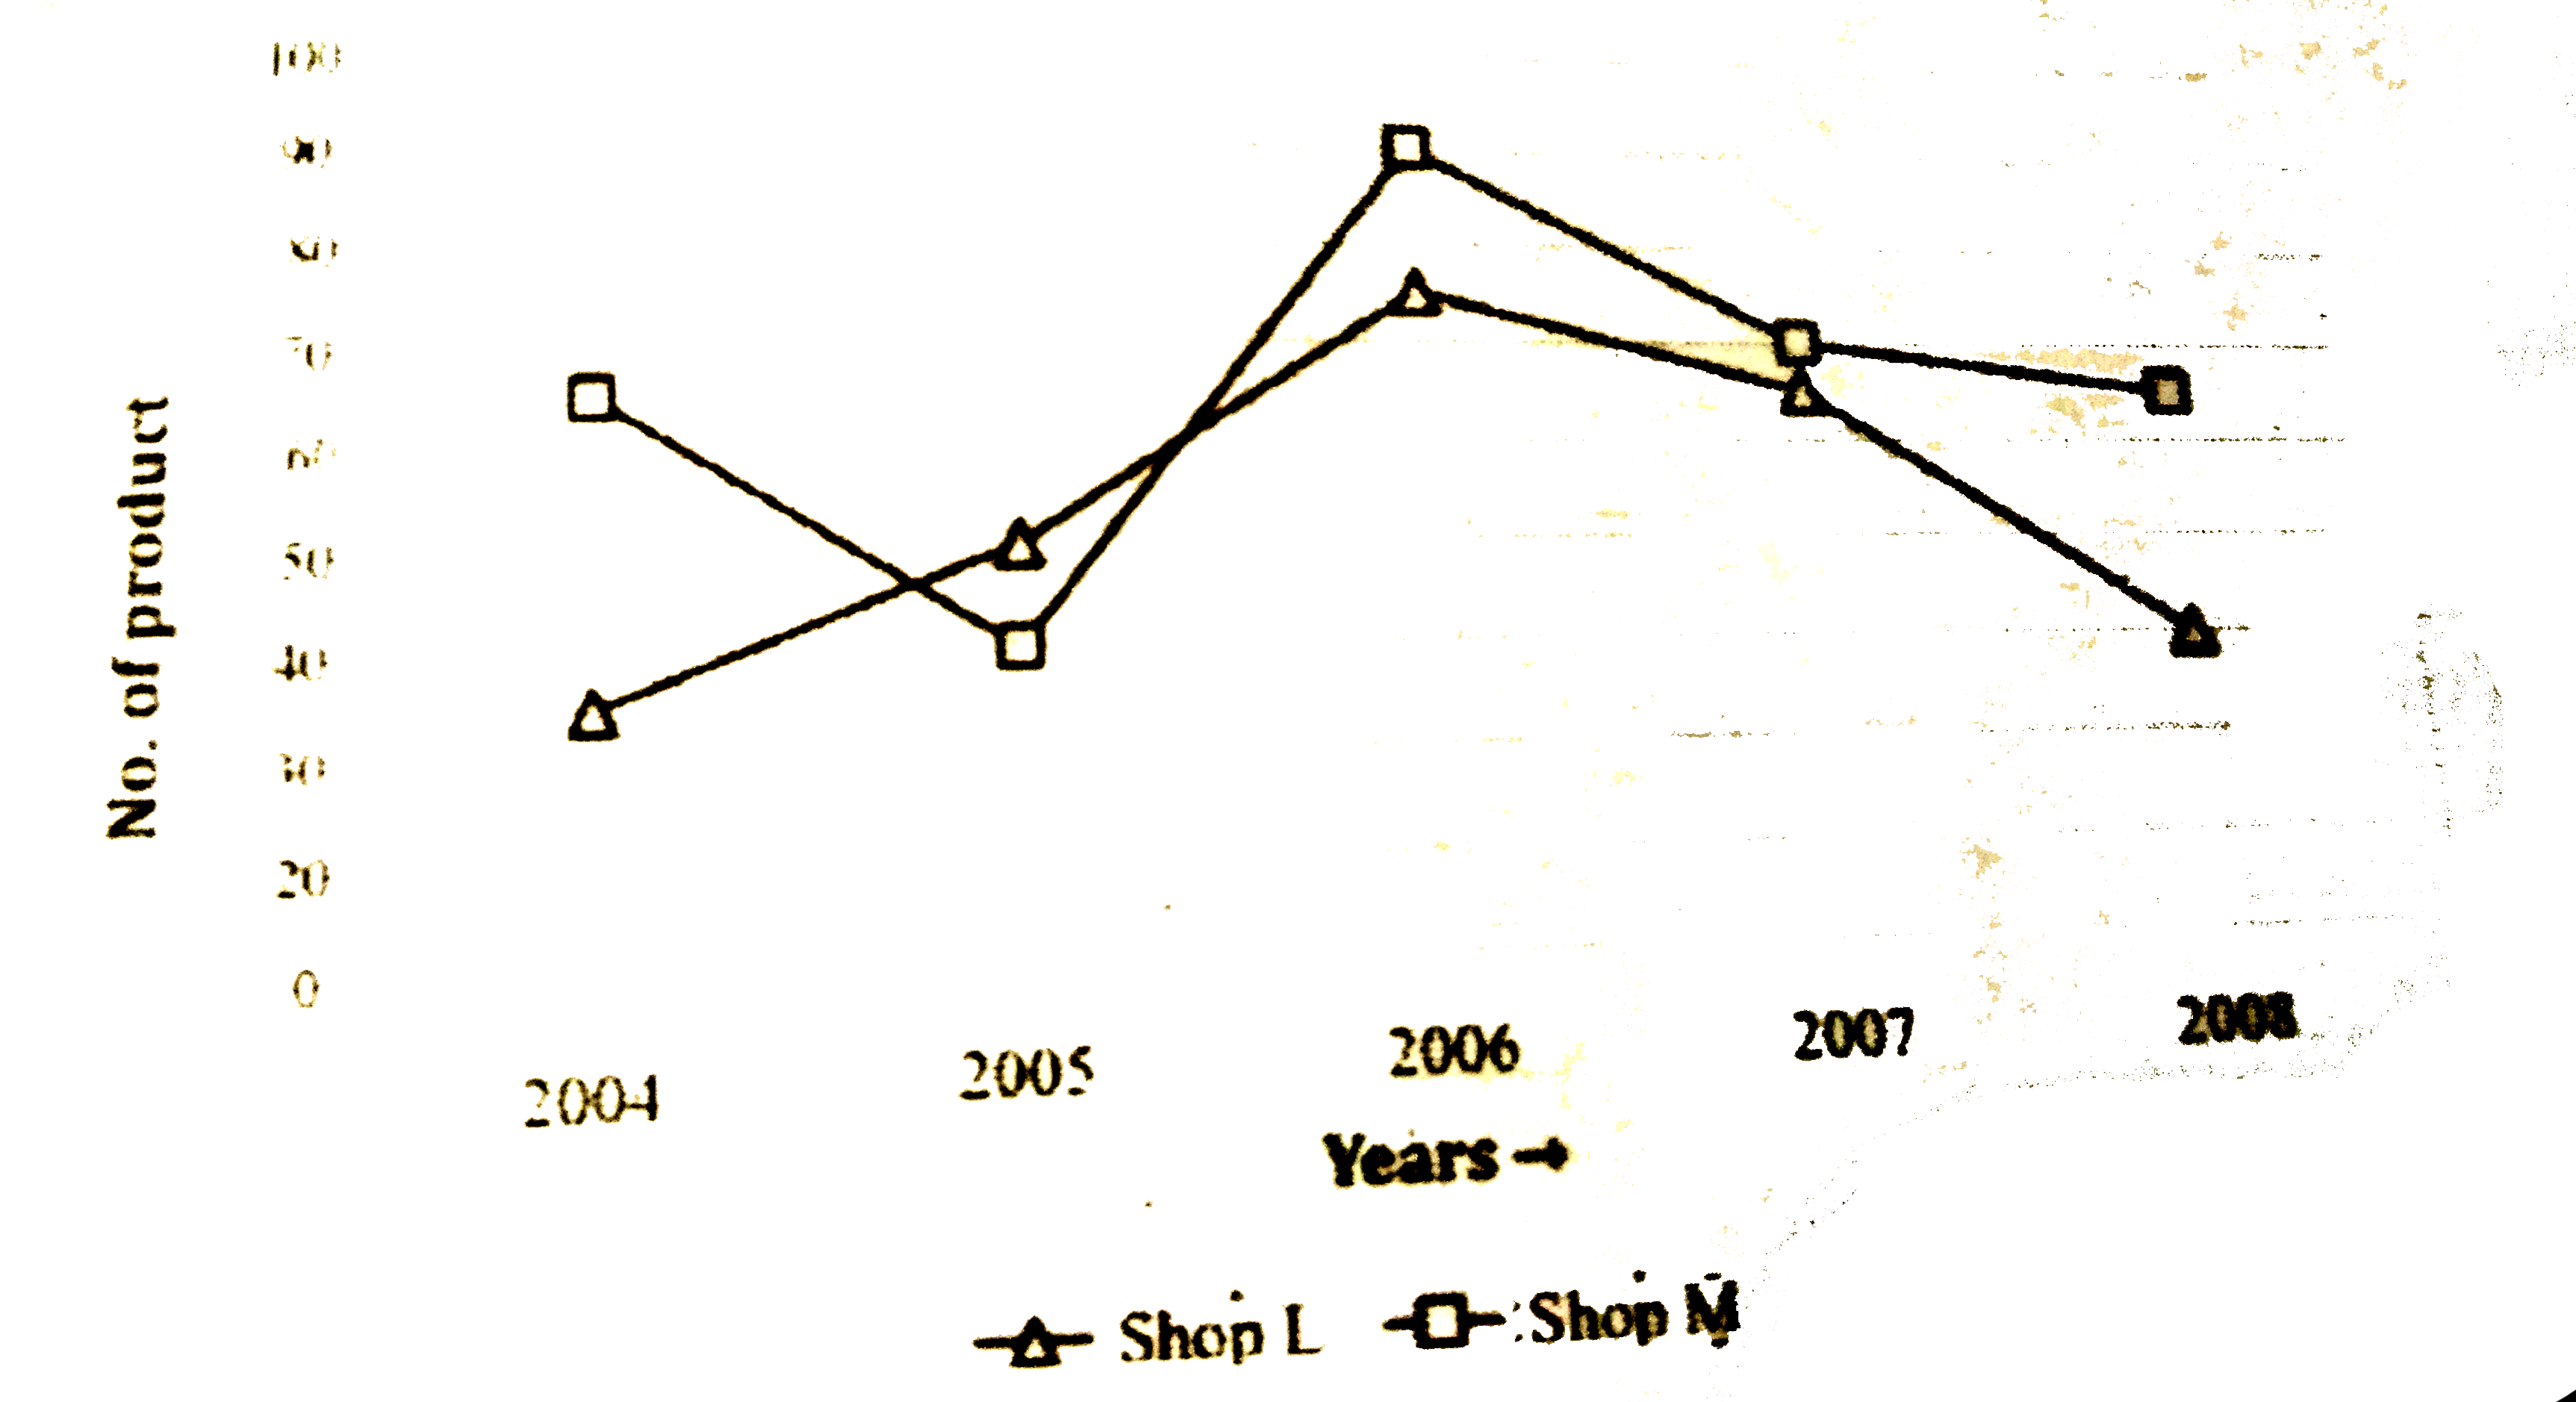
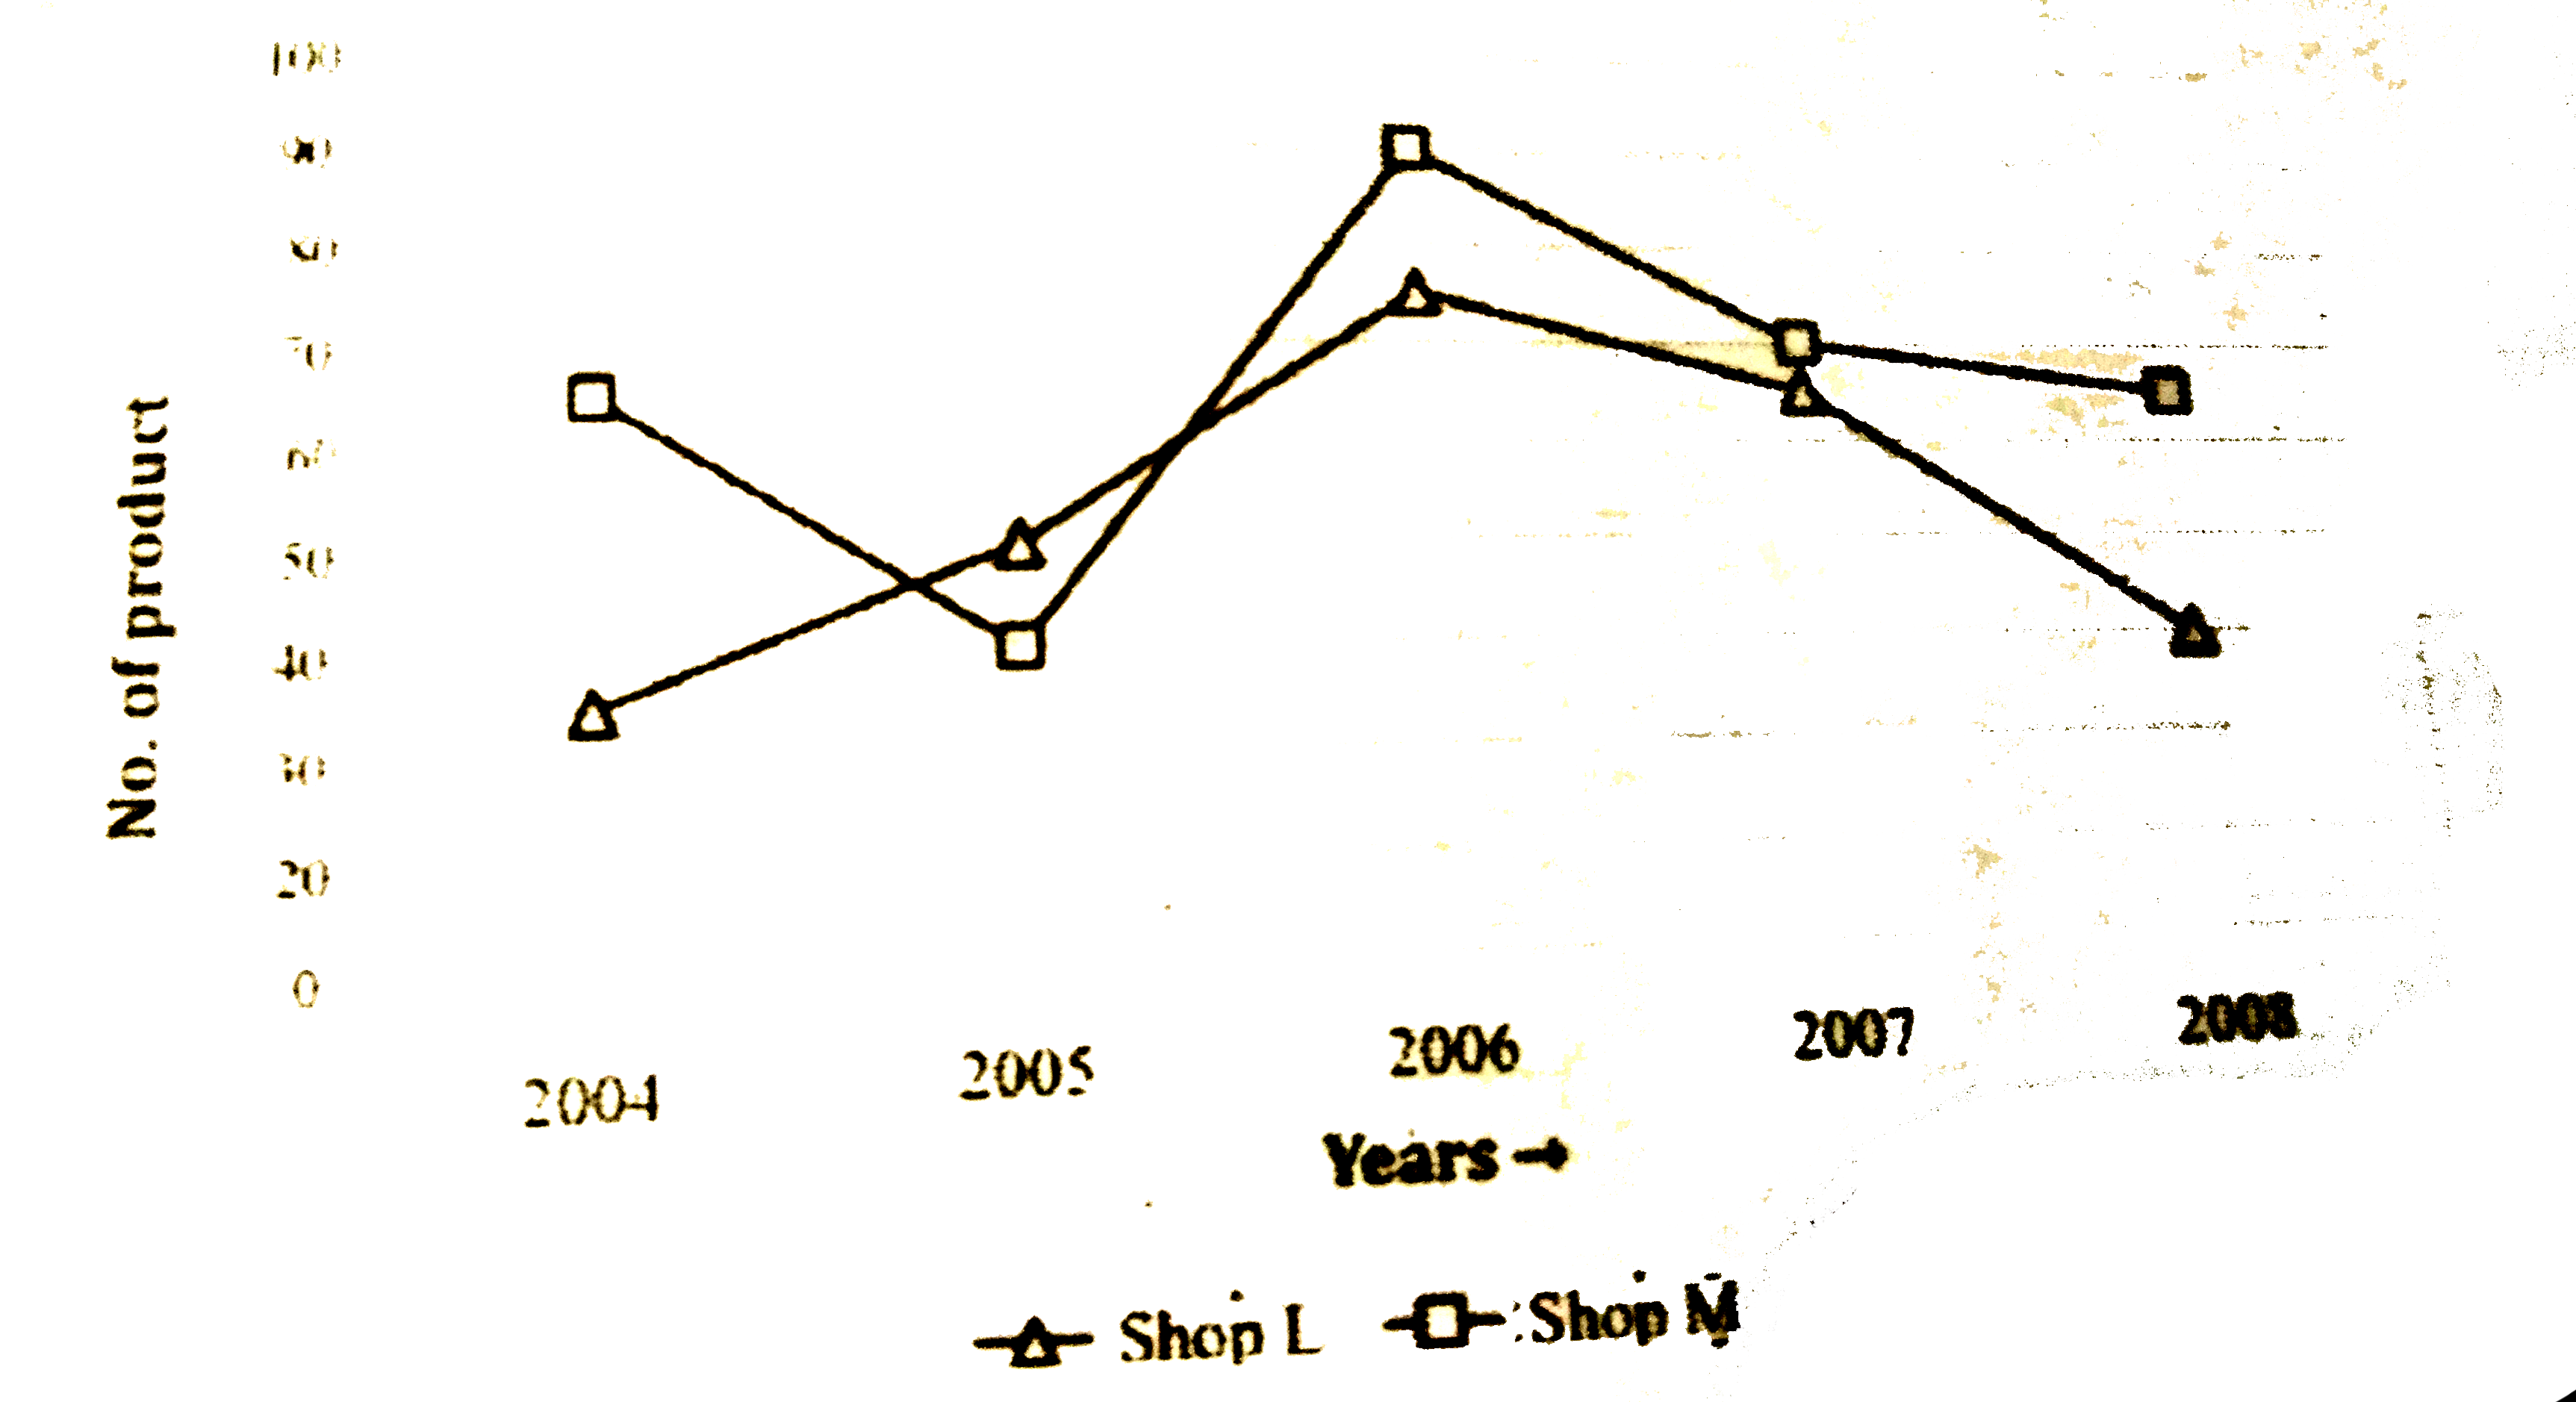
Line-graph given below shows the total no. of products for (child+parent) in two different shop L & M in five different years.
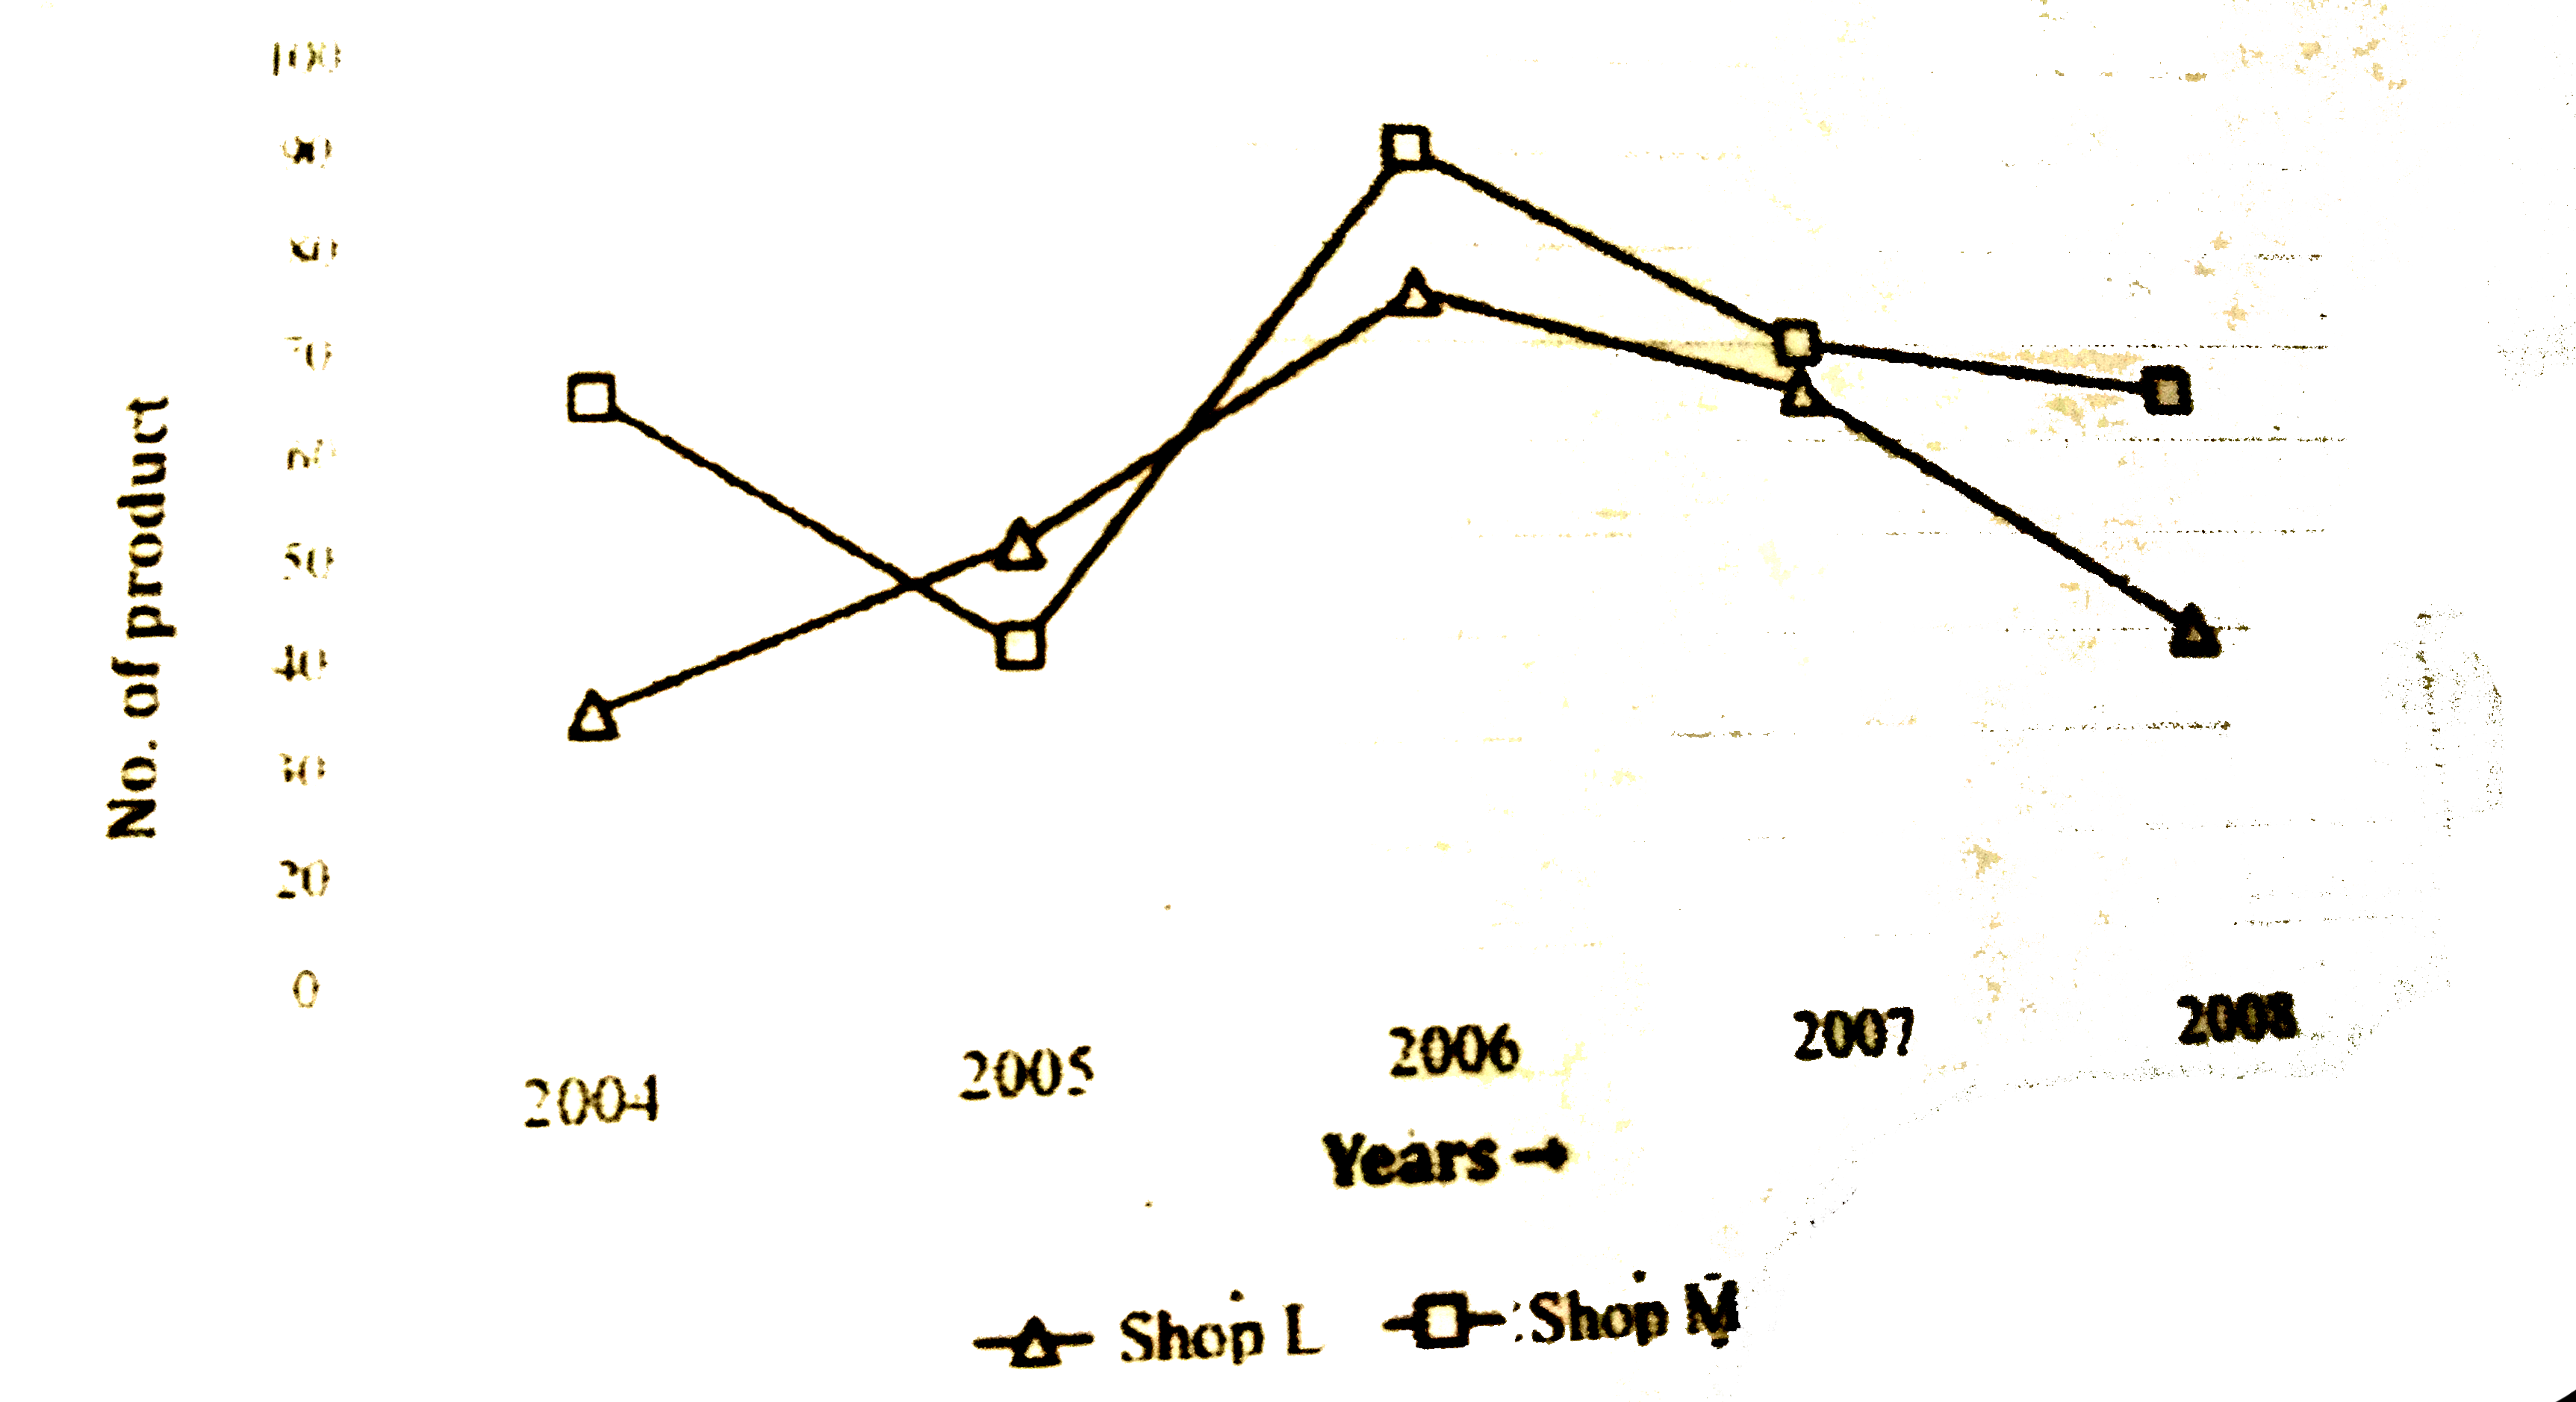
What is the differece betweent total no. of products in shop L in year 2007 & 2008 together and total no. of product in year 2004 ?
a) None of these
b) 10
c) 20
d) 5
Required difference
=(65+40)−(64+35)=5
Topper's Solved these Questions
Similar Questions
Line-graph given below shows the total no. of products for (child+parent) in two different shop L & M in five different years.
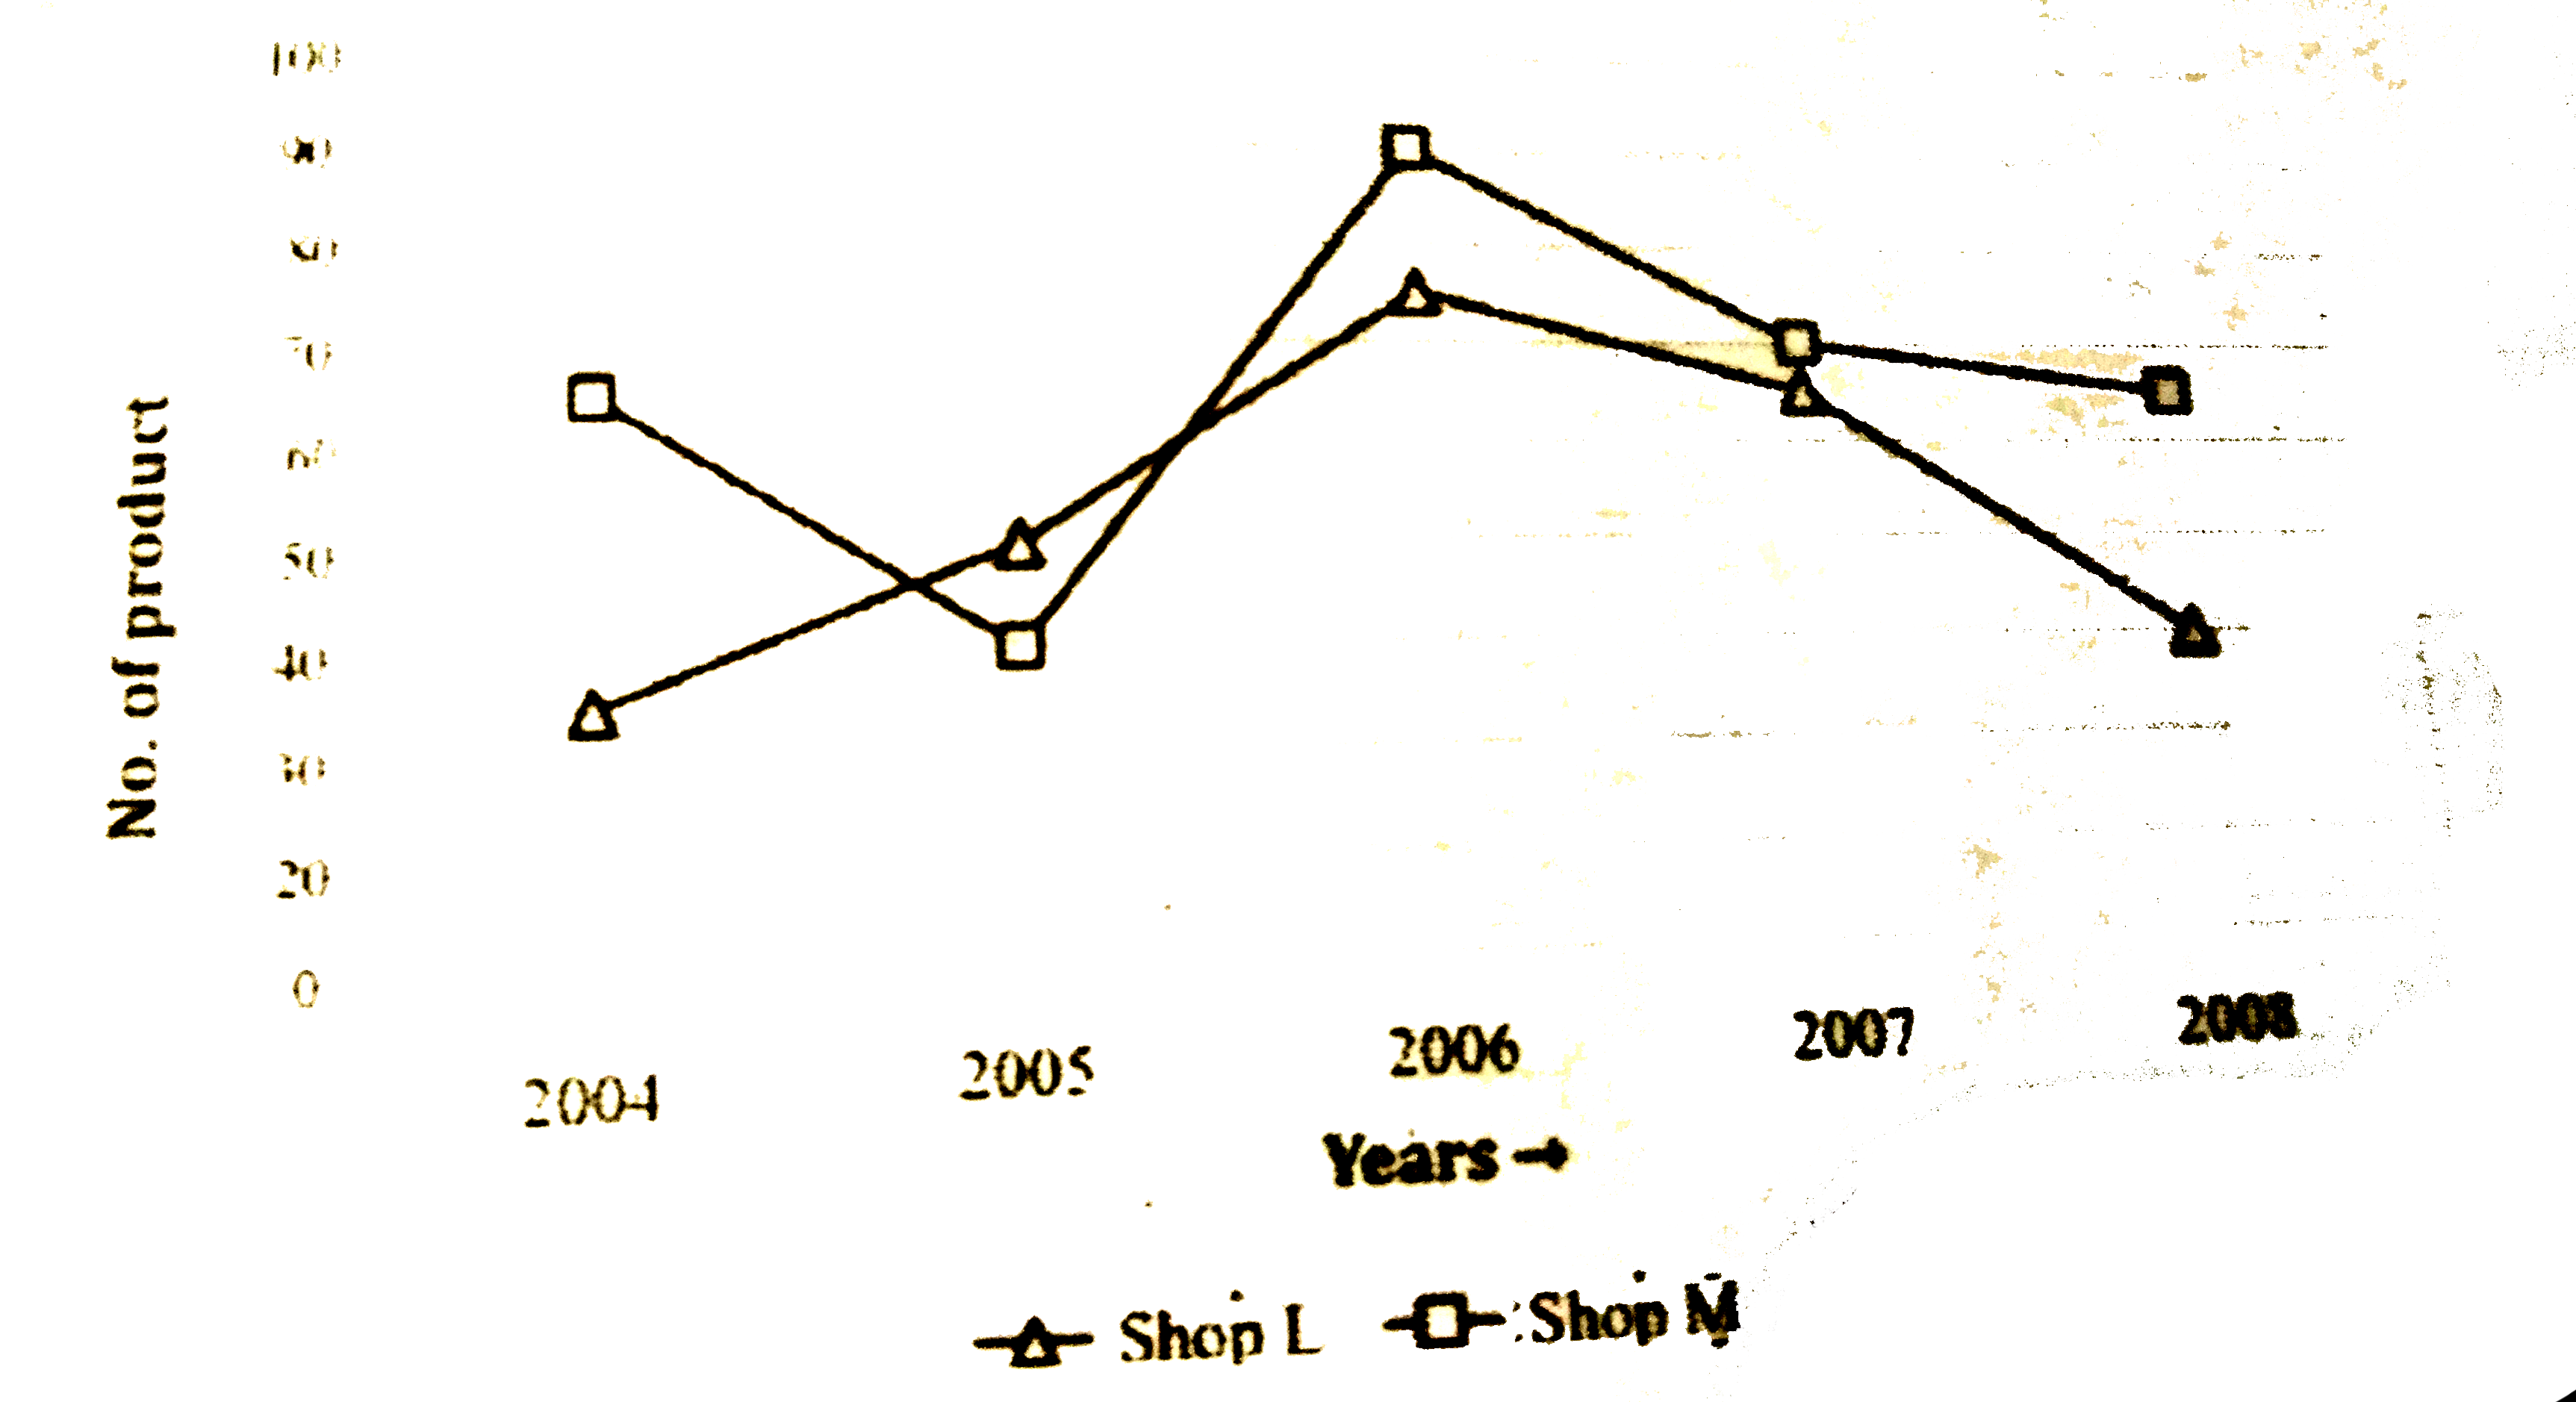
What is the ratio of total products in shop M in year 2006 & 2007 together to total products in shop M in year 2004 ?View SolutionLine-graph given below shows the total no. of products for (child+parent) in two different shop L & M in five different years.
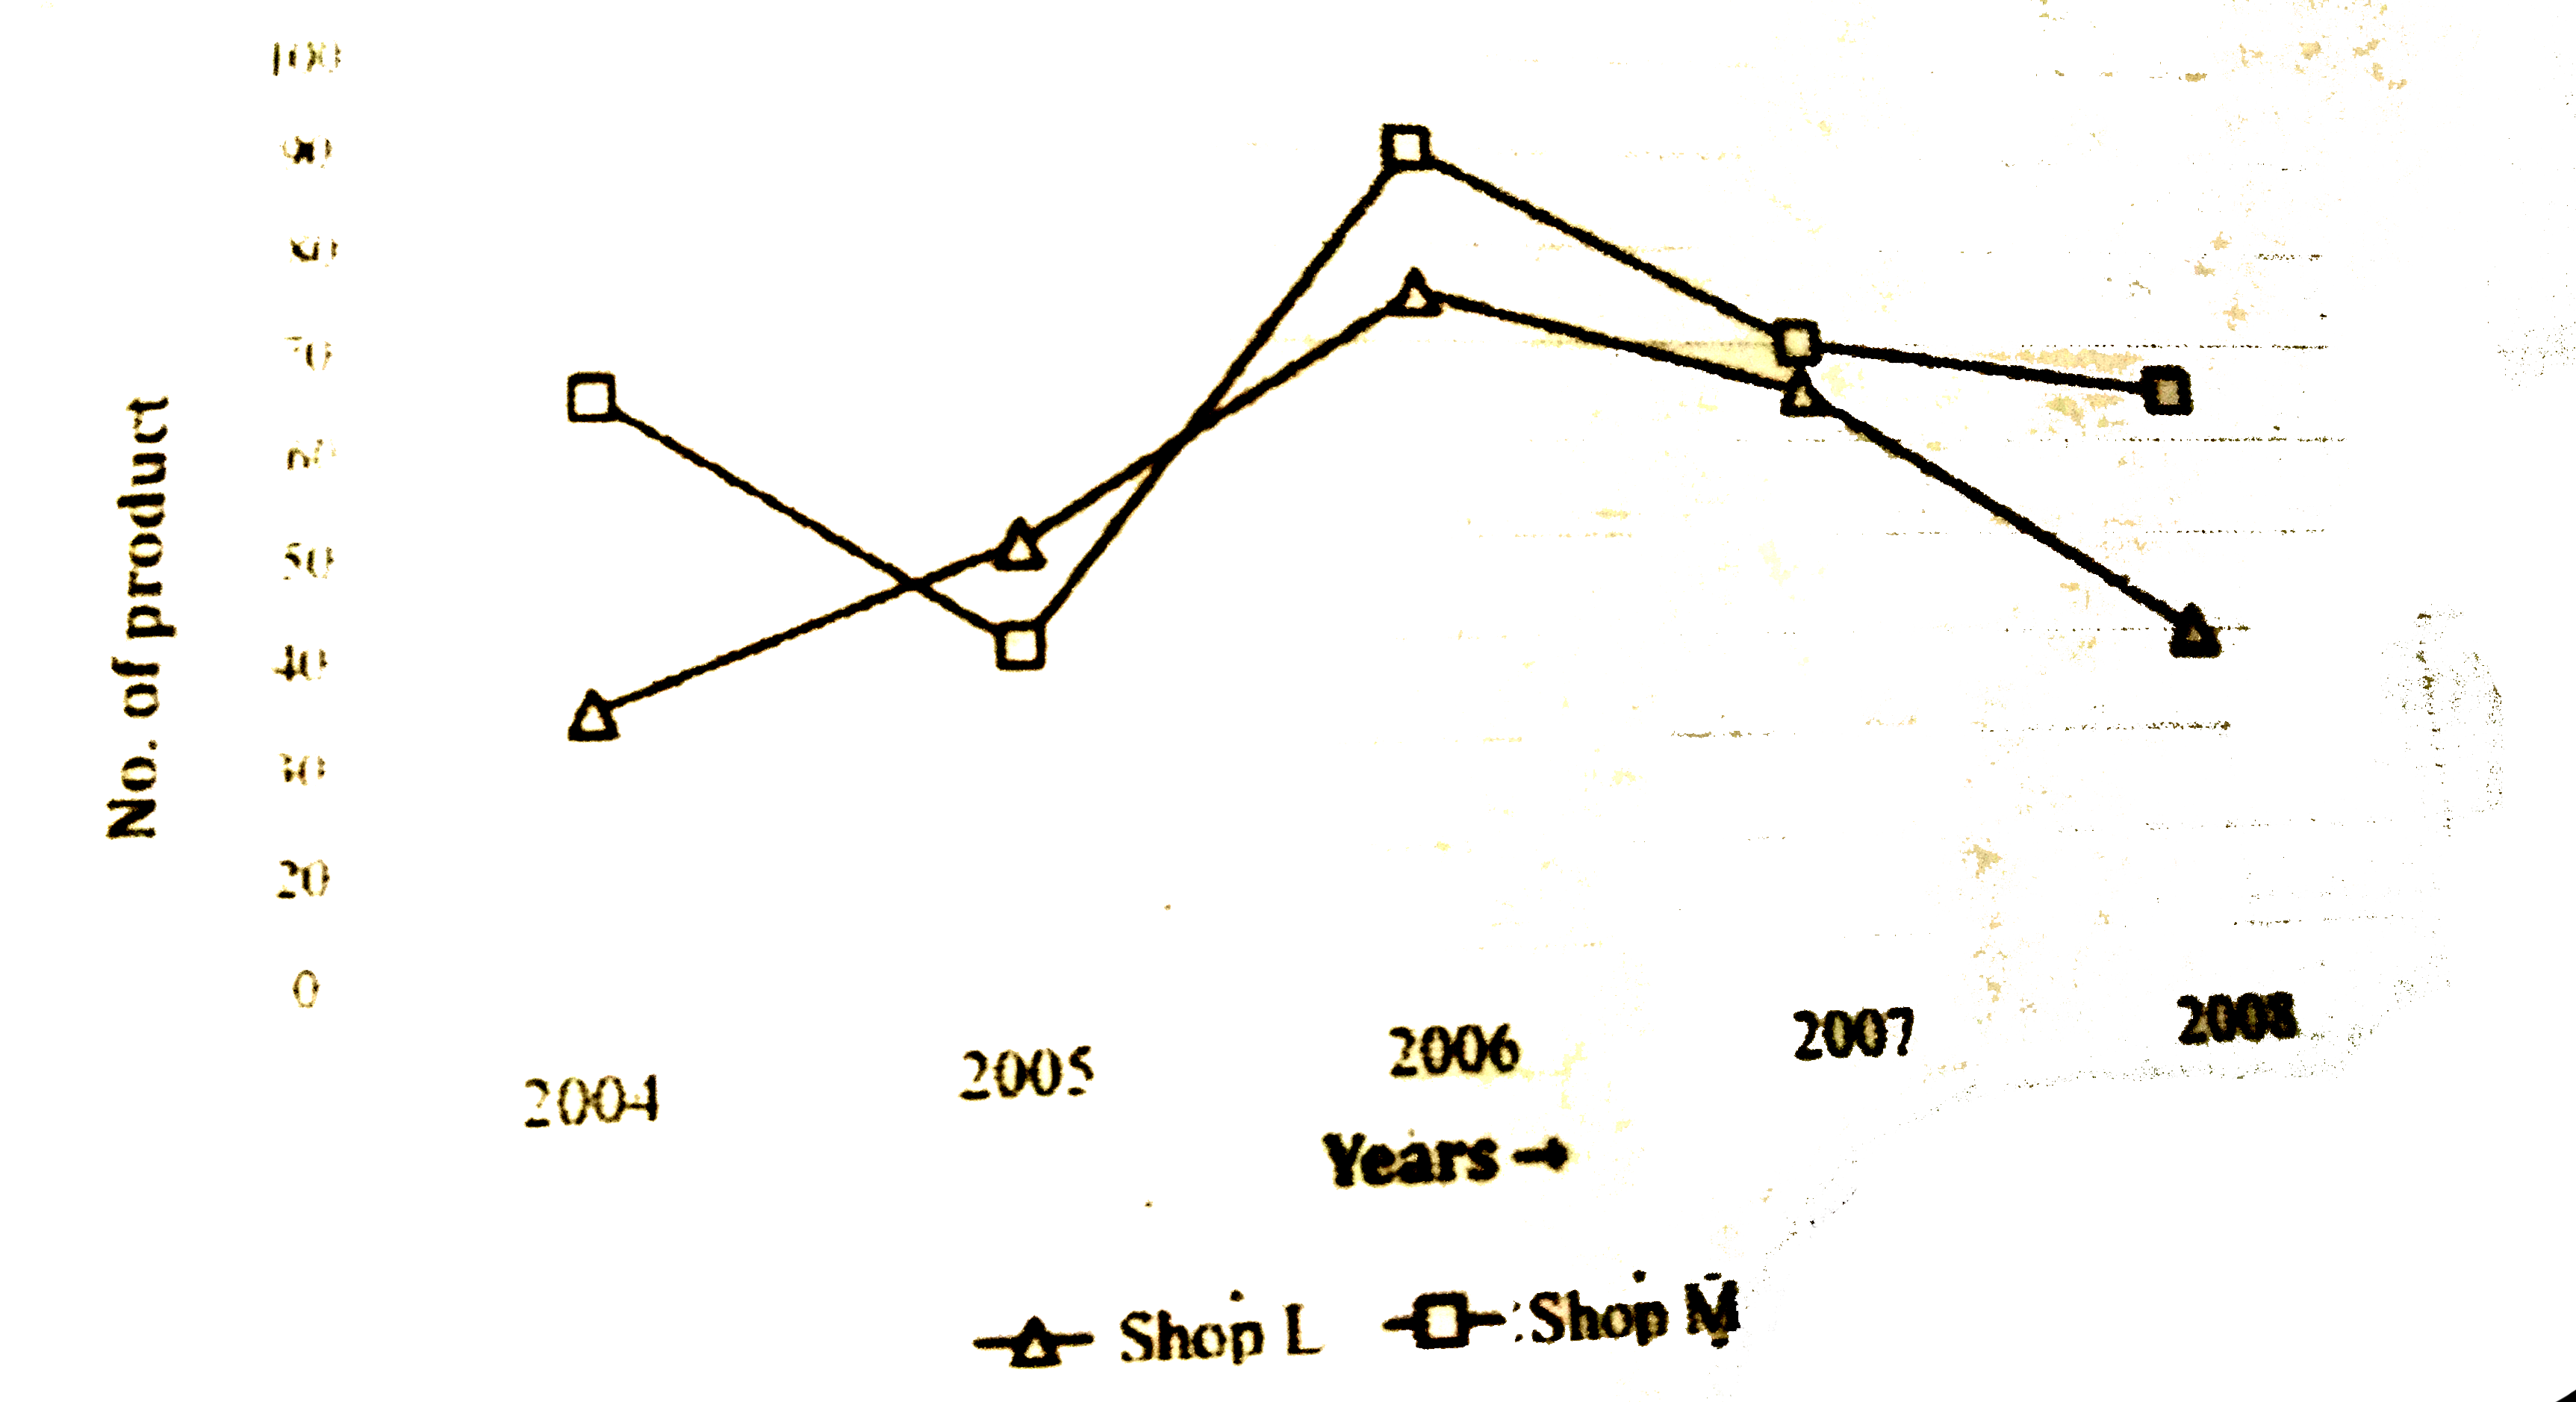
What is the average no. of products in all the years together in shop L ?View Solution
Knowledge Check
- Question 1 - Select One
The bar chart given below shows the number of students (in '00) in a schoool from year 2000 to year 2004.
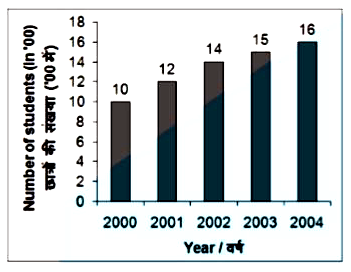
What is the difference between the total number of students in year 2004 and 2000?AA)1600BB)1000CC)800DD)600
Line-graph given below shows the total no. of products for (child+parent) in two different shop L & M in five different years.
Total no. of products in shop L in year 2007 and in shop M in year 2008 together is what percent more/less than total no. of prouducts in shop M in year 2004 ?View SolutionLine-graph given below shows the total no. of products for (child+parent) in two different shop L & M in five different years.
If total products in both th shops in year 2010 is increases by 20% as compared to year 2008. Then find the total no. of products in year 2010?View SolutionStudy the following graph carefully to answer the questions given below. Expenditure in lakhs) of three different Companies in Five Different Years
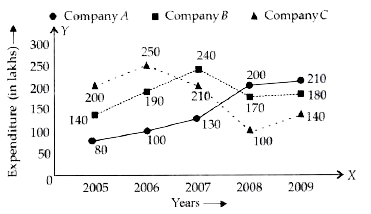
What was the difference between the total expenditure of Company B in the year 2006 and 2008 together and the total expenditure of Company C in the year 2007 and 2009 together?View Solution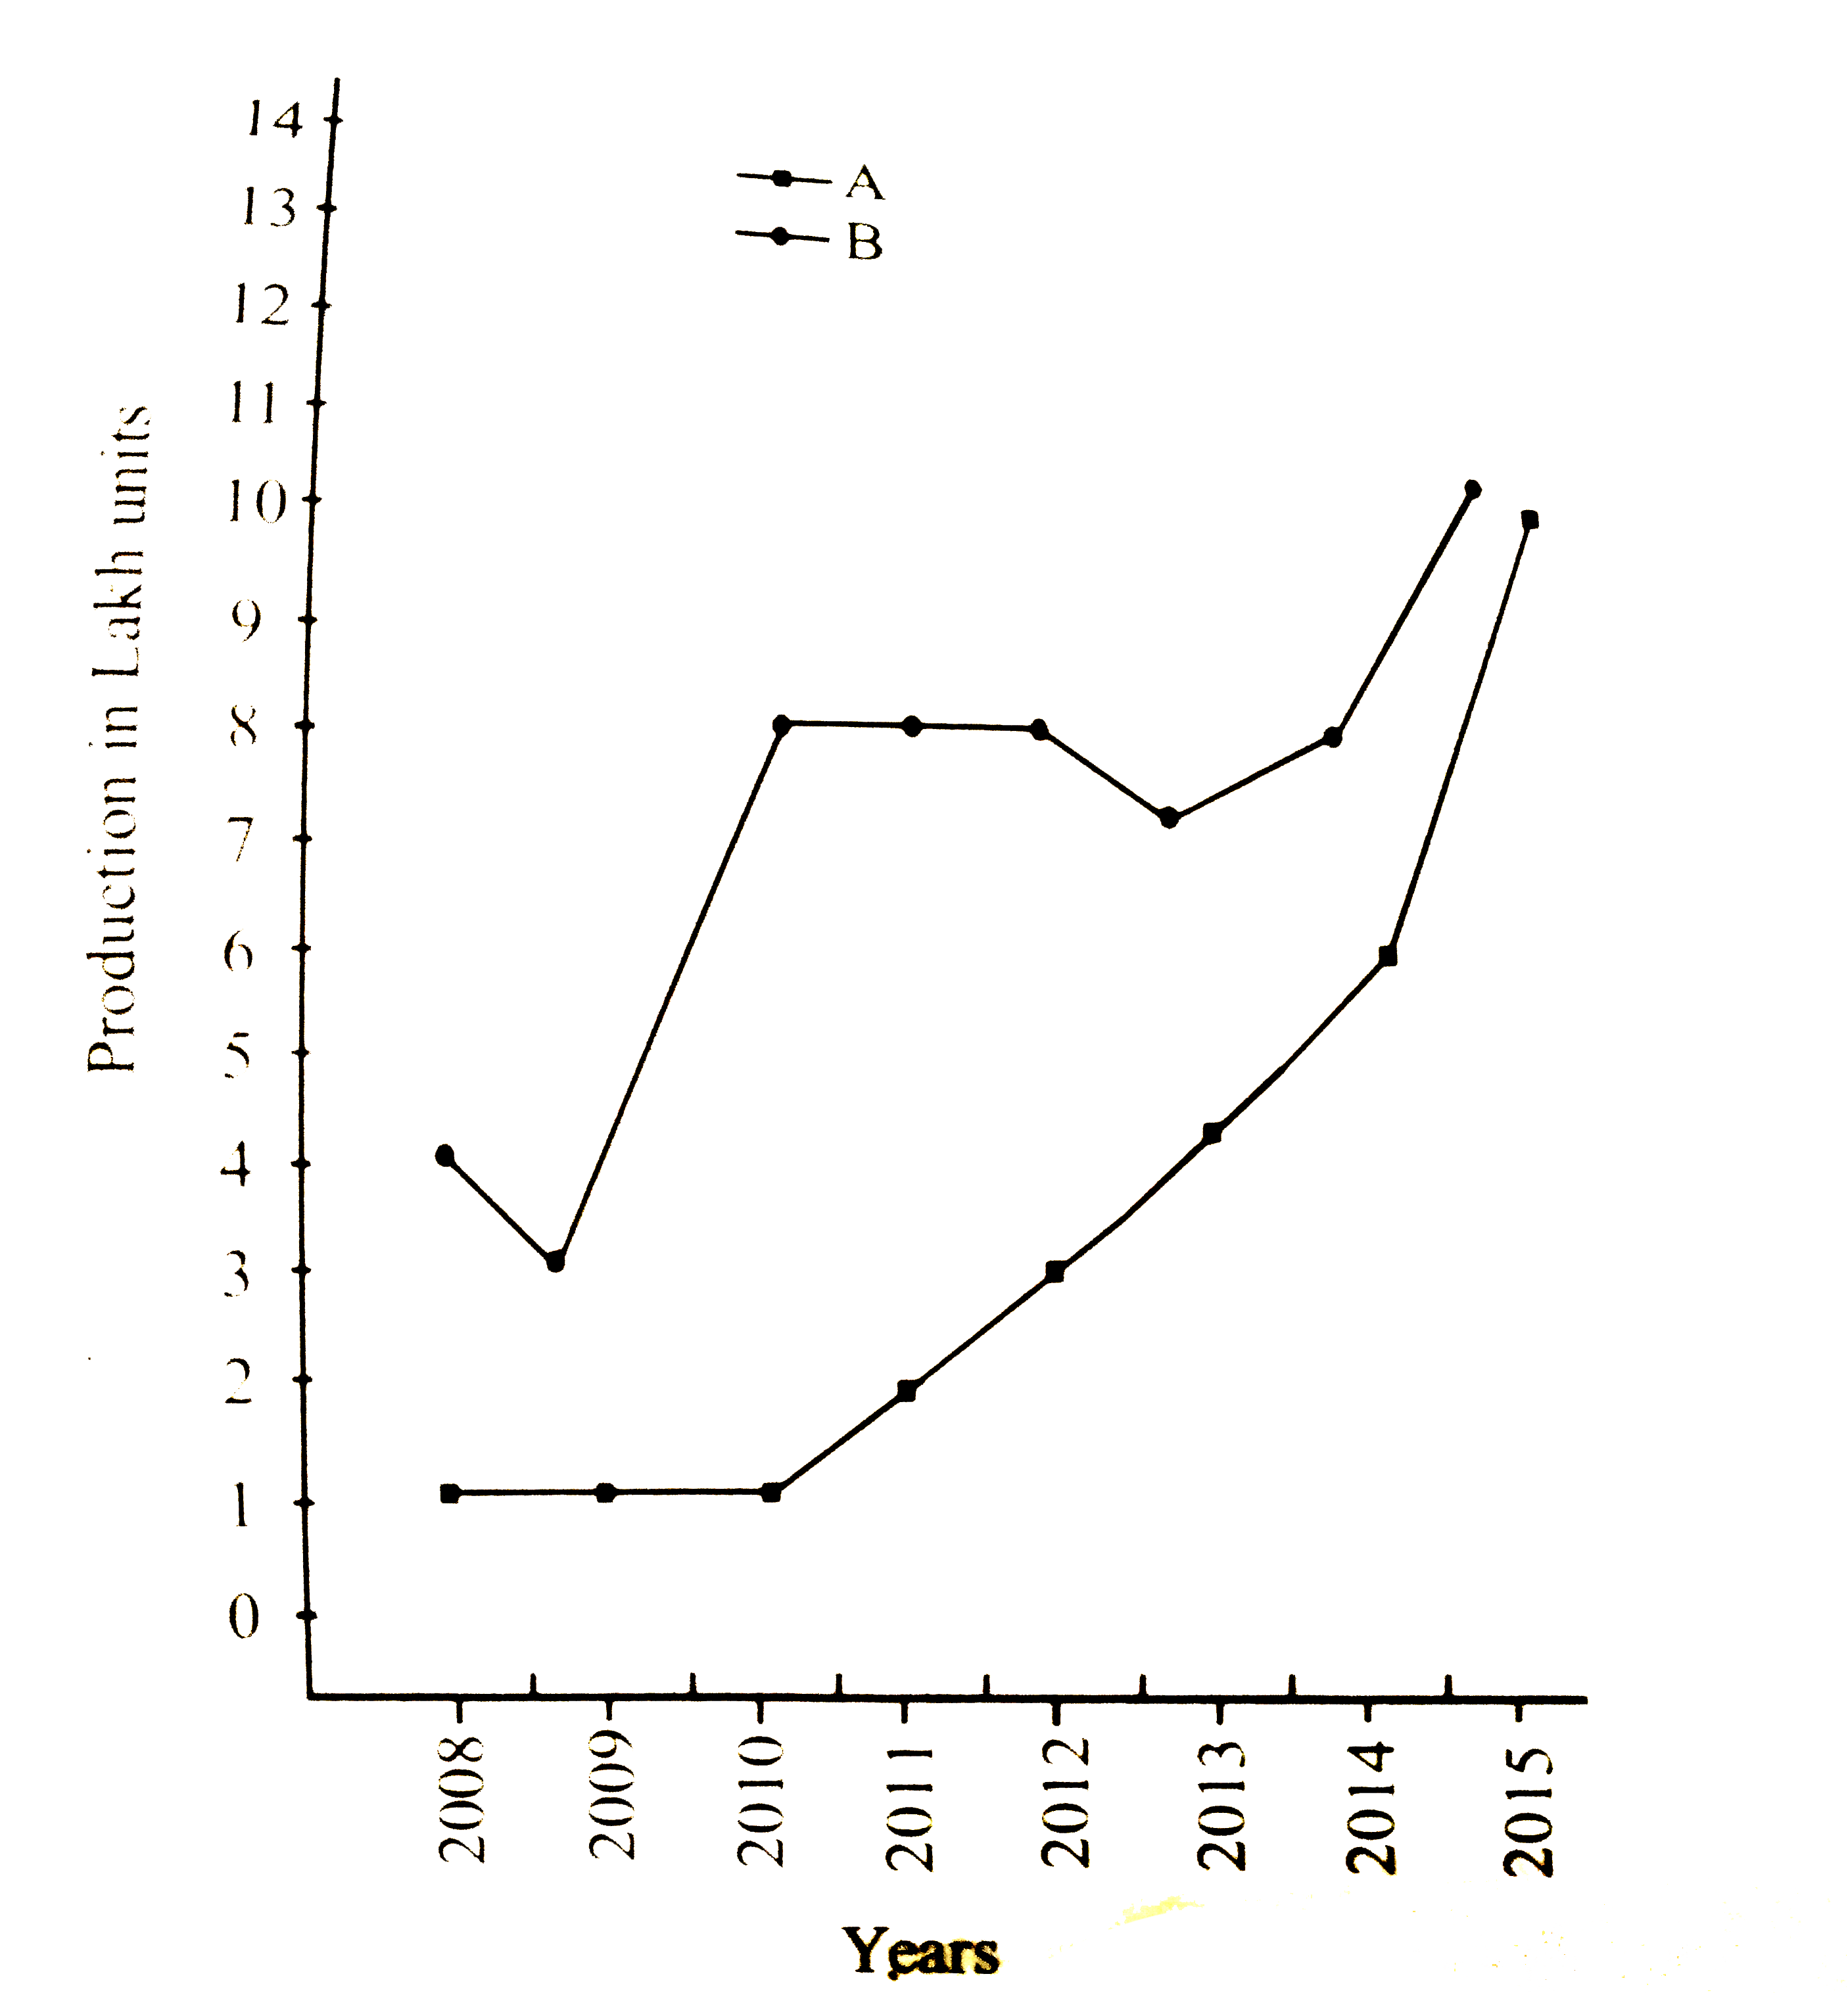
What is the difference in the total production of the two Companies for the given years ?View Solution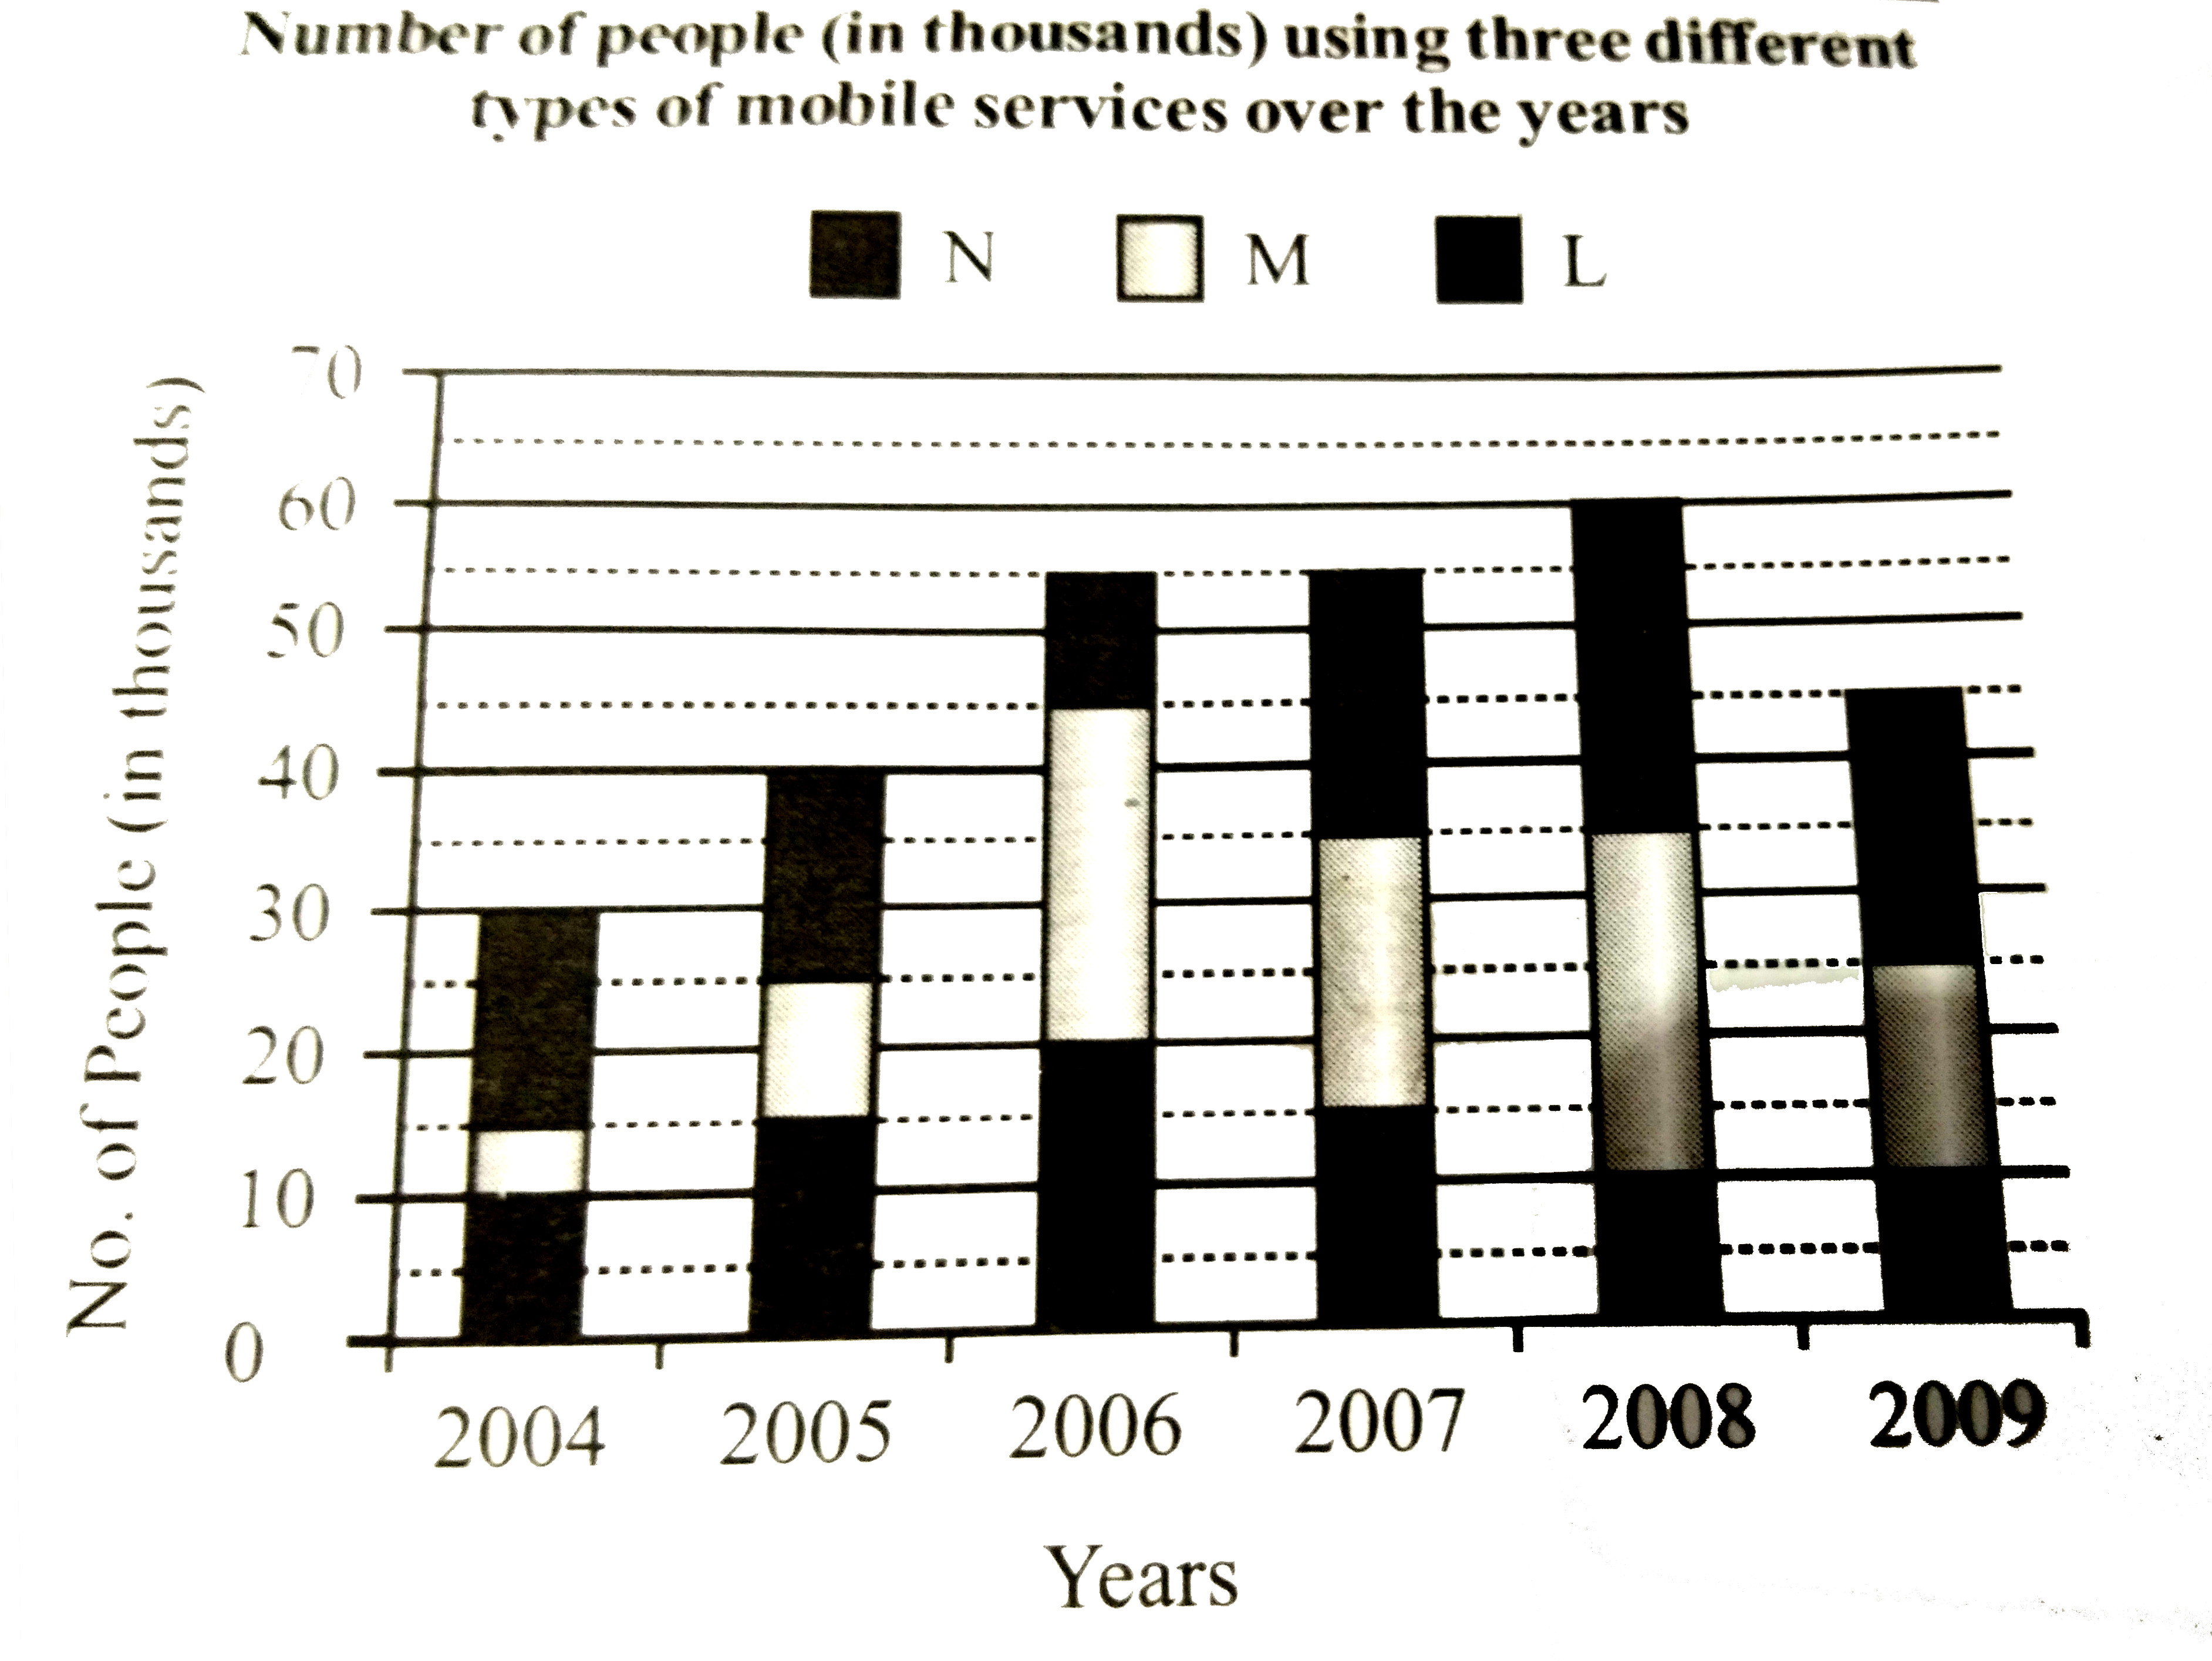
What is the total number of people using mobile services M is the year 2008 and 2009 together ?View Solution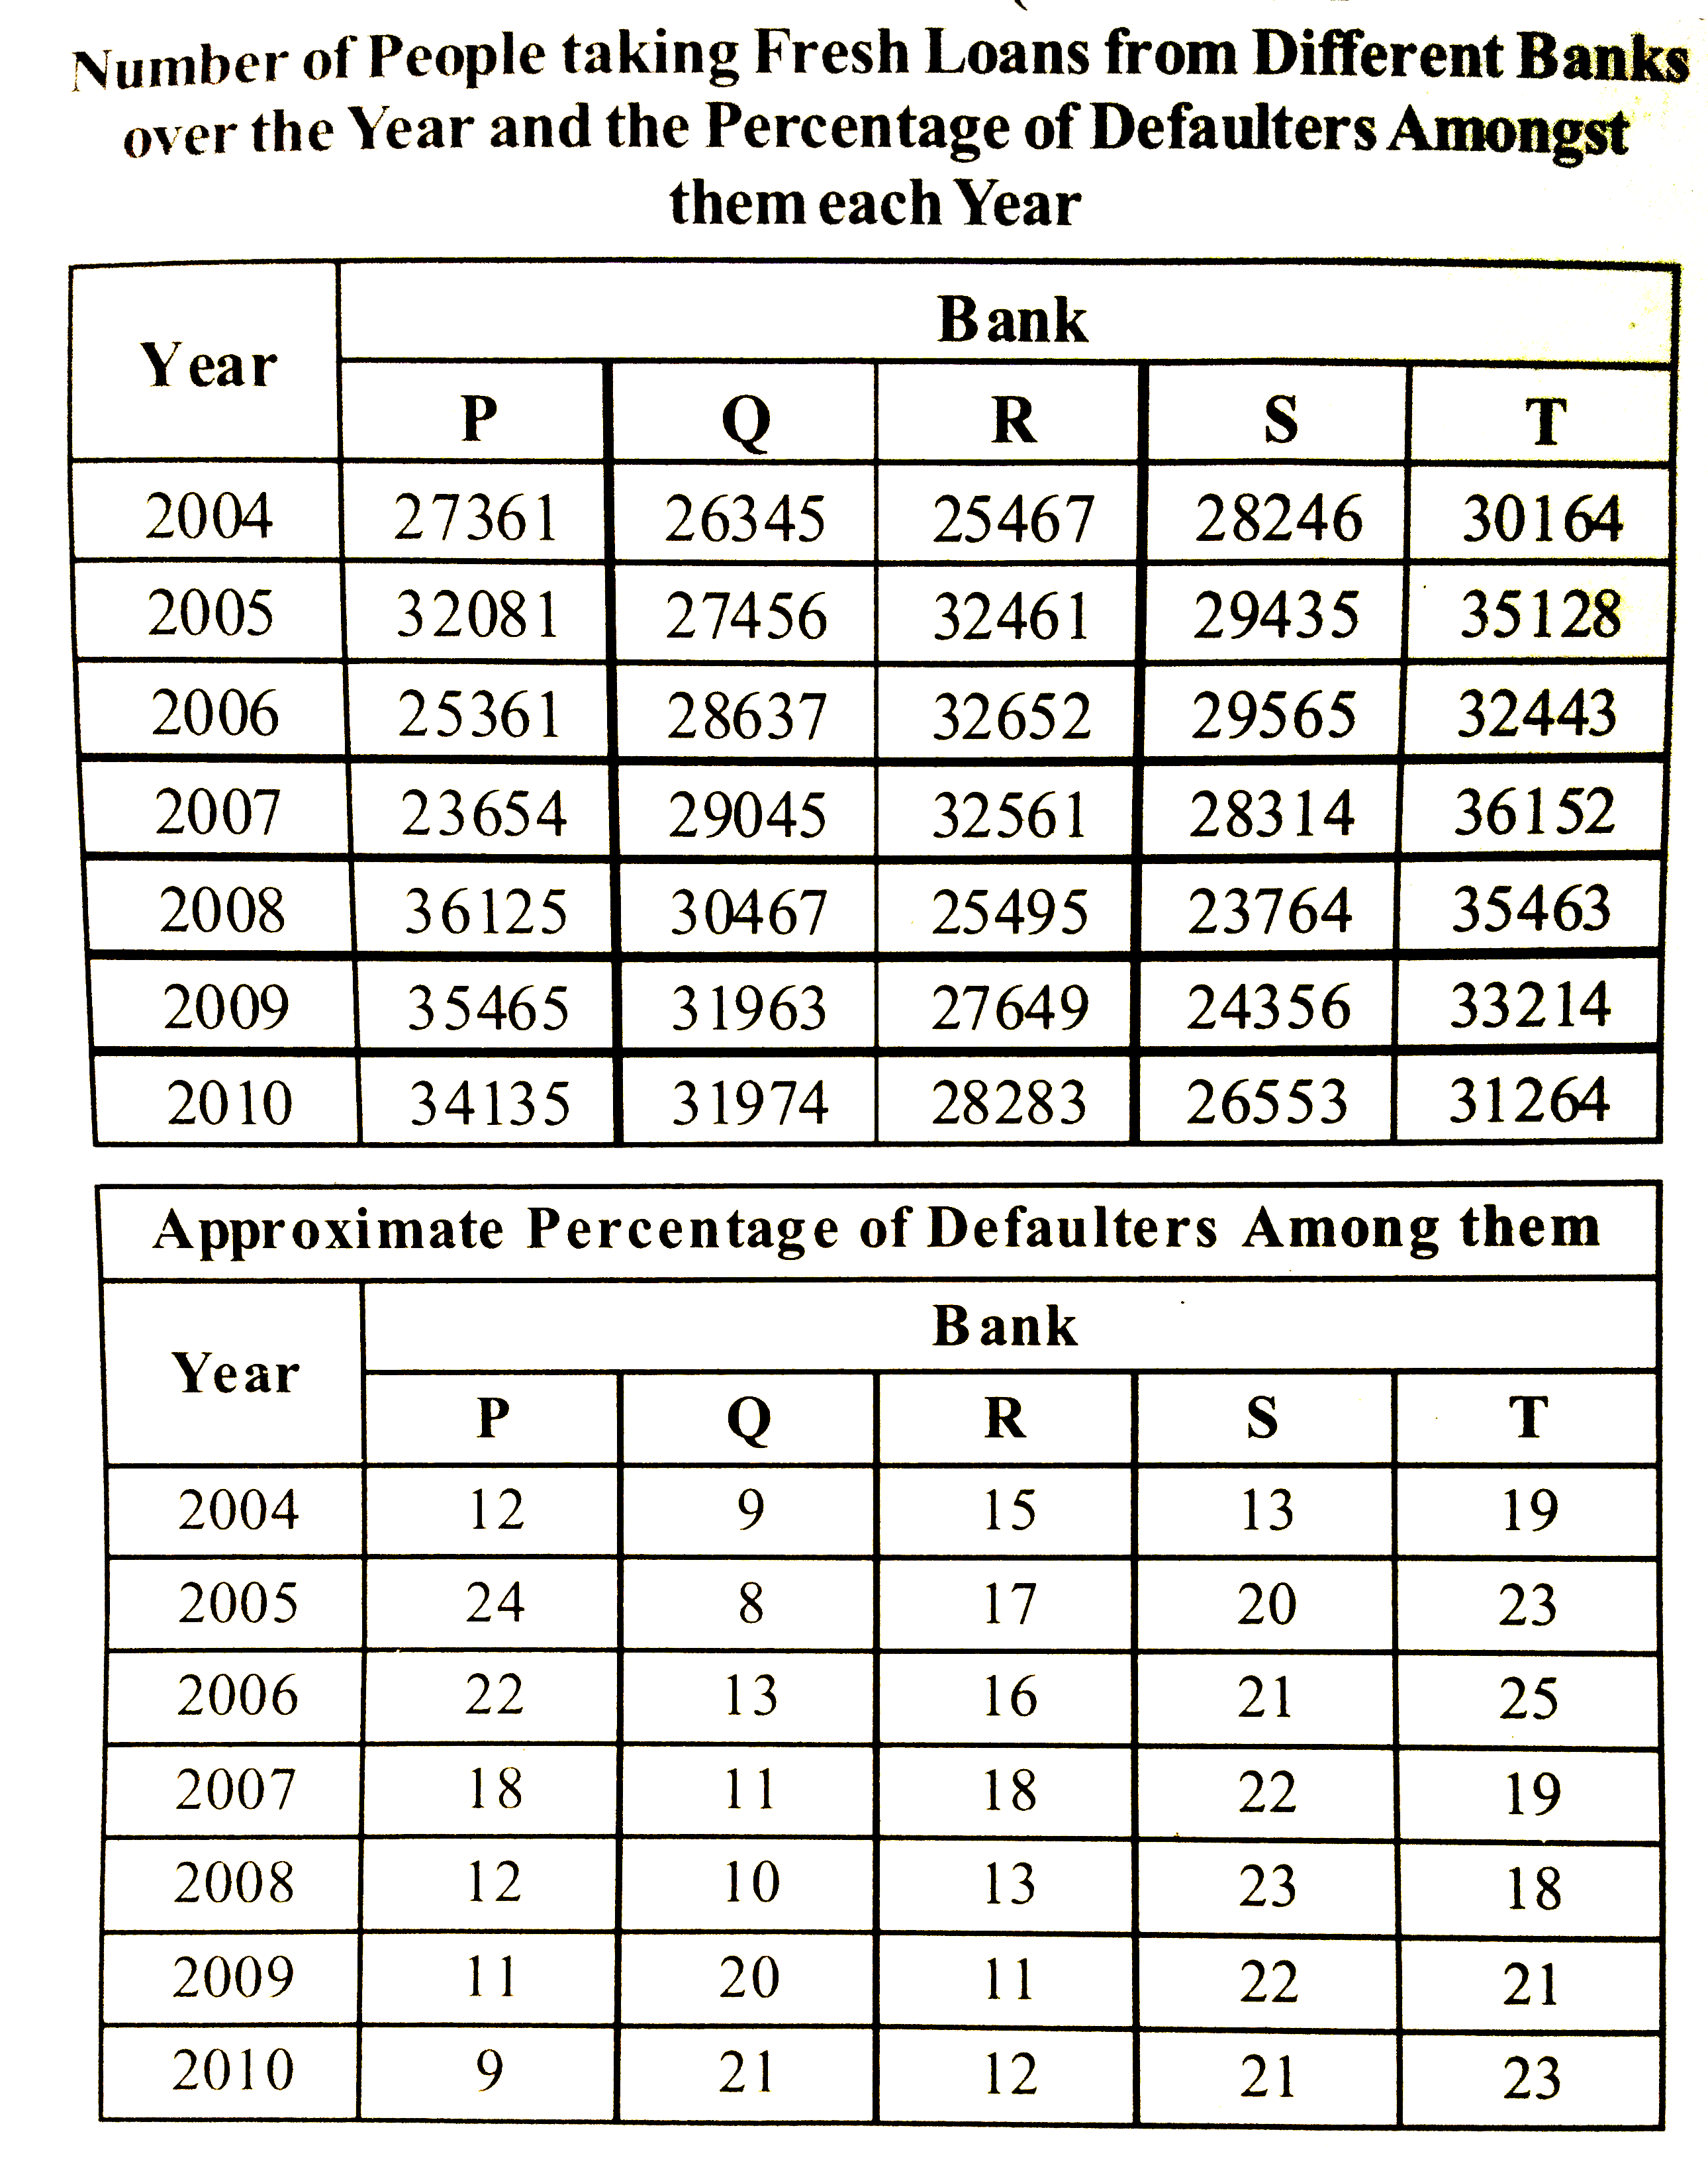
Approximately what was the total number of defaulters of Bank T in the years 2007 and 2008 together ?View SolutionStudy the following graph which shows the production (in thousands)of different items, and answer these questions
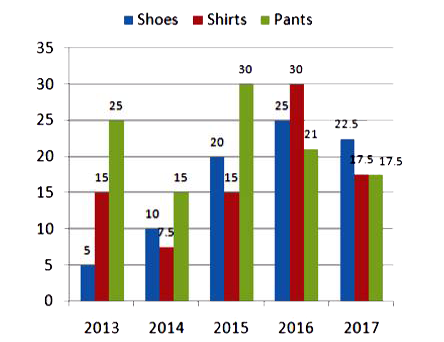
The difference between the total number of Shoes and Shirts produced by the company in the year 2016 and the number of Pants produced by the company in the year 2014 is:View Solution

