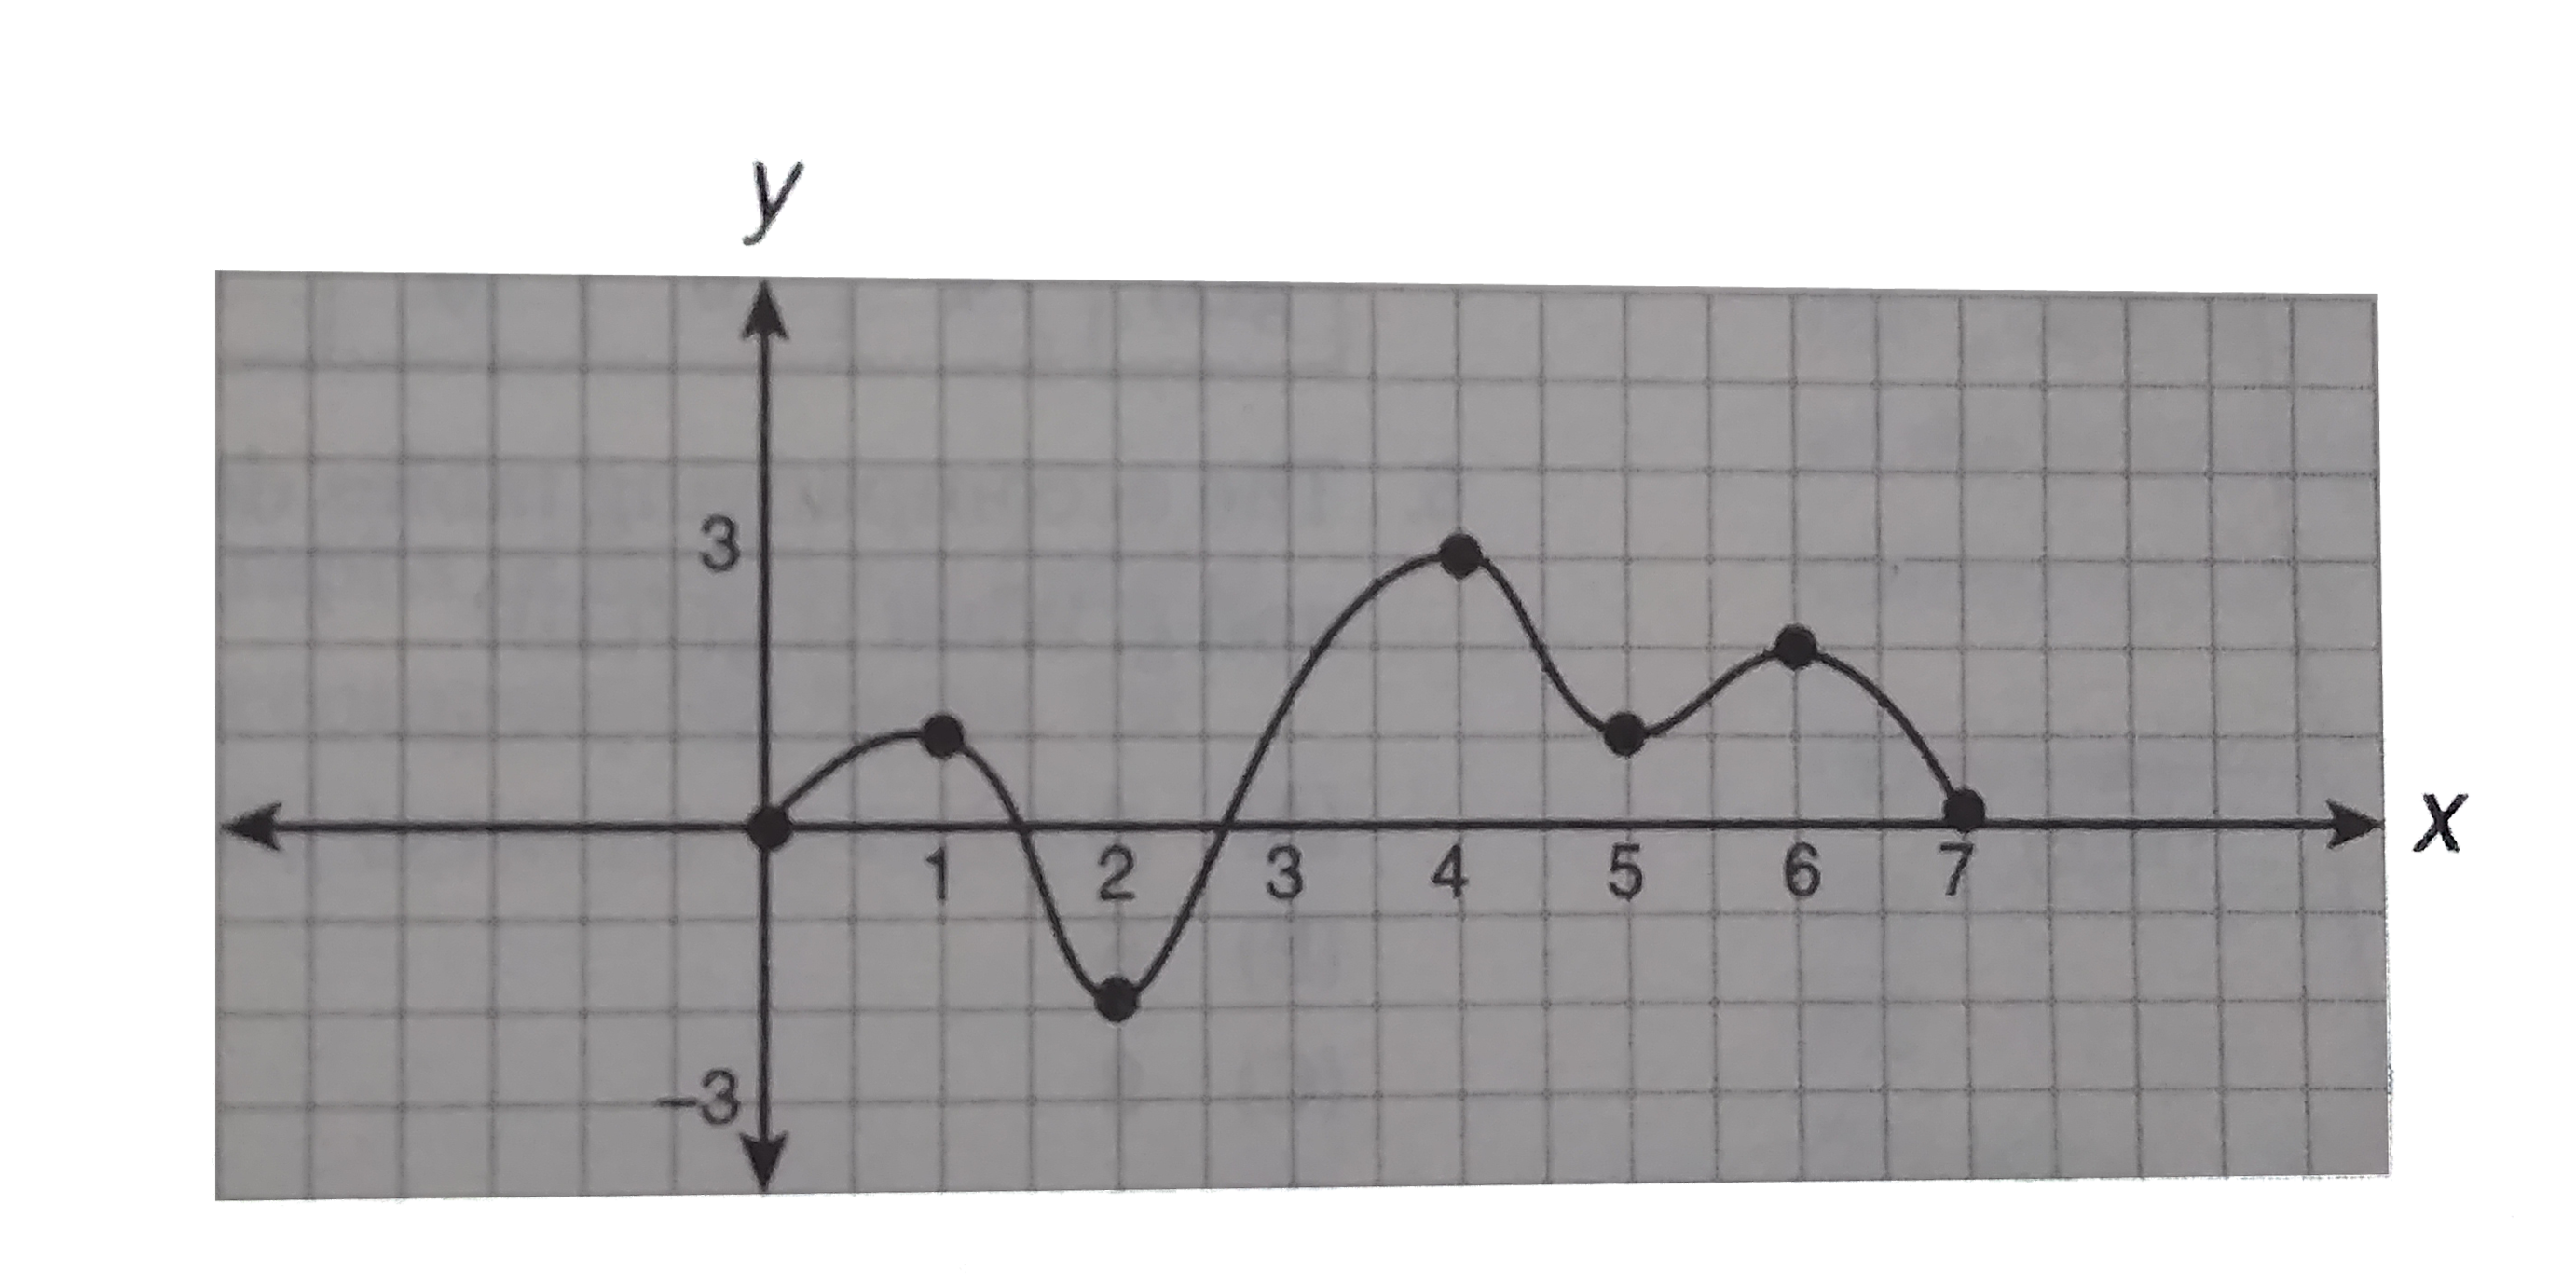
The graph above shows the function y=f(x) over the interval 0≤x≤7. What is the value of f(f(6))?
A
−2
B
0
C
1
D
2
Video Solution
Text Solution
The correct Answer is:A
|
Answer
Step by step video & image solution for The graph above shows the function y=f(x) over the interval 0lexle7. What is the value of f(f(6))? by Maths experts to help you in doubts & scoring excellent marks in Class 10 exams.
Updated on:21/07/2023Topper's Solved these Questions
Similar Questions
Knowledge Check
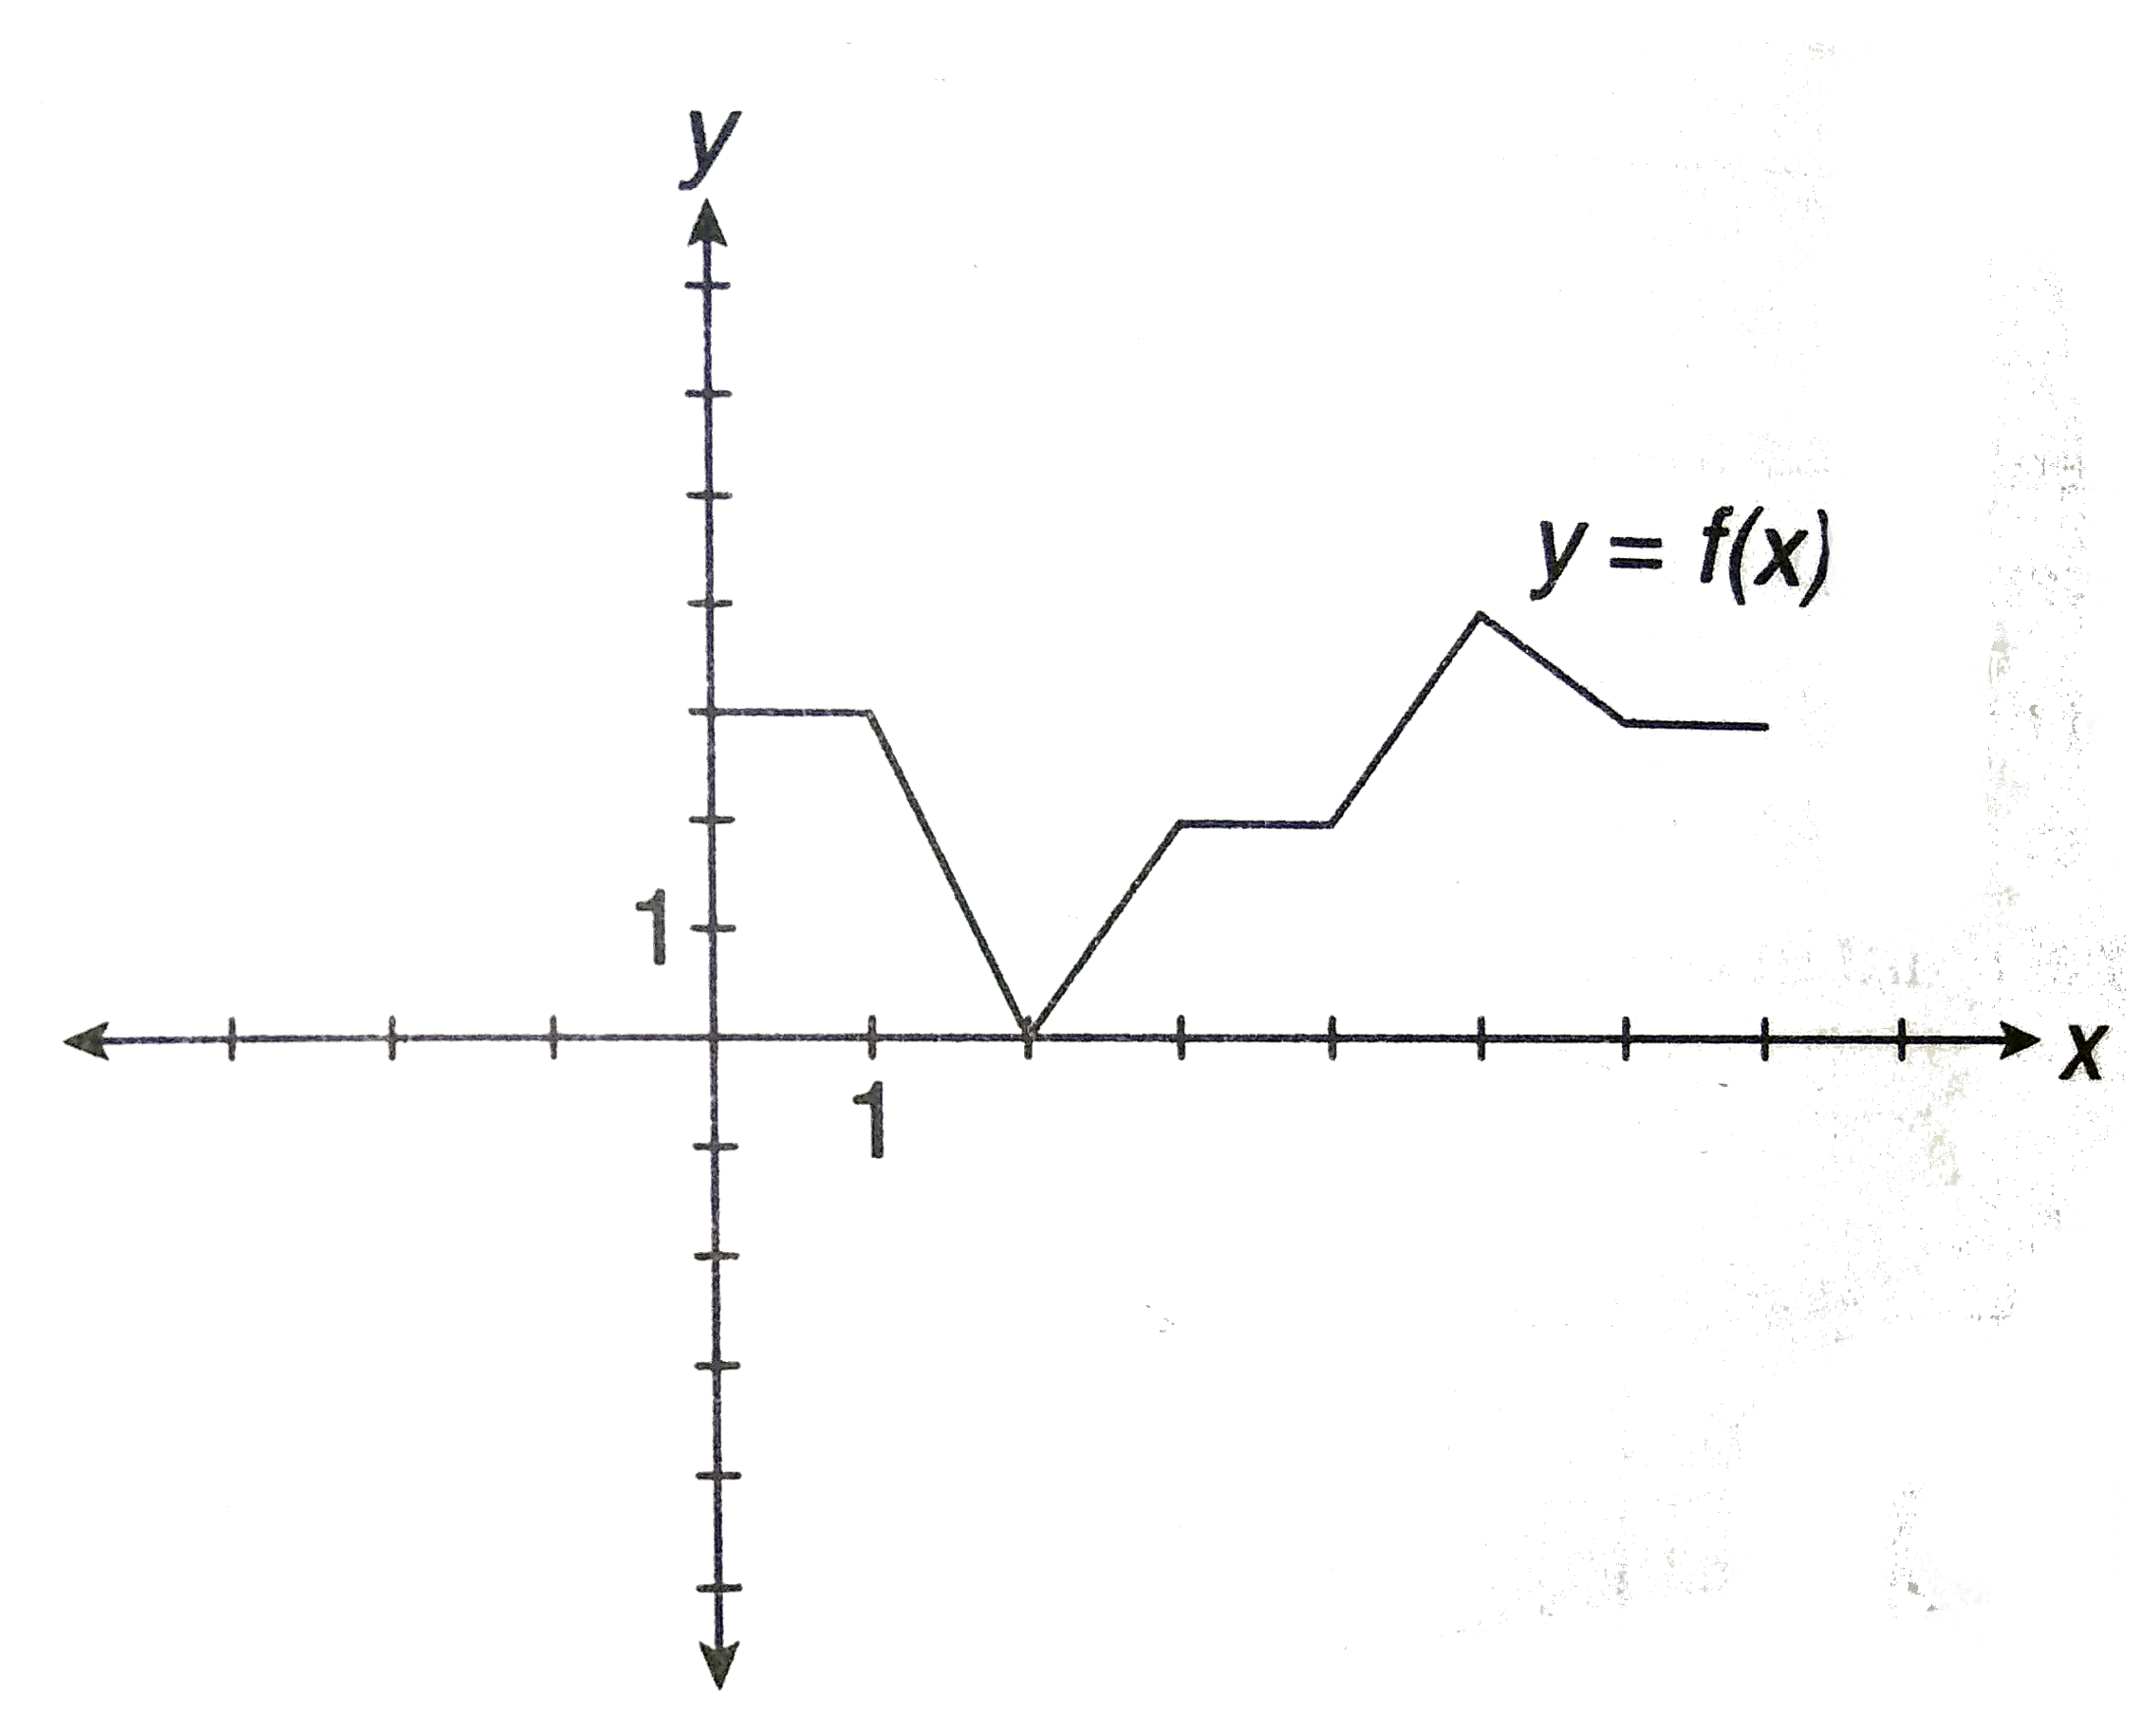
The figure above shows part of the graph of function f. If f(x+6)=f(x) for all values of x, what is the value of f(23)?A0B2C3D4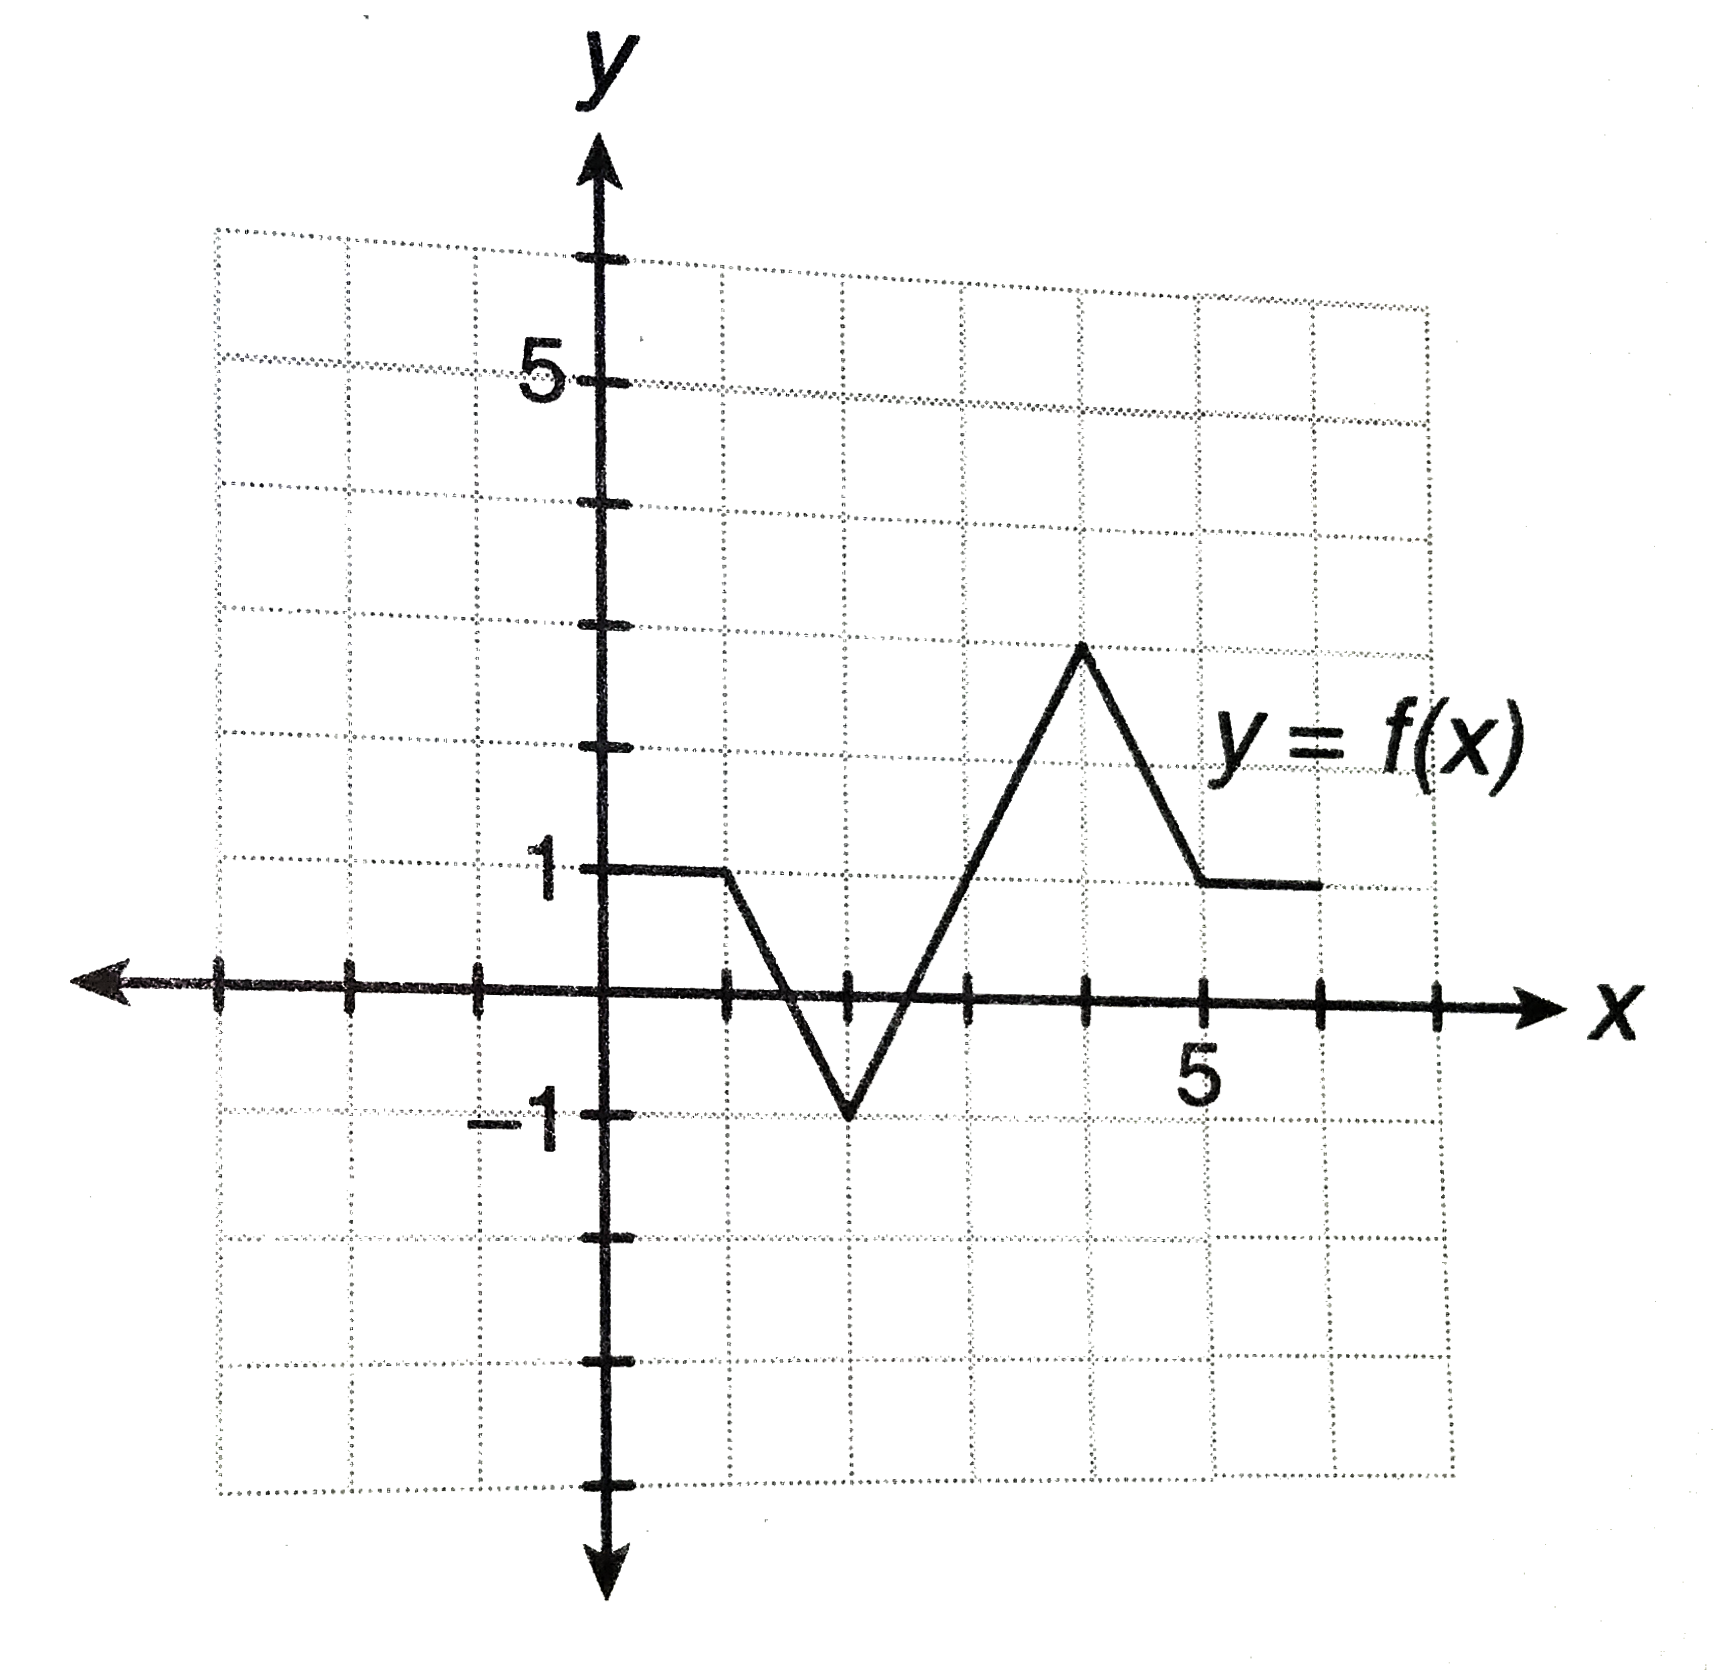
The figure above shows part of the graph of function f. If f(x−5)=f(x) for all values of x, what is the value of f(19)?A−1B0C1D3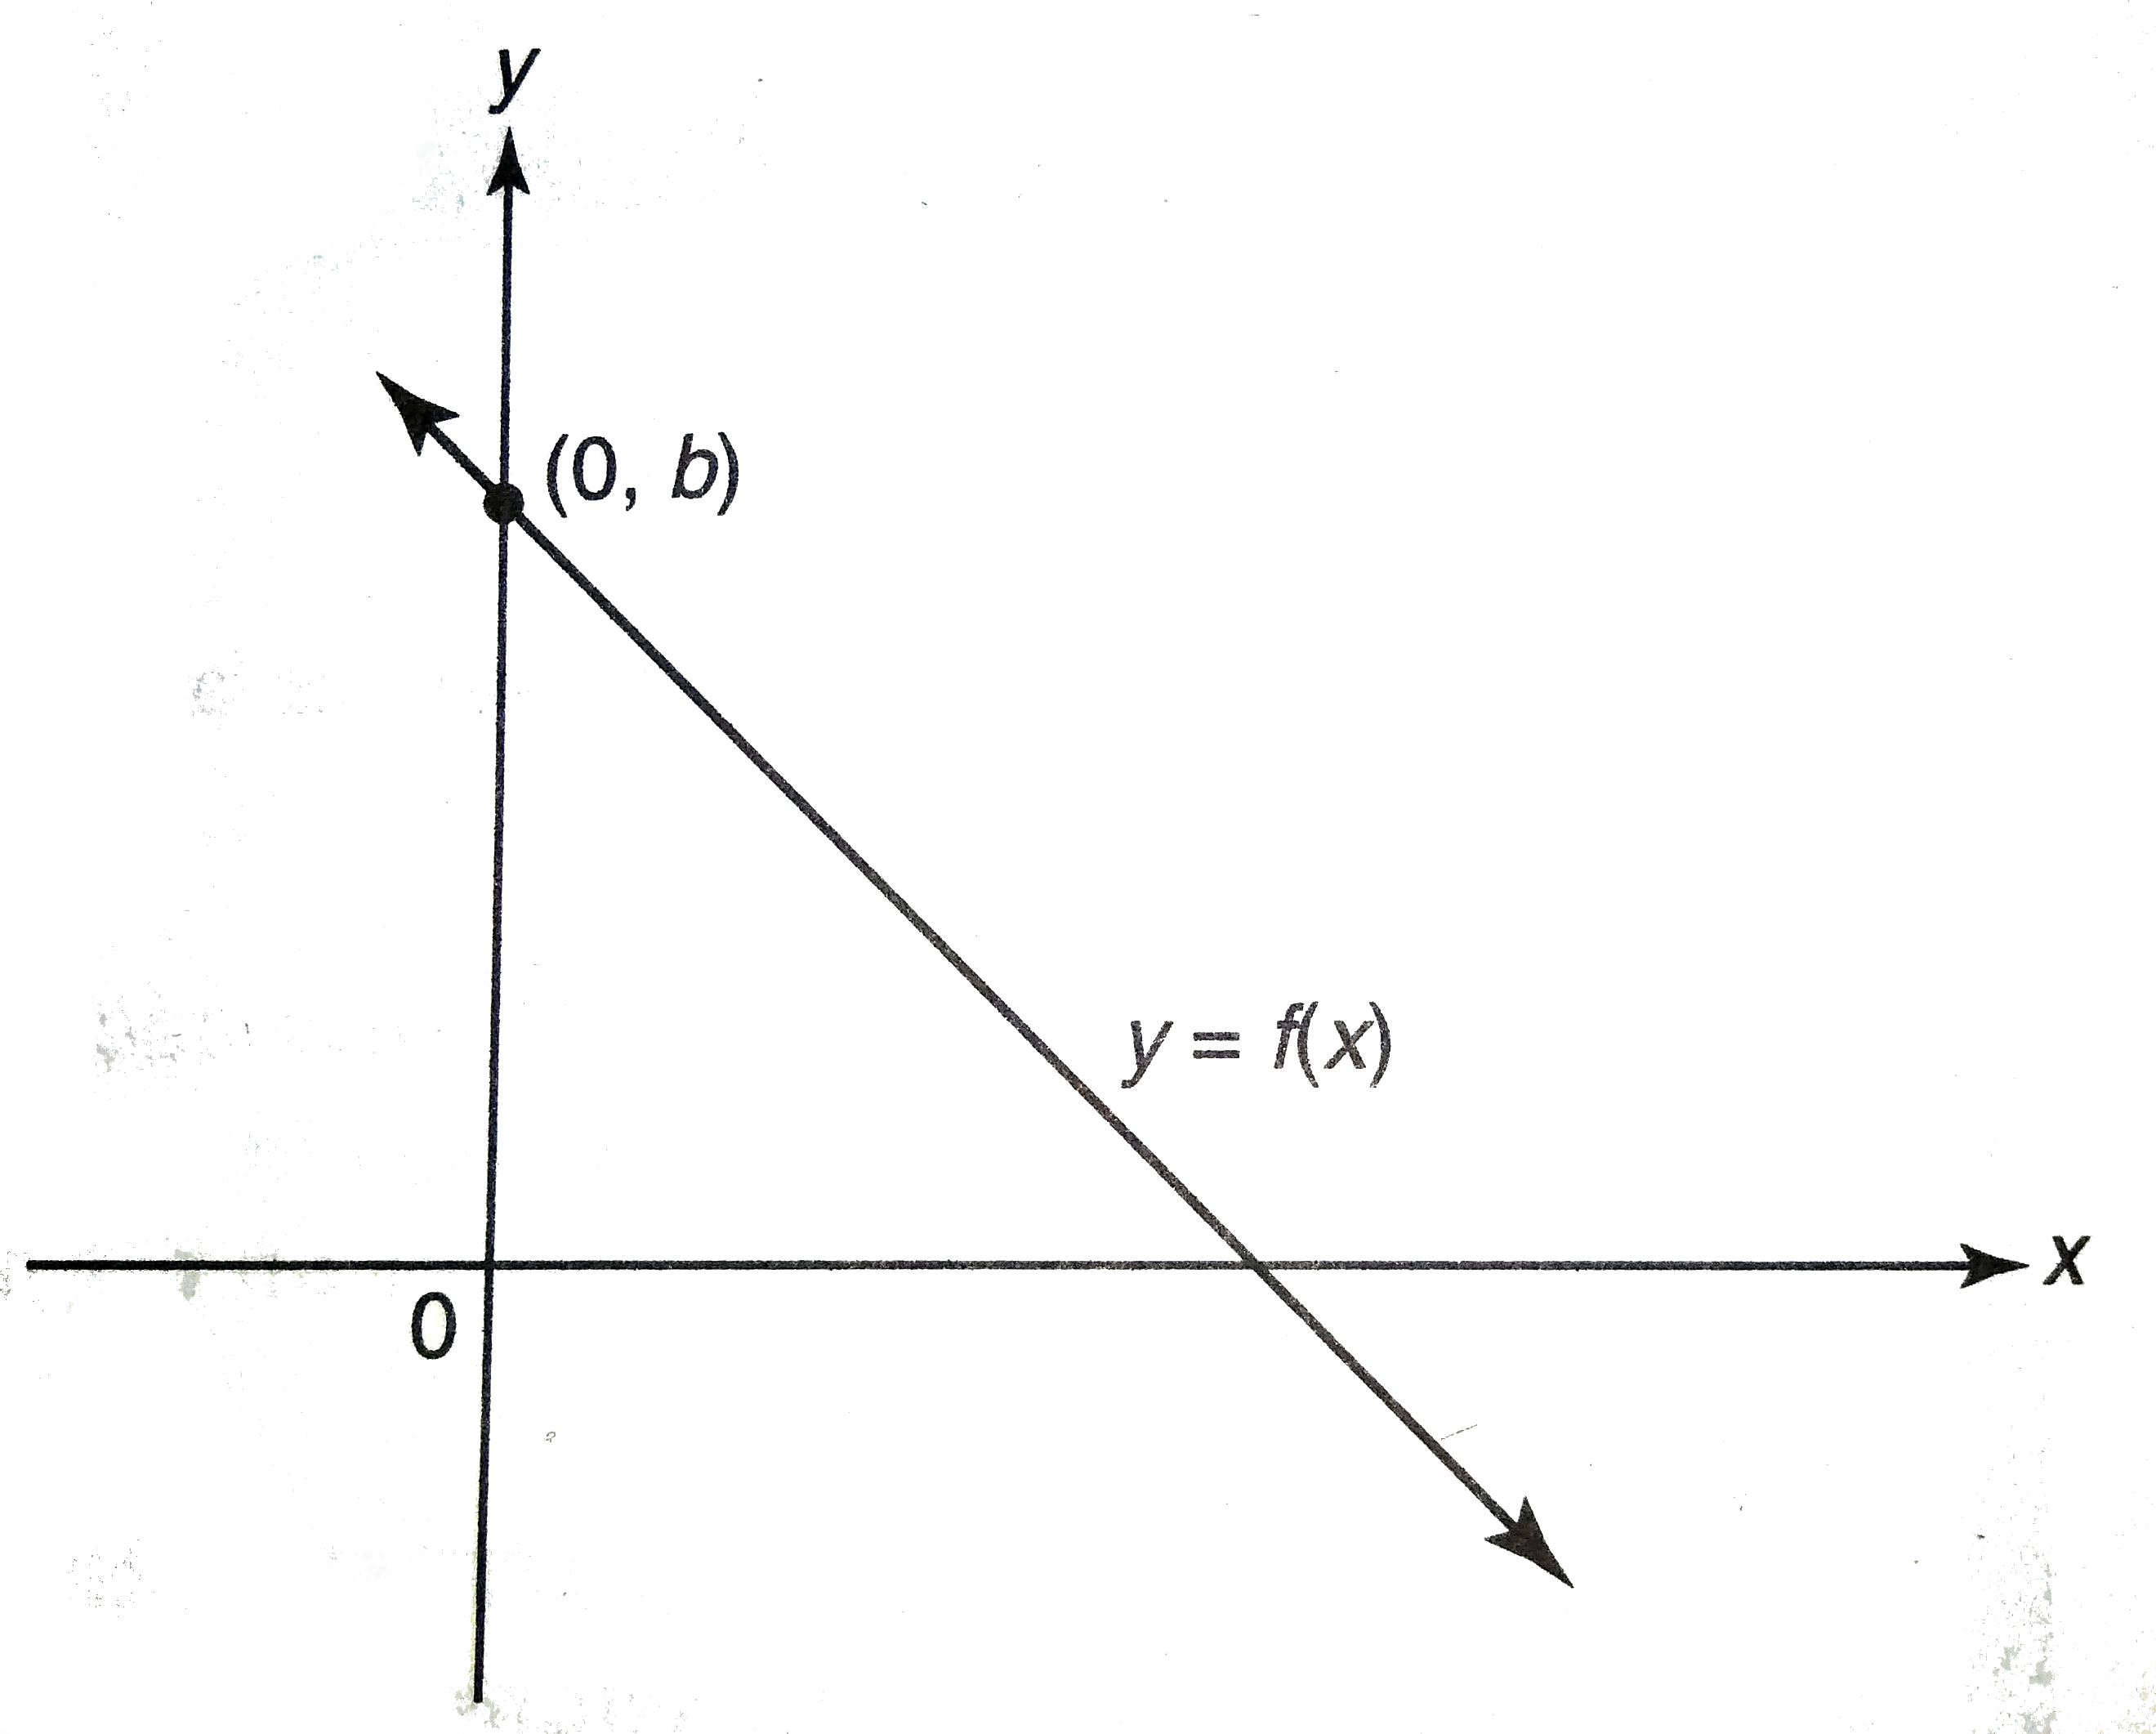
The figure above shows the graph of the linear function, y=f(x). If slope of the line is -2 and f(3)=4, what is the value of b?A8B9C10D11
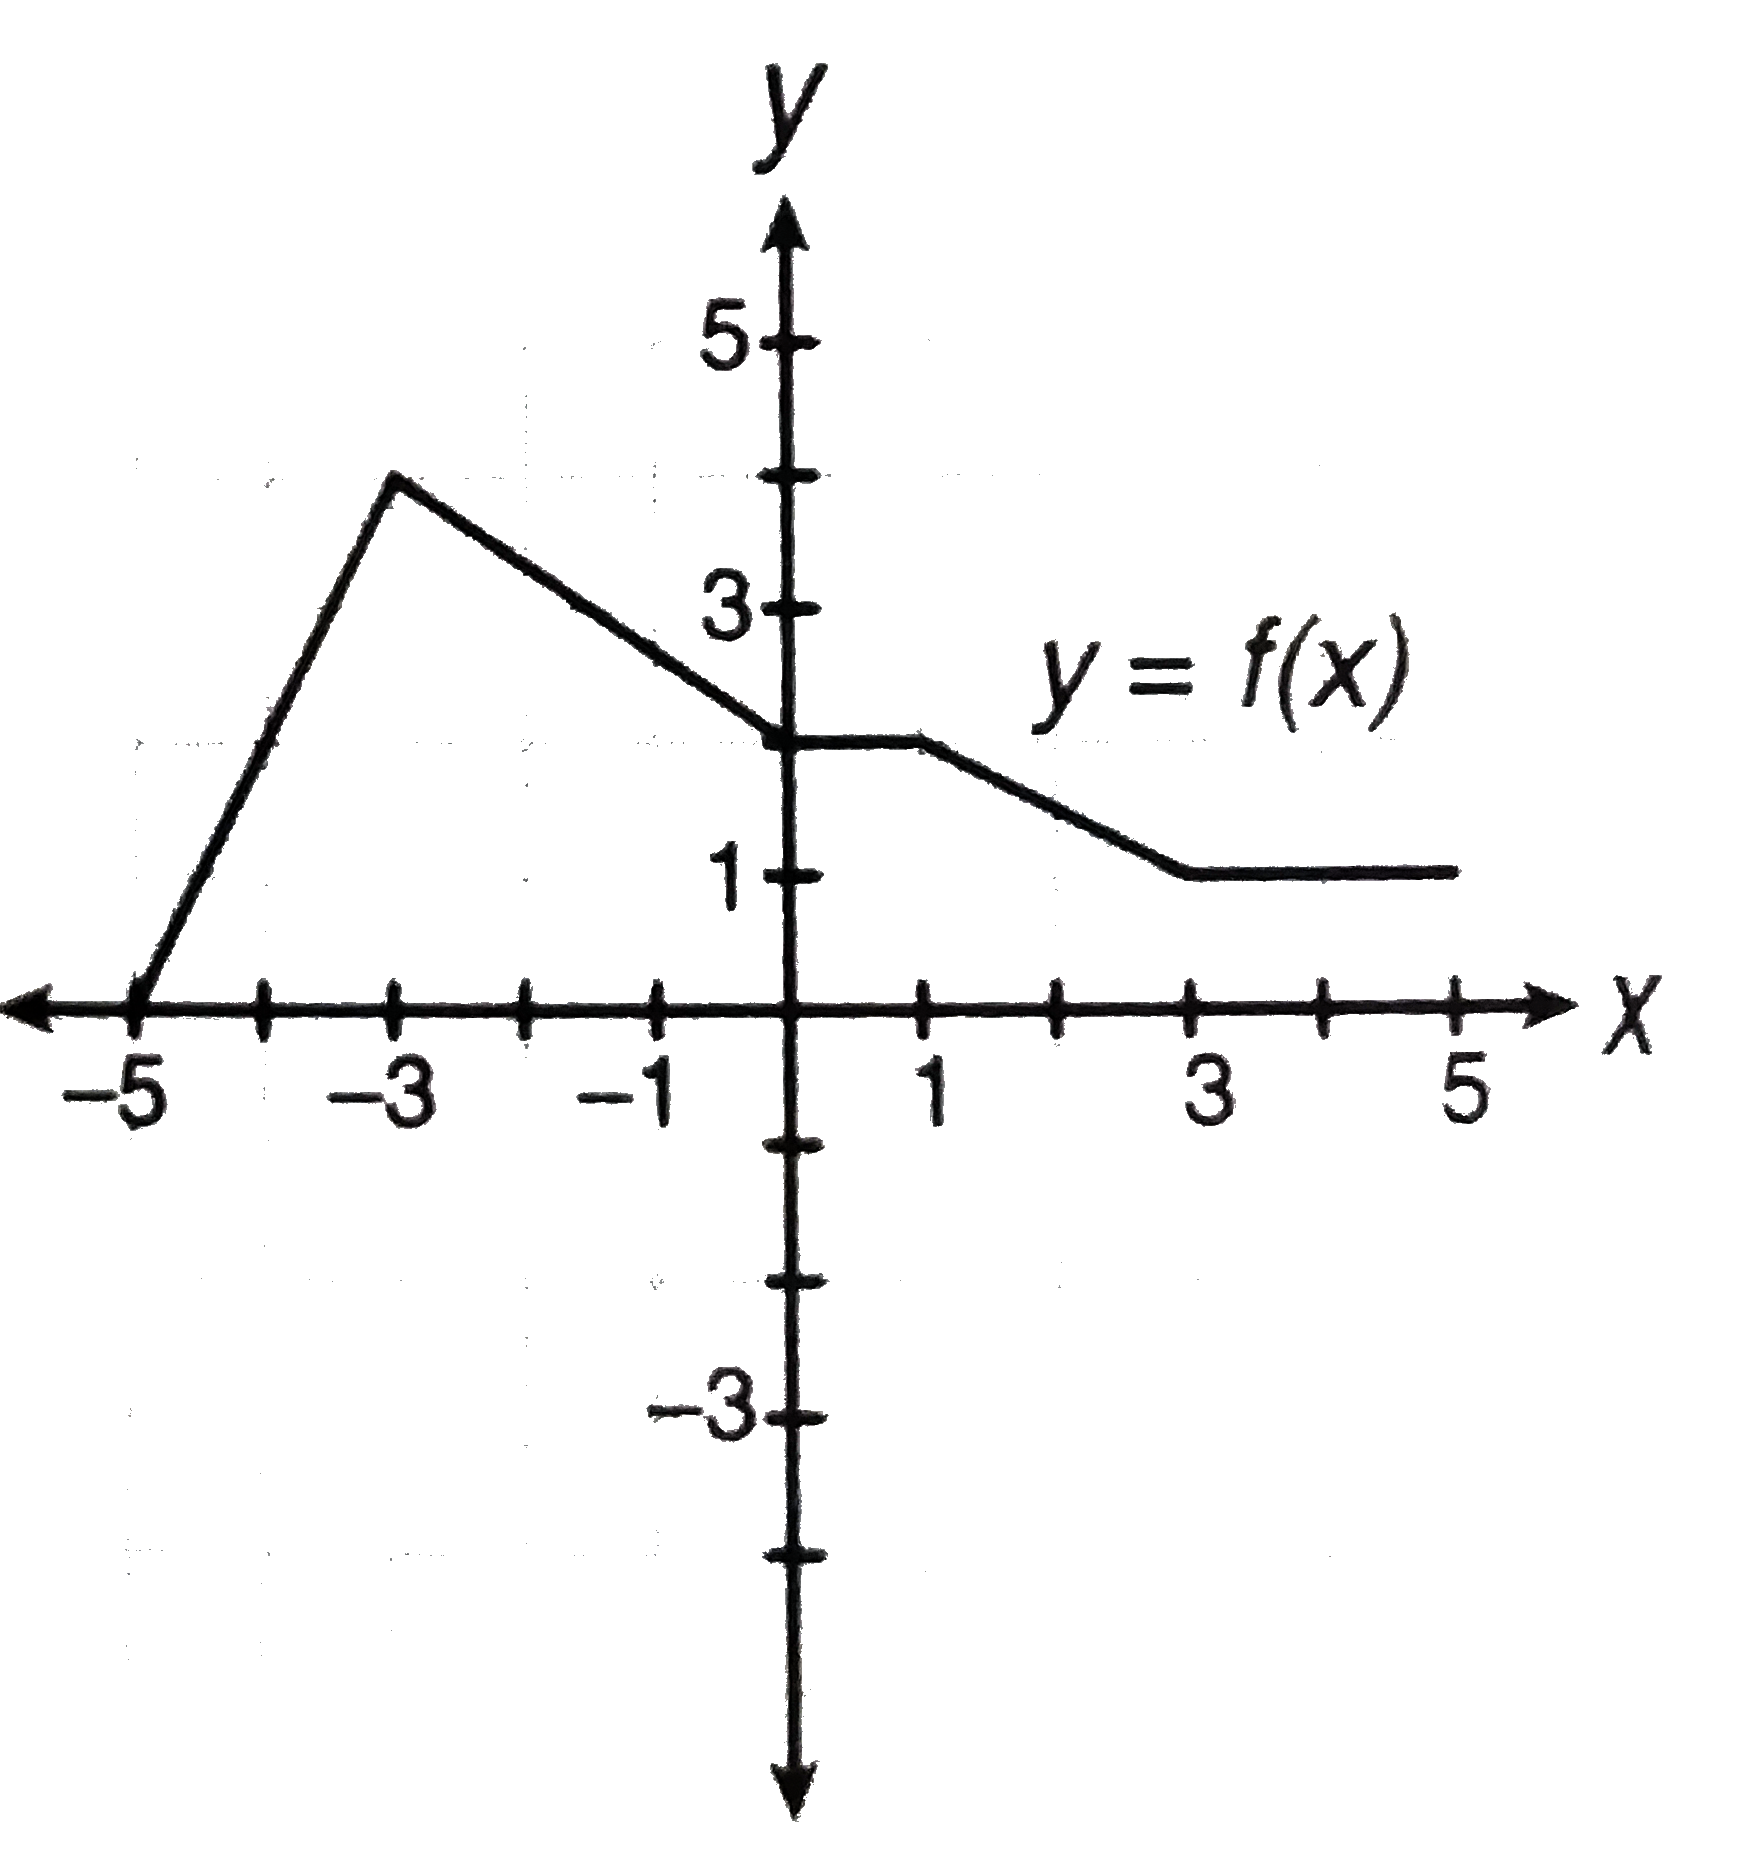
The graph of function f over the interval −5≤x≤5 is shown I the figure sbove. If f(w)=2andw>0, what is one possible value of w?
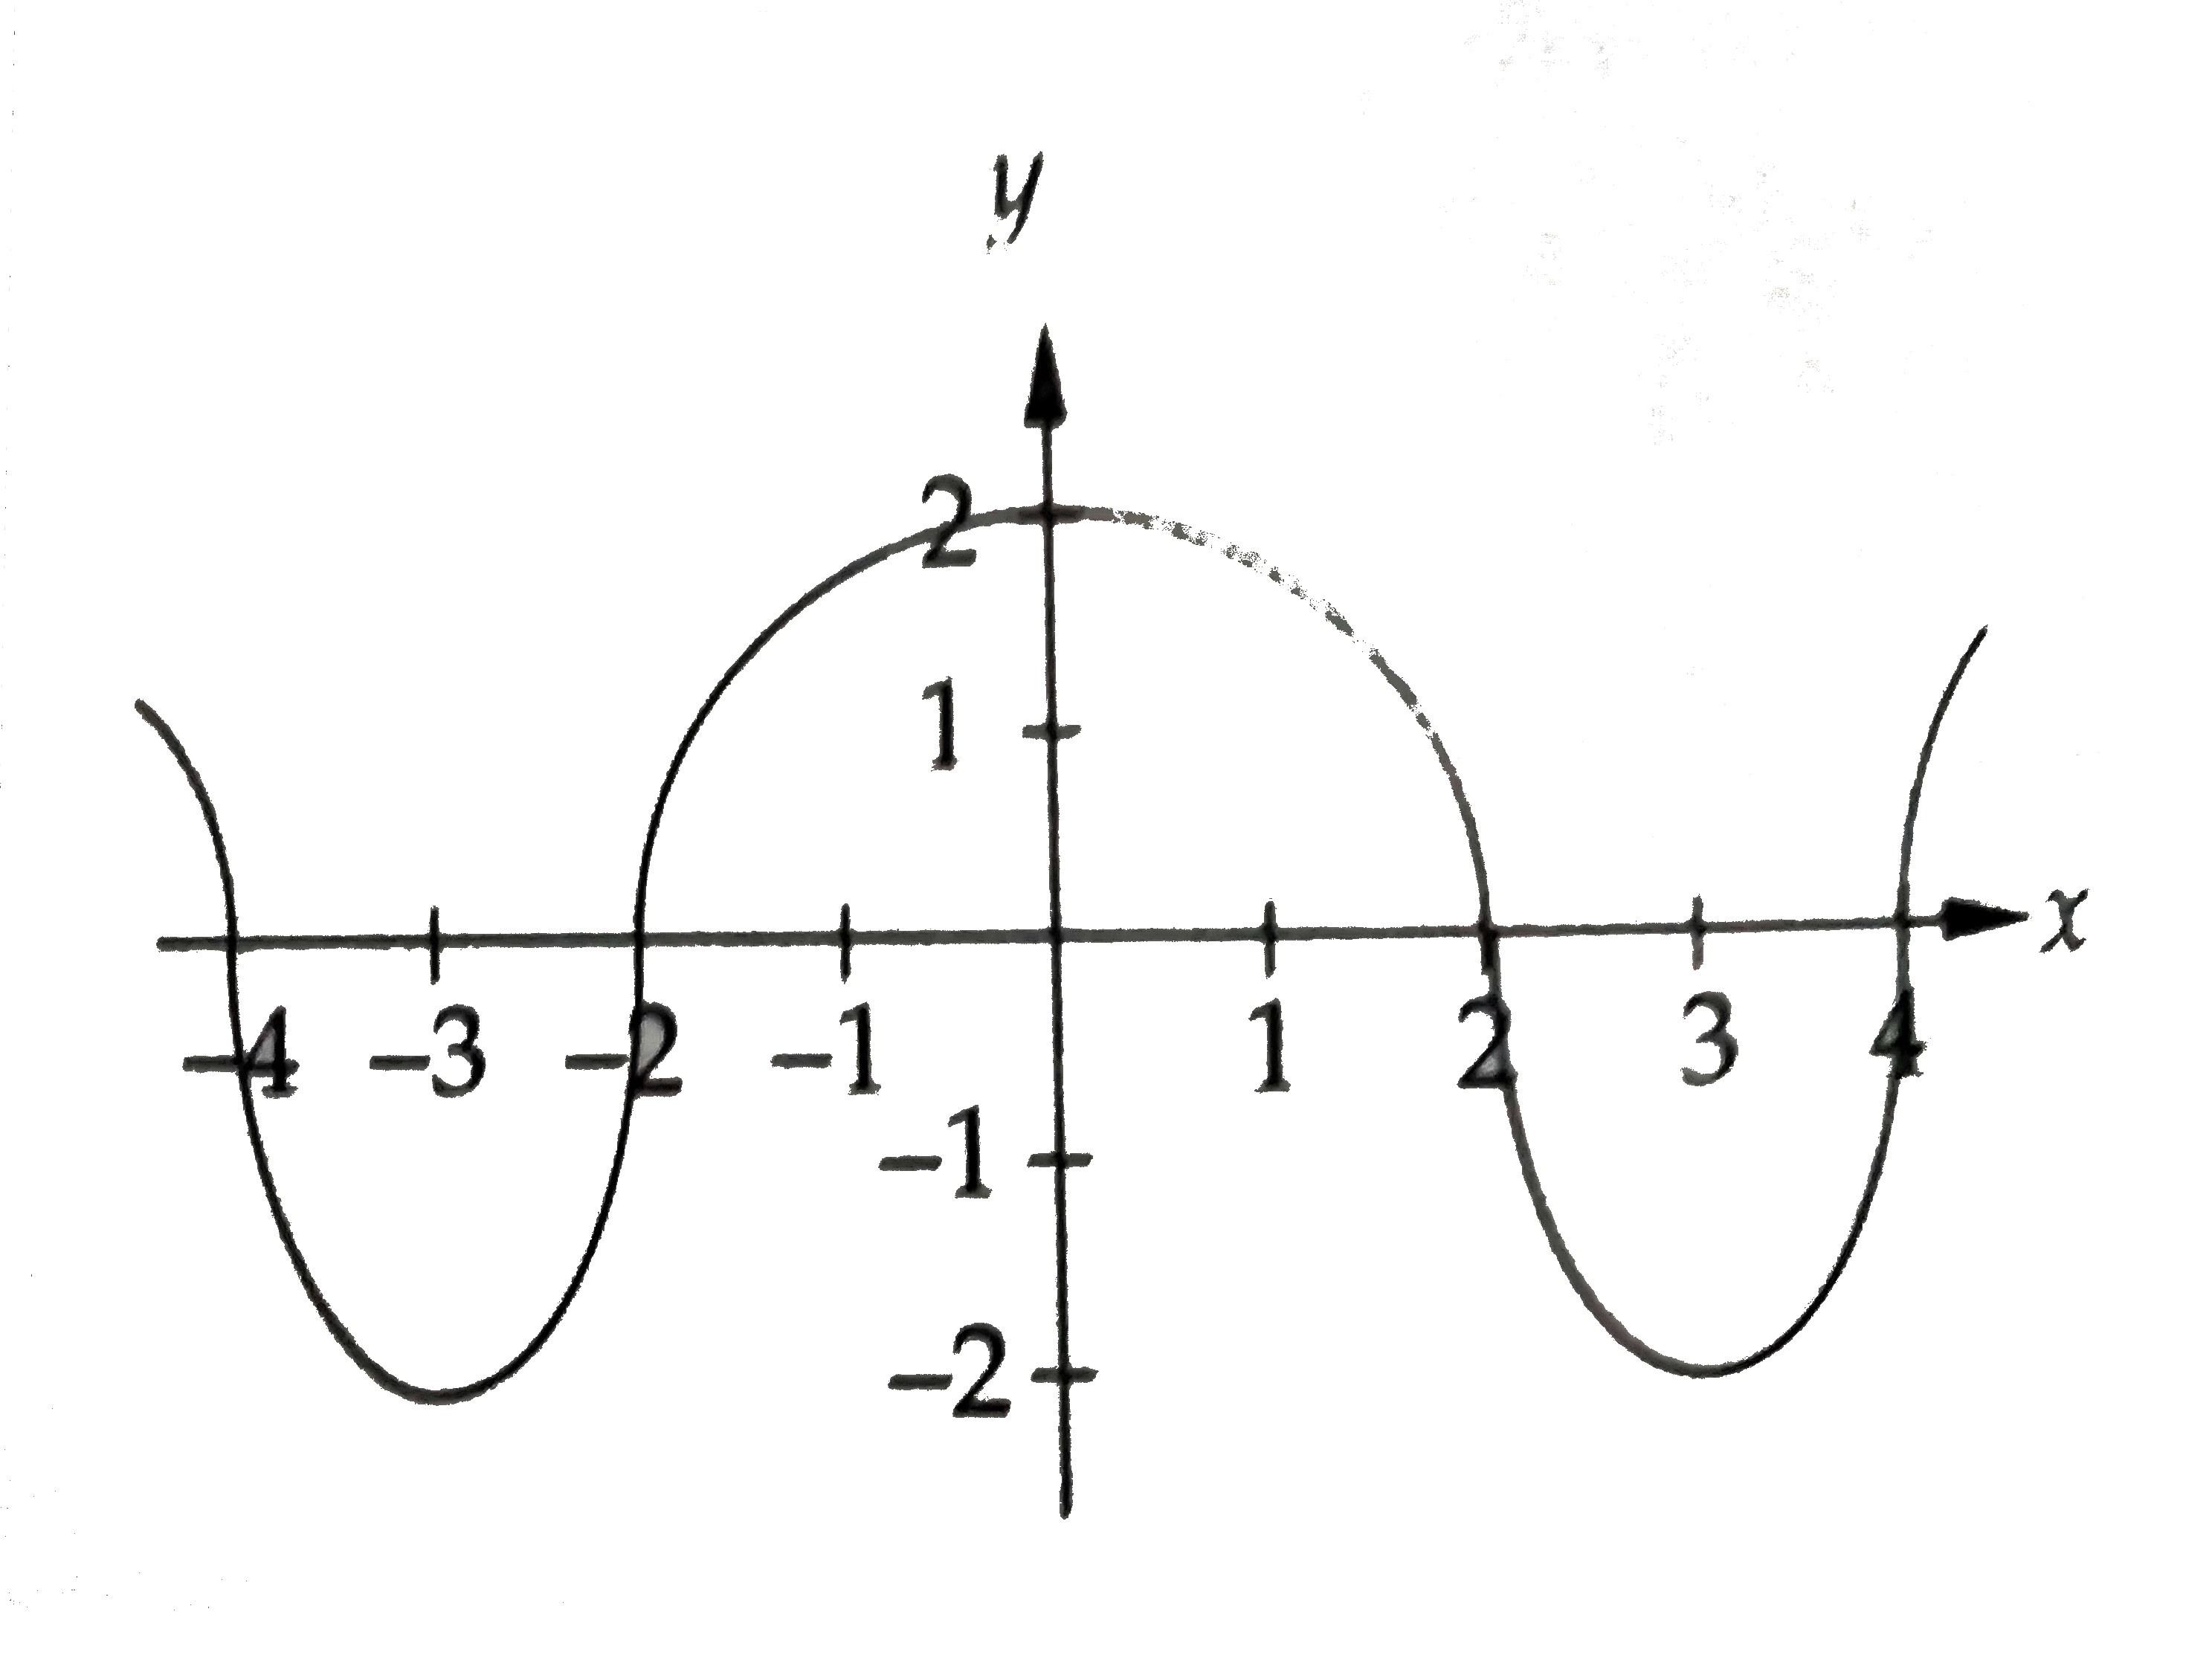
View SolutionIn Figure shows the graph of f(x), what is the value of f(f(3)) ?
View Solution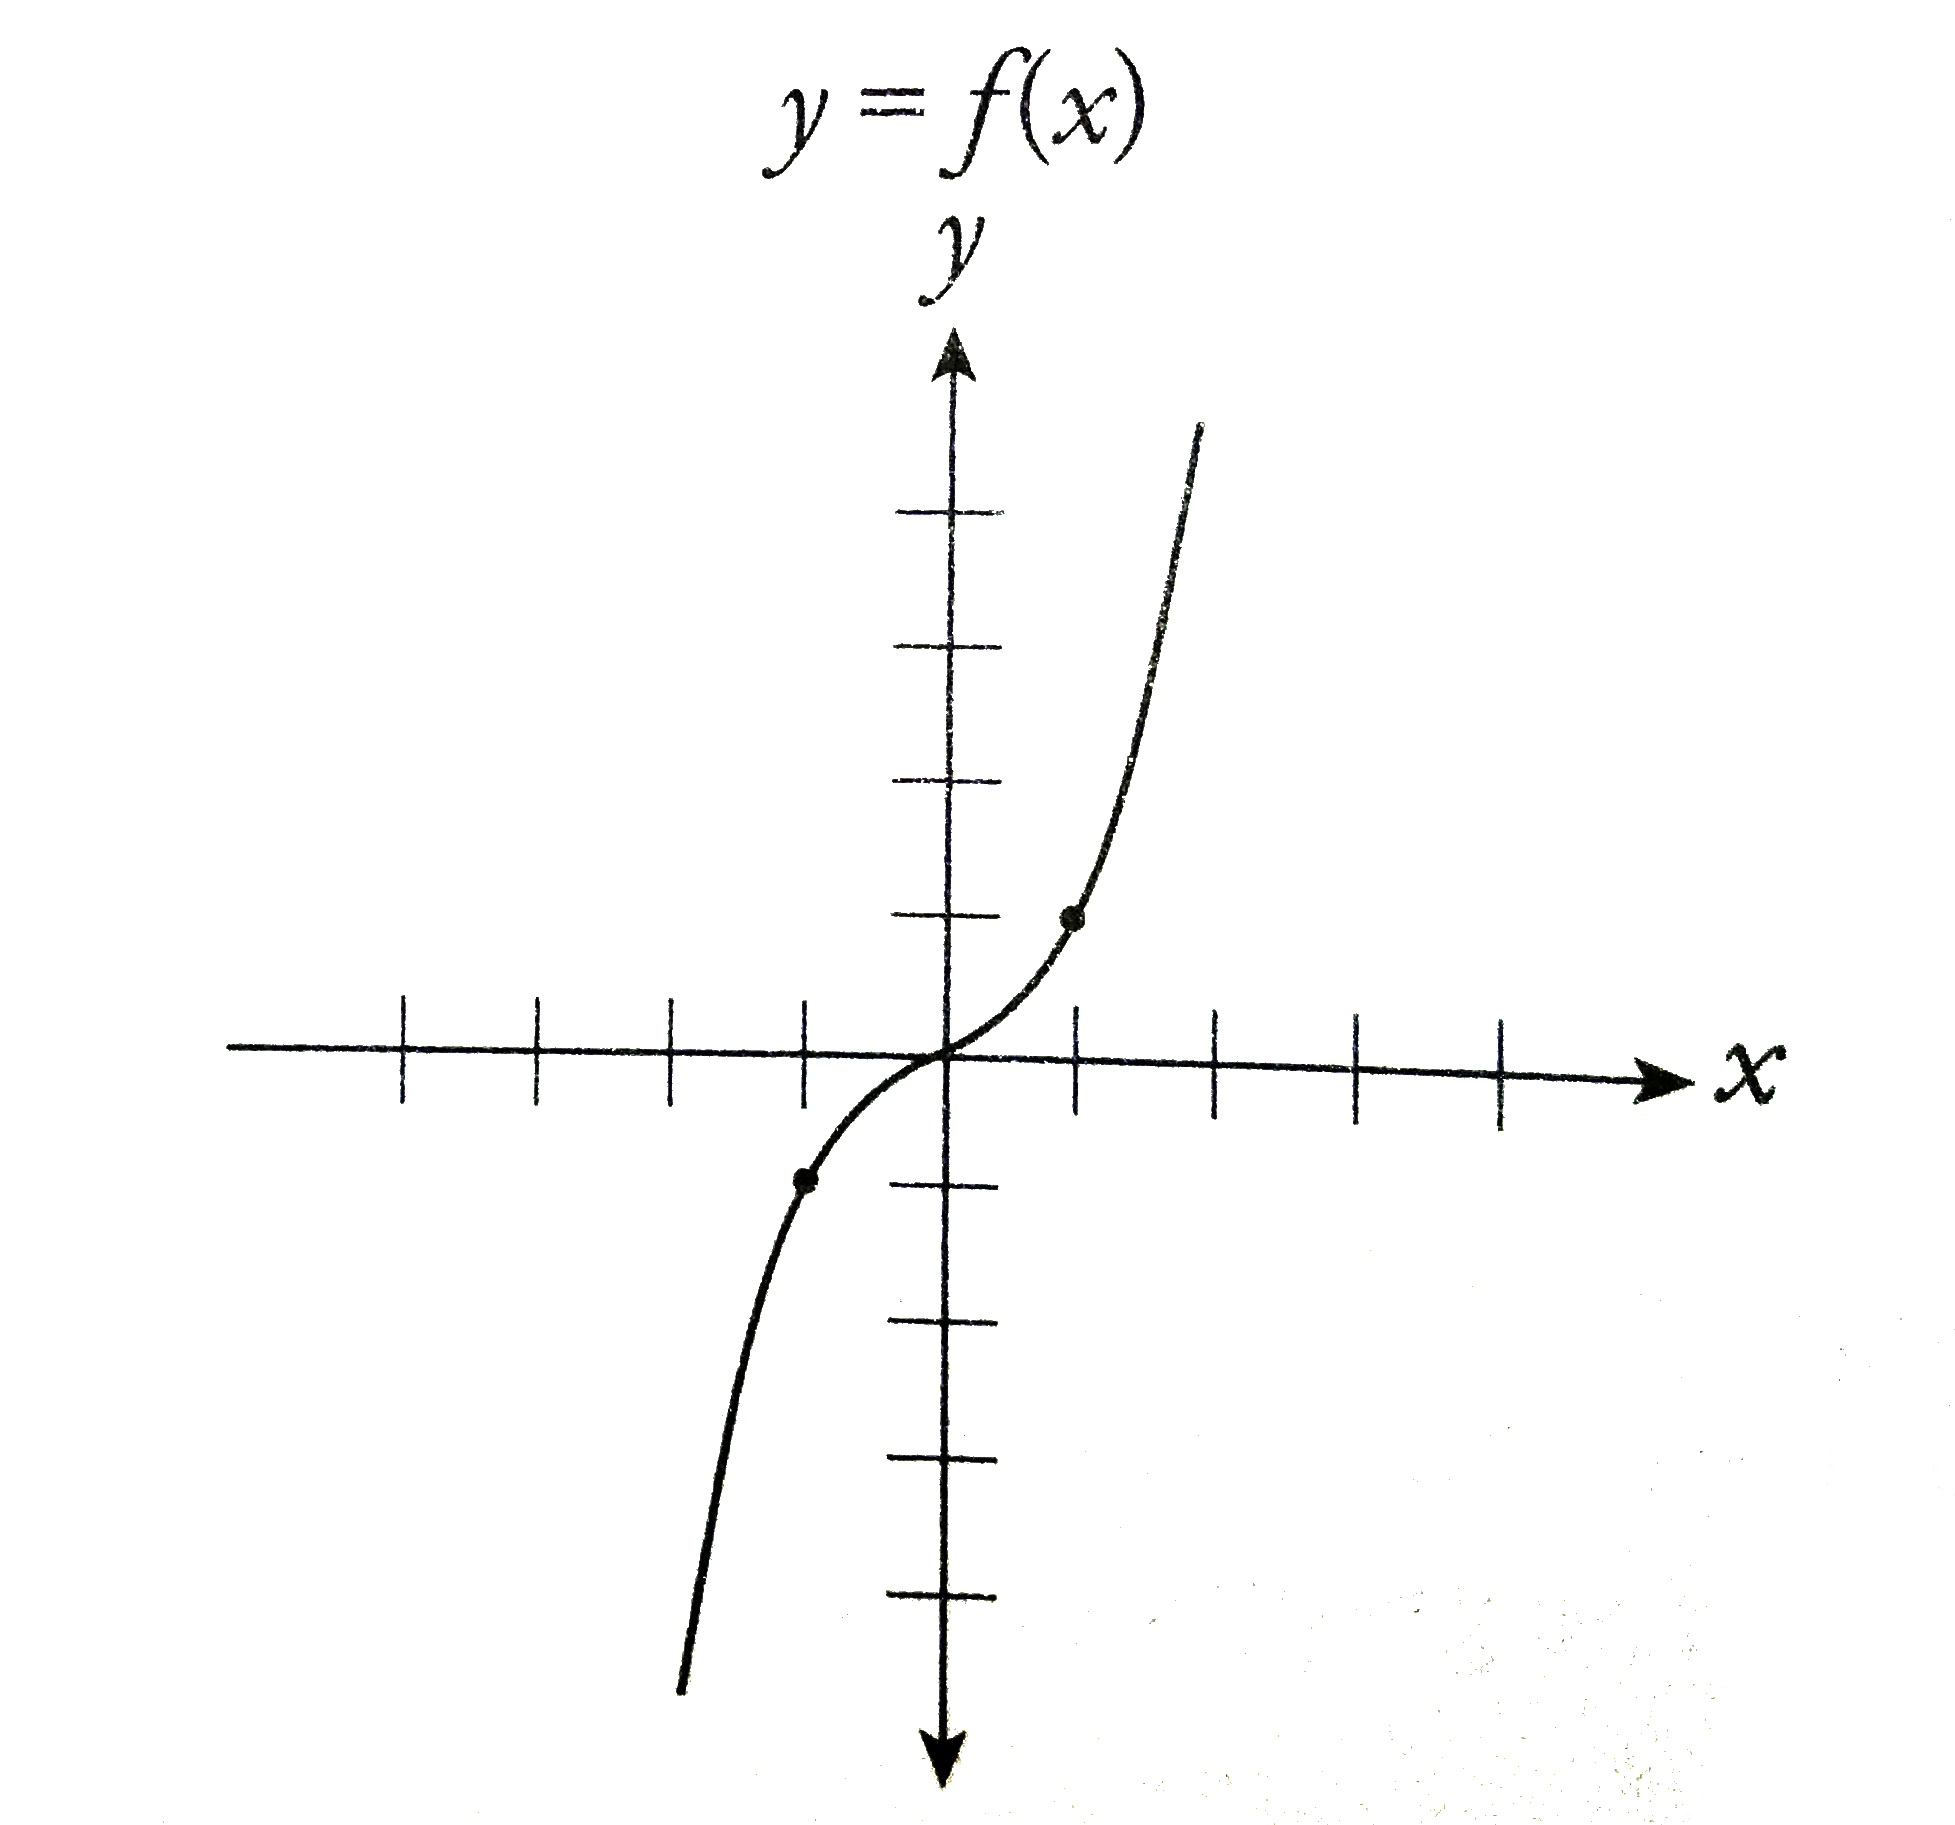
If the graph above shows the function f(x)=x3, which one of the following graphs shows f(x)=(x+2)2−3?
View Solution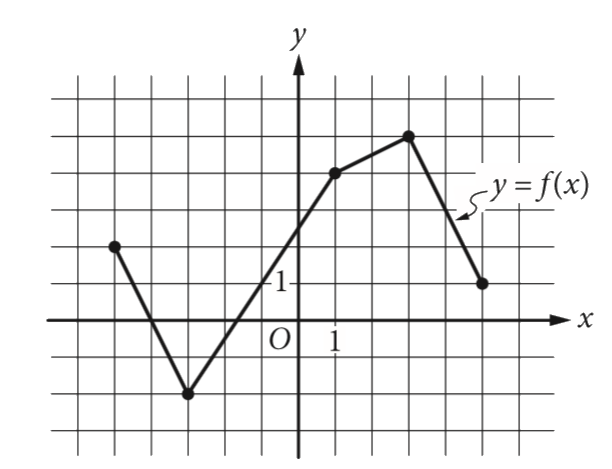
The complete graph of the function f is shown in the xy-plane above. For what value of x is the value of f(x) at its minimum?
View Solutionf(x)=x+32
For the function f defined above, what is the value of f (−1) ?
View Solution

