A standing wave ξ=asinkx.Cosωt is maintained in a homogeneous rod with cross − sectional area S and density ρ. Find the total mechanical energy confined between the sections corresponding to the adjacent displacement nodes.
The correct Answer is:4
Step by step video, text & image solution for A standing wave xi= a sin kx. Cos omegat is maintained in a homogeneous rod with cross - sectional area S and density rho. Find the total mechanical energy confined between the sections corresponding to the adjacent displacement nodes. by Physics experts to help you in doubts & scoring excellent marks in Class 11 exams.
Topper's Solved these Questions
- BOOK - RESONANCECHAPTER - SOUND WAVESEXERCISE - Exercise- 2 PART - III21videos
SOUND WAVES
- BOOK - RESONANCECHAPTER - SOUND WAVESEXERCISE - Exercise- 2 PART - IV8videos
SOUND WAVES
- BOOK - RESONANCECHAPTER - SOUND WAVESEXERCISE - Exercise- 2 PART - I25videos
SOUND WAVES
- BOOK - RESONANCECHAPTER - SIMPLE HARMONIC MOTIONEXERCISE - Exercise28videos
SIMPLE HARMONIC MOTION
- BOOK - RESONANCECHAPTER - STRING WAVESEXERCISE - Exercise32videos
STRING WAVES
Similar Questions
A longitudinal standing wave ξacoskx.Cosωt is maintained in a homogeneous medium of density ρ. Find the expressions for the space density of
(a) potential energy wp(x,t),
(b) kinetic energy wk(x,t),
Plot the space density distribution of the total energy w in the space between the displacement nodes at the moments t=0 and t=T/4, where T is oscillation period.View SolutionA plane elastic wave ξ=ae−γxcos(ωt−kx), wherea,γ,ω, and k are constants , propagates in a homogeneous medium. Find the phase difference between the oscillations at the points where the particles, displacement amplitudes differ by η=1.0%, if γ=0.42m−1 and the wavelength is λ=50cm.
View Solution
Knowledge Check
- Question 1 - Select One
A standing wave is maintained in a homogeneous string of corss-sectional area 'S' and density phe. It is formed by the superposition of two waves travelling in opposite directions given by the equation y1=asin(ωt=kx)andy2=2asin(ωt+kx). The total mechanical energy confined between the sections corresponding to the abjacent antinodes is:
A3πspω2a22kBπspω2a22kC5πspω2a22kD2πspω2a22k - Question 2 - Select One
A standing wave is maintained in a homogerneous string of cross - sectional area a and density p . It is formed bt yhe superpostions given of two waves travelling in opposite direations given by the equations
A3πspω2a22kBπspω2a22kC5πspω2a22kD2πspω2a22k - Question 3 - Select One
A longitudinal standing wave y=acoskxcosωt is maintained in a homogeneious medium of density ρ. Here ω is the angular speed and k , the wave number and a is the amplitude of the standing wave . This standing wave exists all over a given region of space.
If a graph E(=Ep+Ek) versus t , i.e., total space energy density verus time were drawn at the instants of time t=0 and t=T/4, between two successive nodes separated by distance λ/2 which of the following graphs correctly shows the total energy (E) distribution at the two instants.A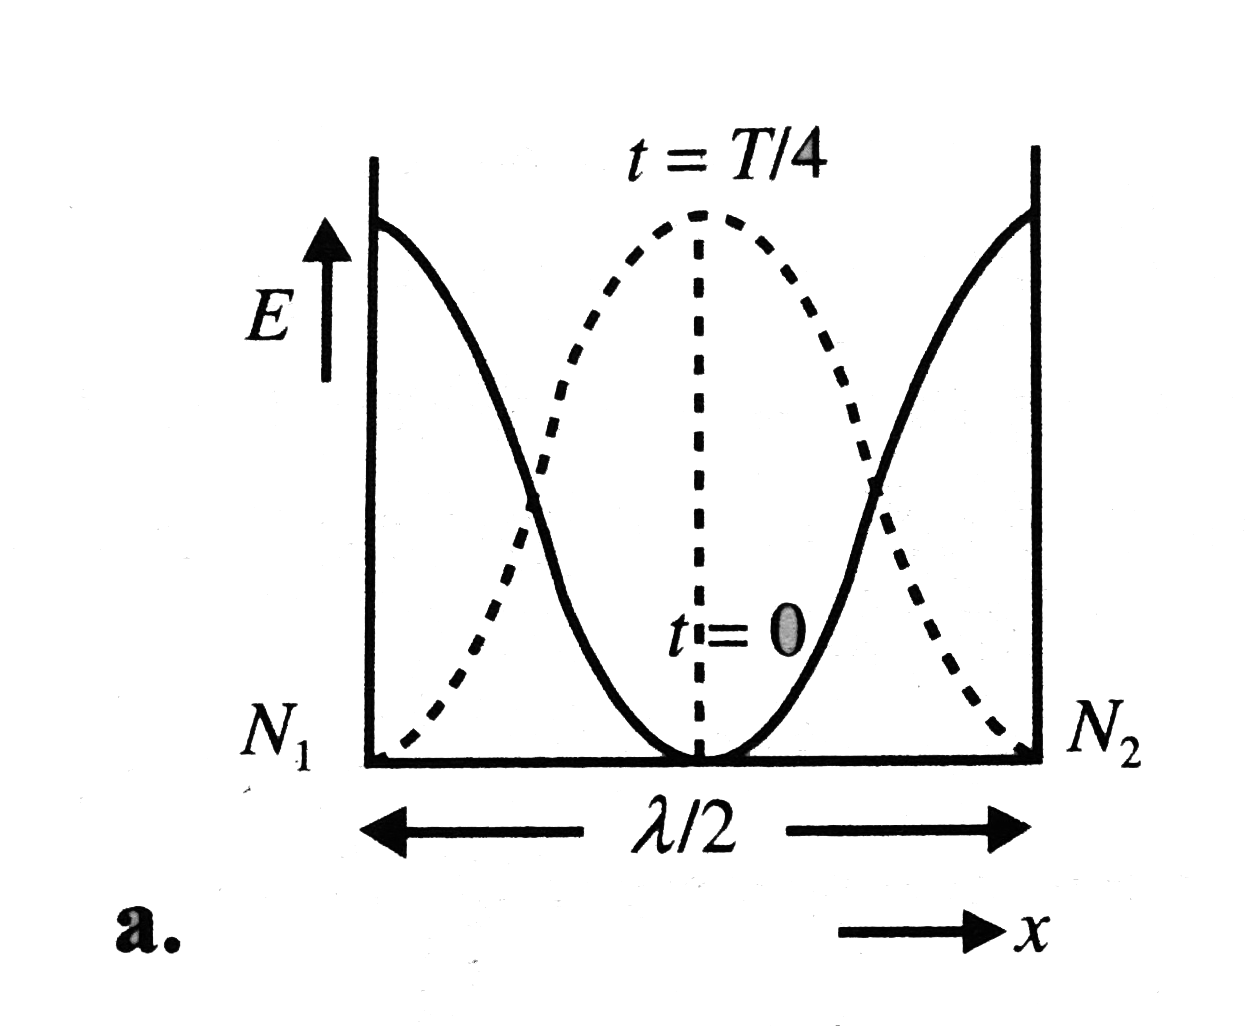 B
B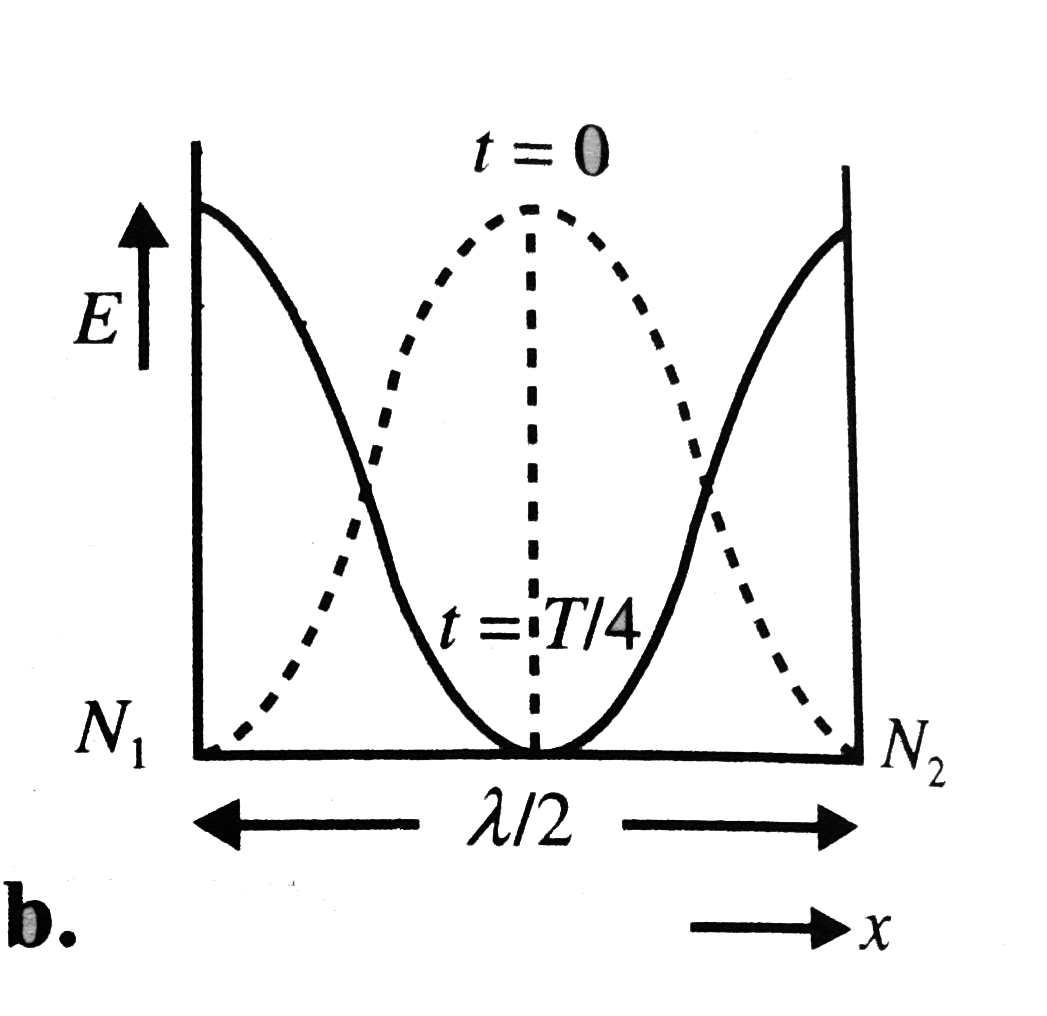 C
C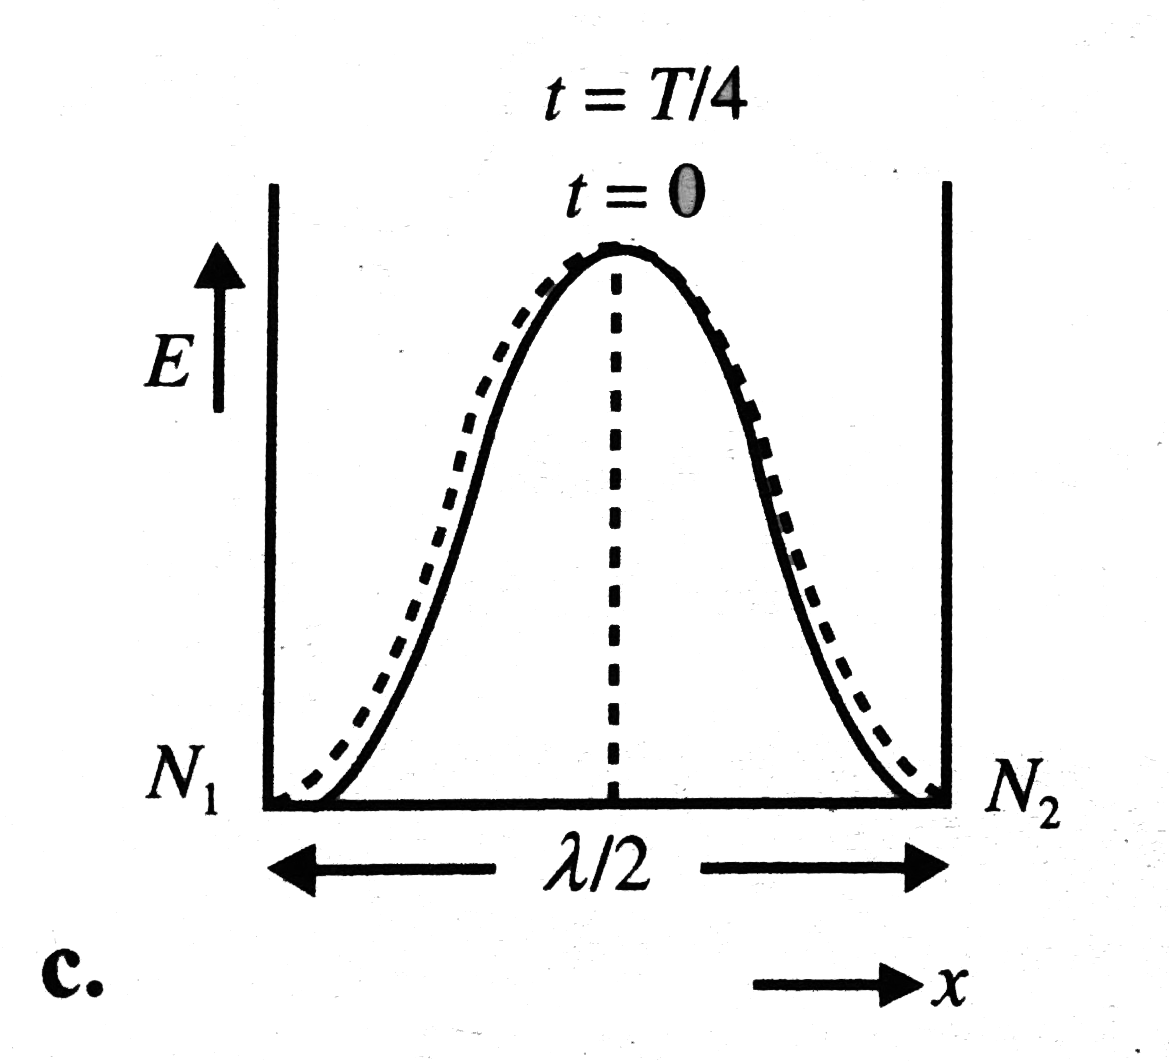 D
D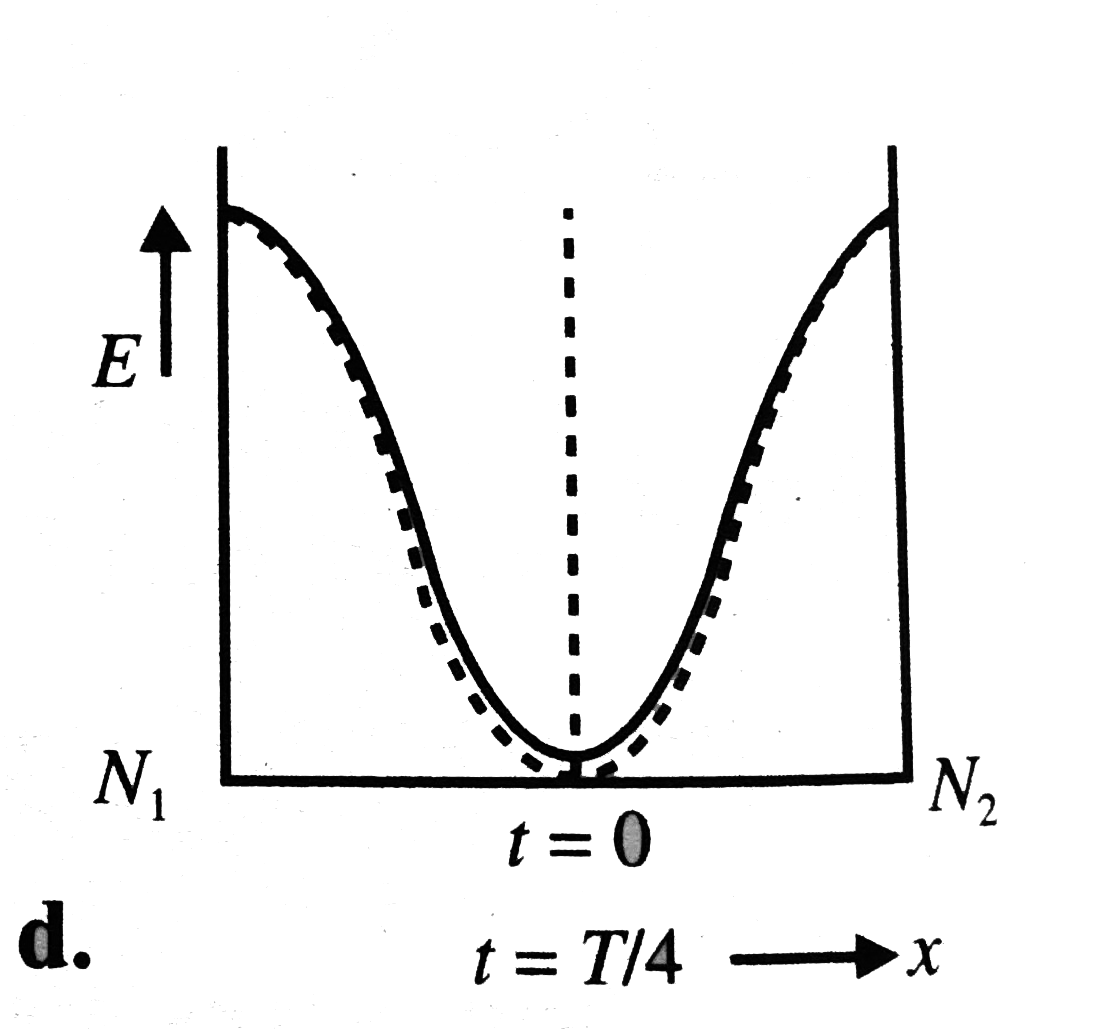
y1=8sin(ωt−kx)andy2=6sin(ωt+kx) are two waves travelling in a string of area of cross-section s and density rho. These two waves are superimposed to produce a standing wave.
(a) Find the energy of the standing wave between two consecutive nodes.
(b) Find the total amount of energy crossing through a node per second.View SolutionA standing wave y=Asinkx.cosωt is established in a string fixed at its ends.
(a) What is value of instantaneous power transfer at a cross section of the string when the string is passing through its mean position?
(b) What is value of instantaneous power transfer at a cross section of the string when the string is at its extreme position?
(c) At what frequency is the power transmitted through a cross section changing with time?View SolutionA transverse wave is passing through a light string shown in fig.The equation of wave is y=Asin(wt−kx) the area of cross-section of string A and density is ρ the hanging mass is :
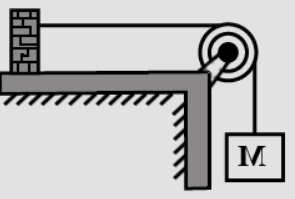 View Solution
A longitudinal standing wave y=acoskxcosωt is maintained in a homogeneious medium of density ρ. Here ω is the angular speed and k , the wave number and a is the amplitude of the standing wave . This standing wave exists all over a given region of space.
The space density of the potential energy PE=Ep(x,t) at a point (x,t) in this space isView SolutionA longitudinal standing wave y=acoskxcosωt is maintained in a homogeneious medium of density ρ. Here ω is the angular speed and k , the wave number and a is the amplitude of the standing wave . This standing wave exists all over a given region of space.
The space density of the kinetic energy . KE=Ek(x,t) at the point (x,t) is given byView Solution

