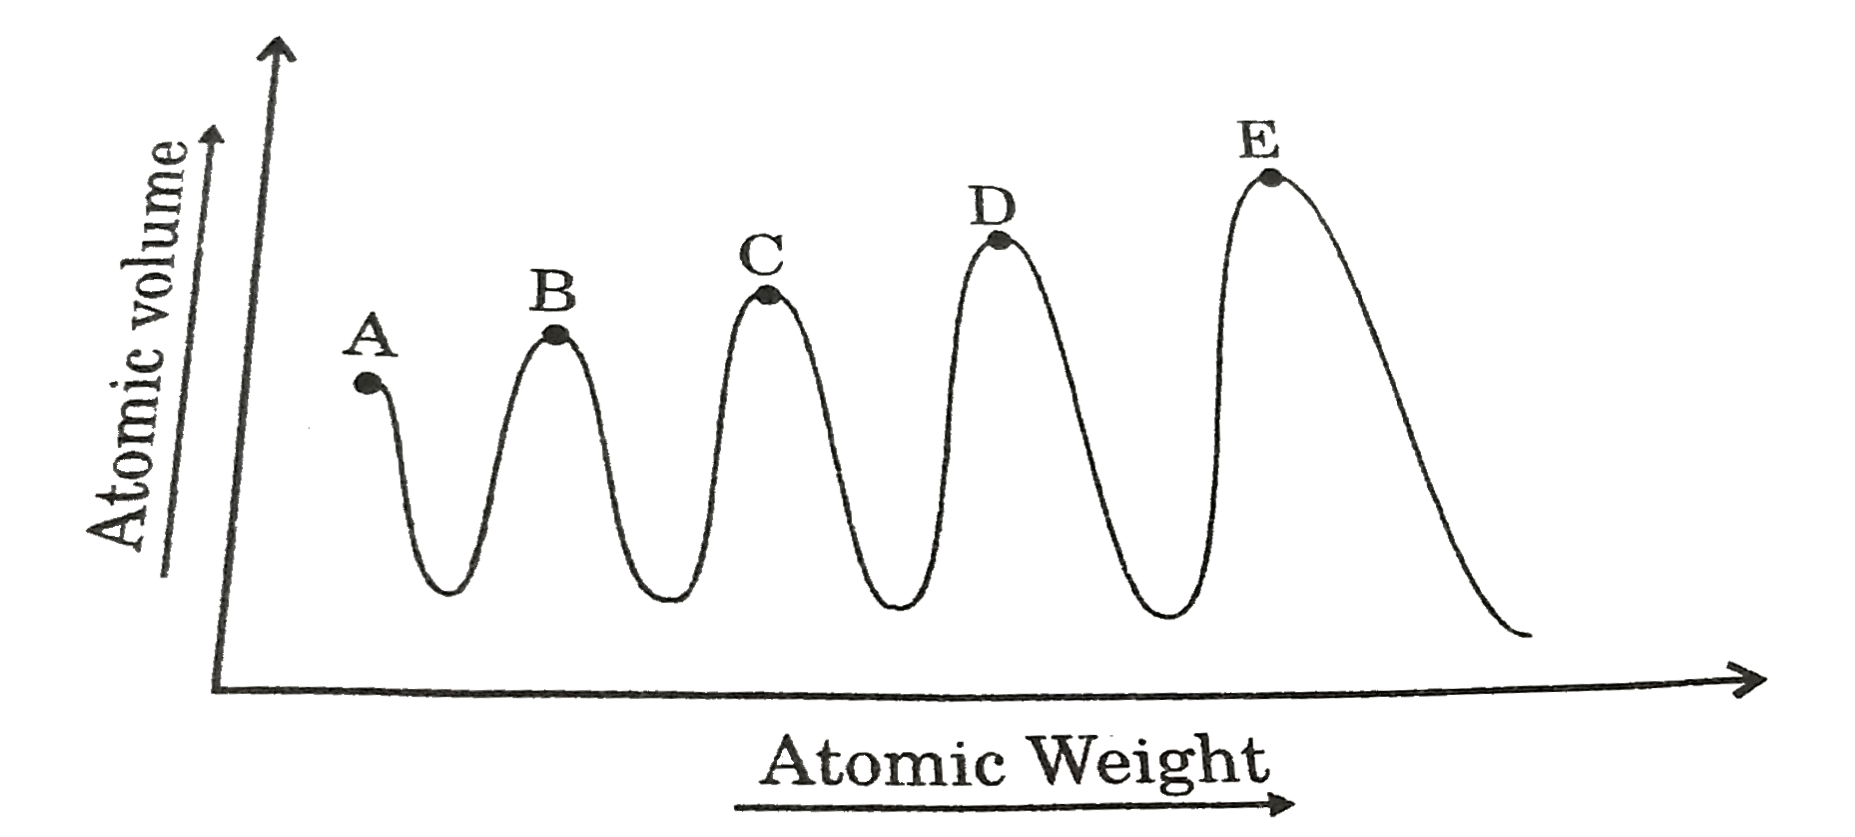
Lother Meyer atttempts to classify the elements by plotting graph between ________and ________.
A
Atomic size
B
Atomic volume
C
Density
D
Melting point
Video Solution
Text Solution
The correct Answer is:B
|
Answer
Step by step video, text & image solution for Lother Meyer atttempts to classify the elements by plotting graph between ________and ________. by Chemistry experts to help you in doubts & scoring excellent marks in Class 11 exams.
Updated on:21/07/2023
Topper's Solved these Questions
- BOOK - BANSALCHAPTER - PERIODIC TABLEEXERCISE - EXERCISE-133videos
PERIODIC TABLE
- BOOK - BANSALCHAPTER - PERIODIC TABLEEXERCISE - EXERCISE-236videos
PERIODIC TABLE
- BOOK - BANSALCHAPTER - PERIODIC TABLEEXERCISE - Solved Examples15videos
PERIODIC TABLE
- BOOK - BANSALCHAPTER - ISOMERISMEXERCISE - Exercise -341videos
ISOMERISM
- BOOK - BANSALCHAPTER - S BLOCKEXERCISE - Exercise-412videos
S BLOCK
Similar Questions
Knowledge Check
- Question 1 - Select One
Lother Meyer obtained the curve for the known elements by plotting their atomic volumes against
AAtomic numbersBAtomic massesCDensitiesDIonization energies - Question 2 - Select One
In the Lother Meyer graph, A,B,C,D and E elements are :
 AhalogensBalkaline earth metalsCalkali metalsDtransition metals
 - Question 3 - Select One
Lother Meyer drew a graph showing the relation between
Aatomic number and atomic weightBatomic number and atomic sizeCatomic weight and atomic volumeDatomic weight and atomic size
What was the basis of classification of elements by Lother Meyer?
View SolutionIn Lother Meyer's curve, the halogens occupy positions on the
View SolutionLother Meyer drew a graph showing the relation between
View SolutionIn Searl's experiment a graph is plotted between
View SolutionIn Lother Meyer plot, the peaks are occupied by
View Solution

