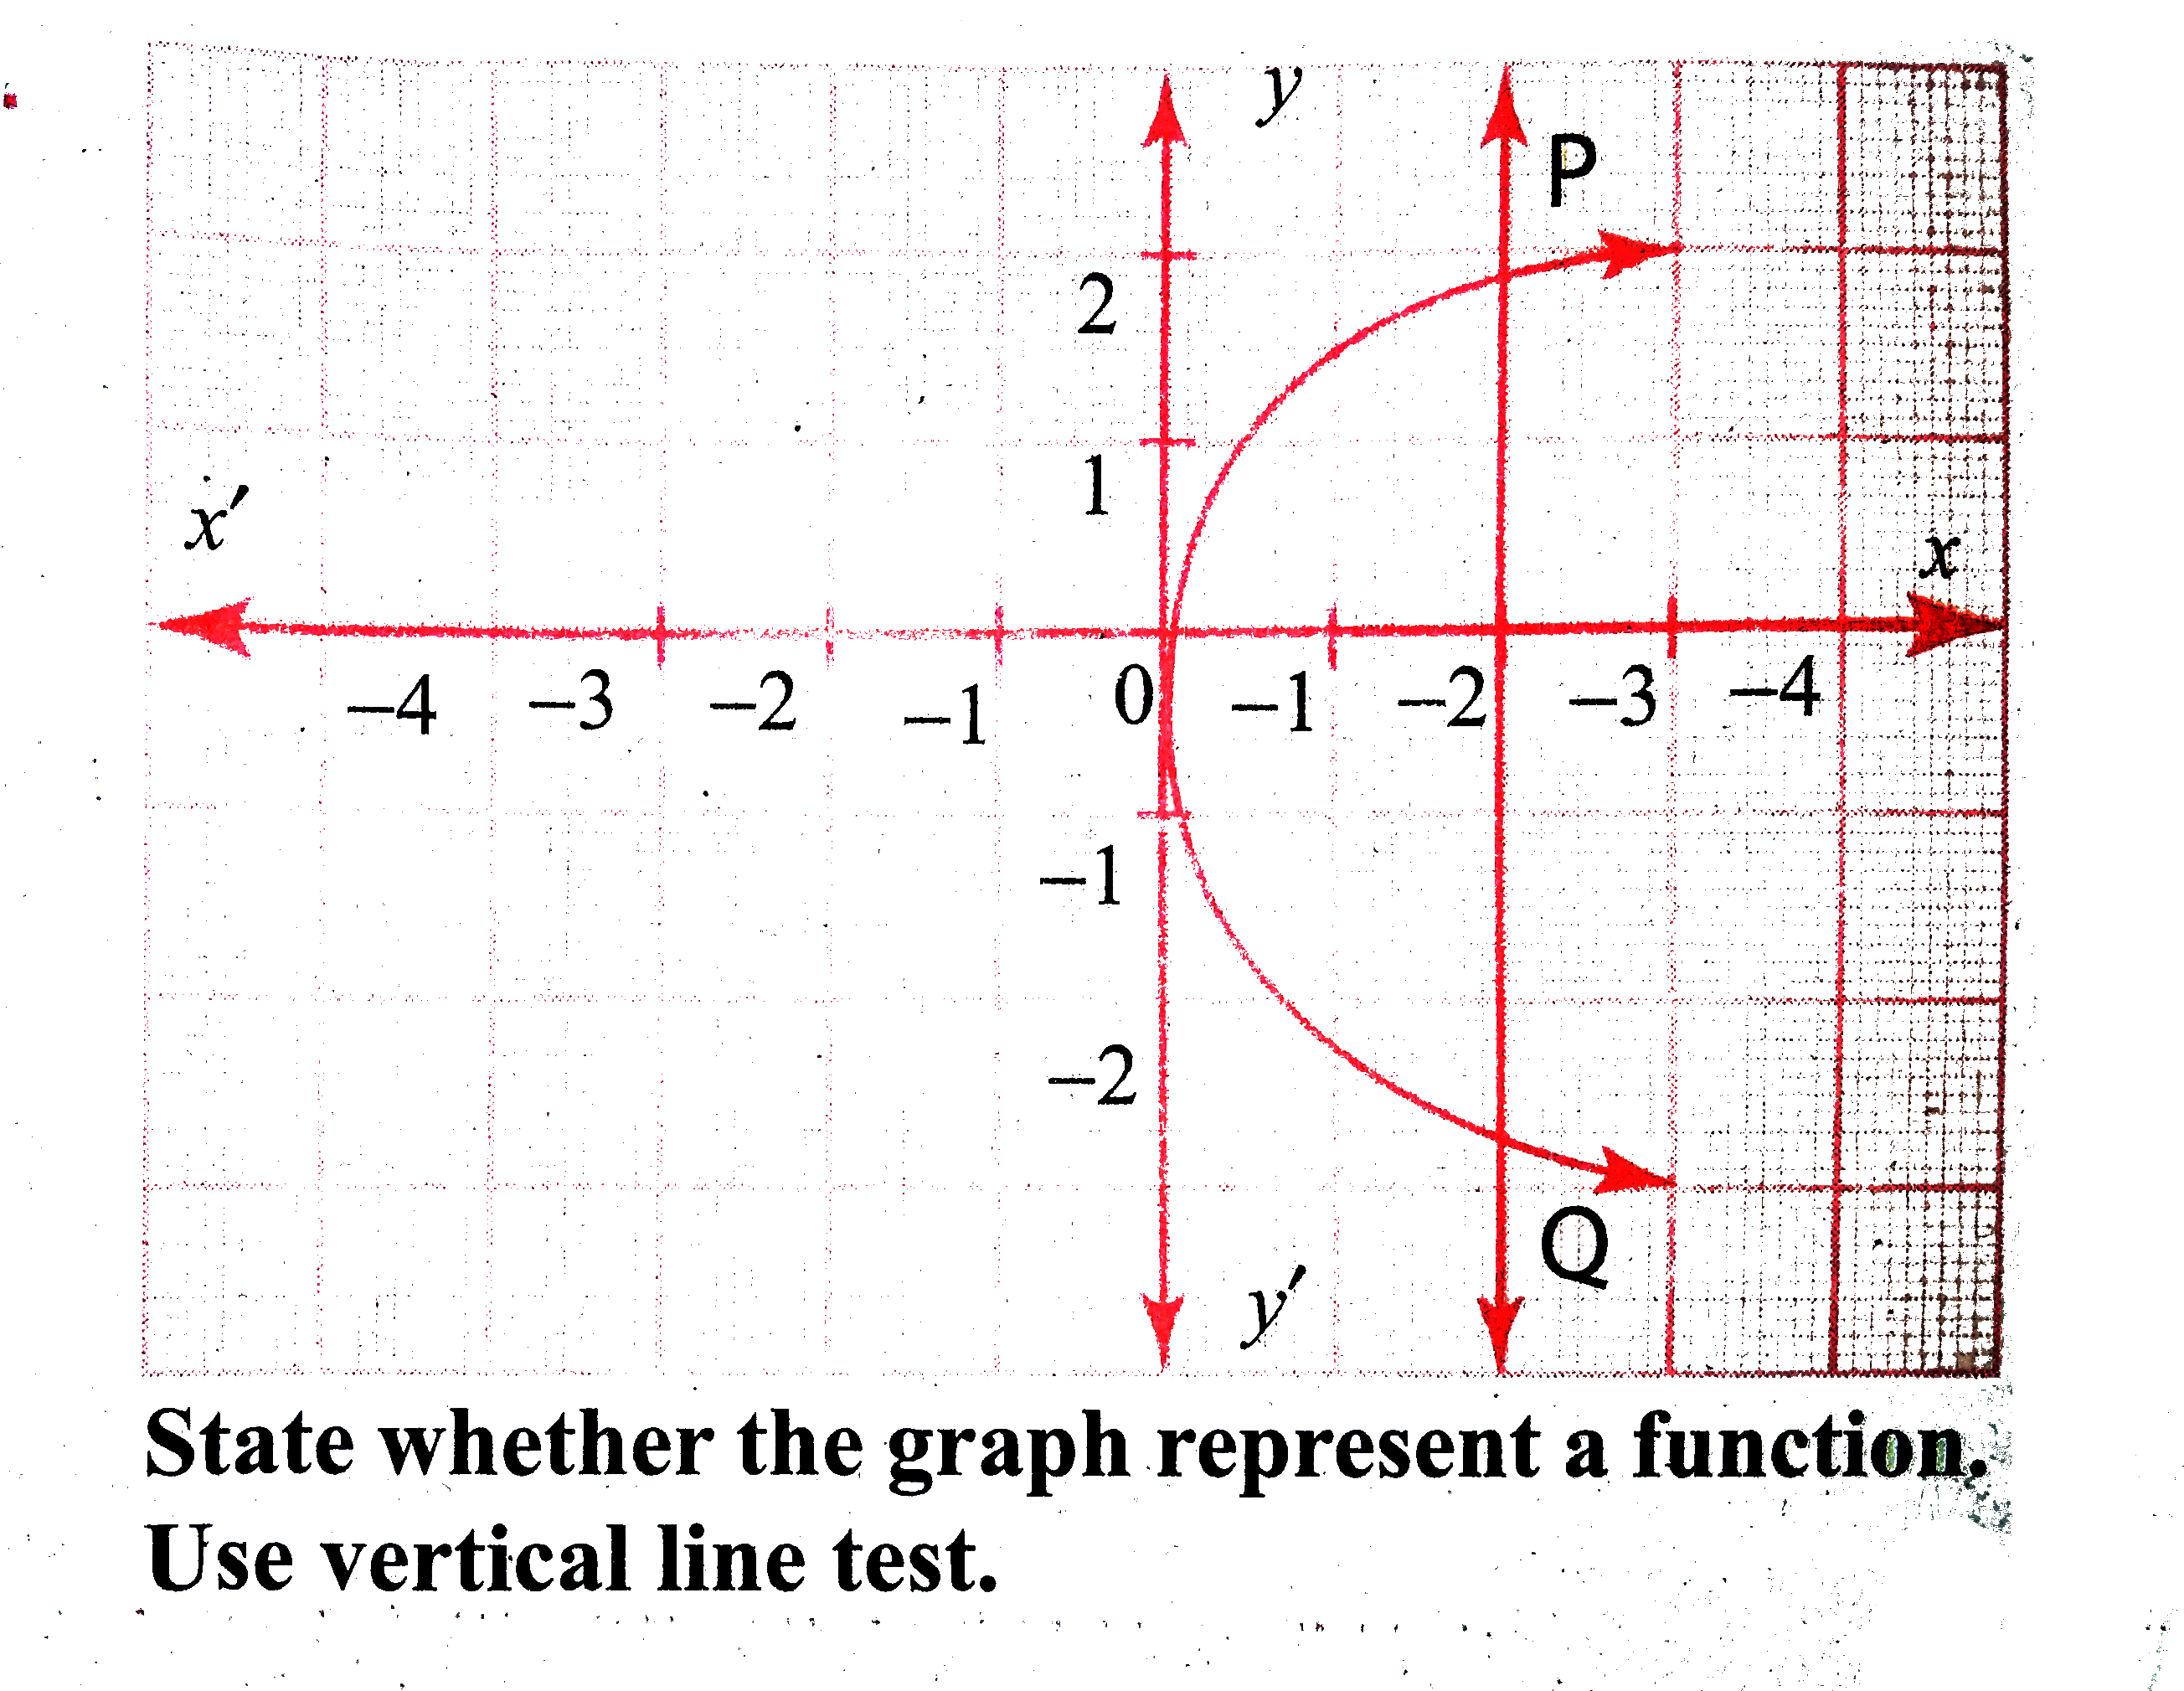
State whether the graph represent a function. Use vertical line testSolution in Tamil
Step by step video & image solution for State whether the graph represent a function. Use vertical line test by Maths experts to help you in doubts & scoring excellent marks in Class 10 exams.
Updated on:21/07/2023Topper's Solved these Questions
- RELATIONS AND FUNCTIONSBOOK - SURA PUBLICATIONCHAPTER - RELATIONS AND FUNCTIONSEXERCISE - Unit Test
14 Videos
- RELATIONS AND FUNCTIONSBOOK - SURA PUBLICATIONCHAPTER - RELATIONS AND FUNCTIONSEXERCISE - GOVERNMENT EXAM QUESTIONS
13 Videos
- ONE MARK QUESTIONS SET BOOK - SURA PUBLICATIONCHAPTER - ONE MARK QUESTIONS SET EXERCISE - Multiple Choice Question
250 Videos
- STATISTICS AND PROBABILITY BOOK - SURA PUBLICATIONCHAPTER - STATISTICS AND PROBABILITY EXERCISE - Unit Test (Section -C)
1 Videos
Similar Questions
n(R)={(x,x2)∣x is a prime number less than 13} is
View Solutionf={(2,1),(3,b),(4,b),(5,c)} is a____.
View SolutionIf the ordered pairs (a+2,4)and(5,2a+b) are equal to then (a, b) is
View SolutionThe frequency distribution is given below.
xk2k3k4k5k6kf211111
In the table, k is a positive integer, has a varience of 160. Determine the value of k.
View SolutionHow many lines of symmetry does the above figure have ?
View SolutionWhich of the following are correct chain isomers of butane ? (i)
View SolutionDetermine the point of symmetry of a regular hexagon.
View SolutionDtermine the images of the following figure about the given line :
View SolutionMatch the following Column A to Column B

View SolutionMatch the following Column A to Column B

View SolutionMatch the following Column A to Column B

View SolutionFind the area of the figure given below.

View SolutionThe area of the shaded part in the figure given below is ______.

View SolutionThe inequation represented by the graph given below is :
View SolutionThe inequation that best describes the graph given below is _________
View SolutionThe inequation that best describes the following graph is _________
View Solution
