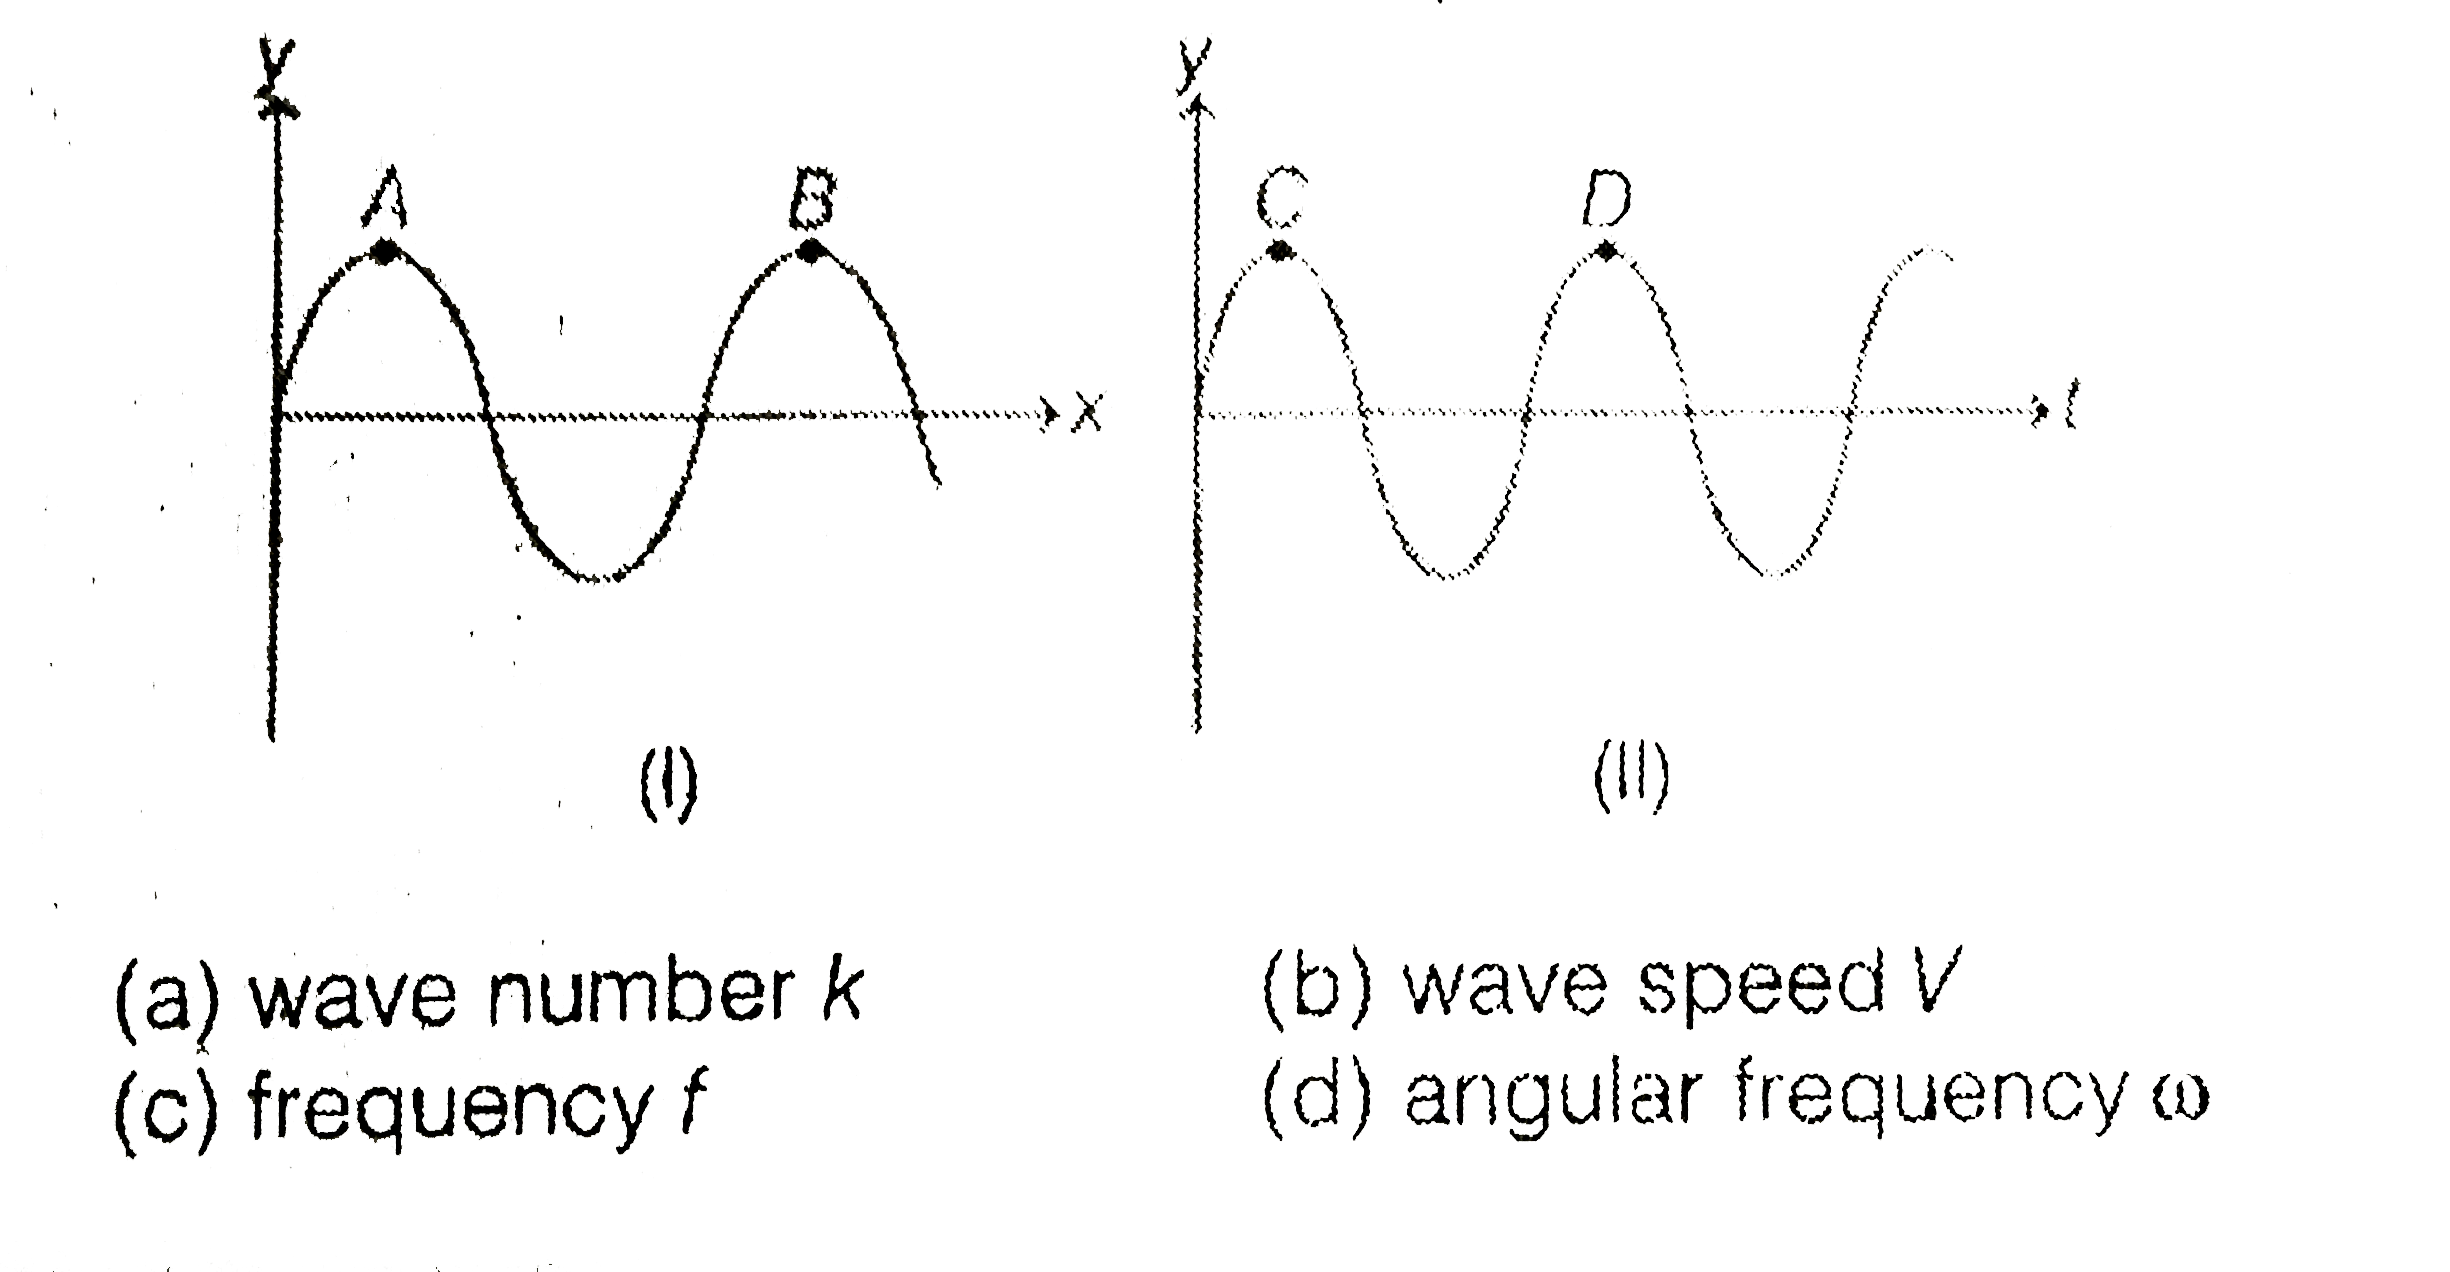
The same progressive wave is represented by two graphs I and II. Graph I shows how the displacement 'y' varies with the distance x along the wave at a given time. Graph II shows how y varies with time t at a given point on the wave. The ratio of measurements AB to CD, marked on the curves, represents :-

wave number (K)
wave speed (v)
frequency (v)
angular frequency (ω)
The correct Answer is:B
AB=λ
CD=T
ABCD=λT=v(wave speed)
Topper's Solved these Questions
Similar Questions
the same progressive wave is reprsented by two group I and II. Graoup I shows how the displacement 'y' varies with the distance x along the wave at a given time. Graph II shows how y varies with time t at a given point on the wave. The ratio of measurements AB to CD, marked on the curvse m repersents.

View SolutionThe displacement of a progressive wave is represented by y=Asin(ωt−kx), where x is distance and t is time. Write the dimensional formula of (i) omega and (ii) k.
View Solution
Knowledge Check
the same progressive wave is reprsented by two group I and II. Graoup I shows how the displacement 'y' varies with the distance x along the wave at a given time. Graph II shows how y varies with time t at a given point on the wave. The ratio of measurements AB to CD, marked on the curvse m repersents.
 Awave number KBwave speed VCfrequecny fDangular fequecy ω
The displacement of a progressive wave is represented by y=Asin(ωt−kx) where x is distance and t is time. The dimensions of ωk are same as those of
AvelocityBwave numberCwavelengthDfrequencyThe displacement of a progressive wave is represented by y=Asin(ωt−kx) where x is distance and t is time. The dimensions of ωk are same as those of
AvelocityBwave numberCwavelengthDfrequency
The displacement of a progressive wave is represented by y=Asin(ωt−kx), where x is distance and t is time. Write the dimensional formula of (i) ω and (ii) k.
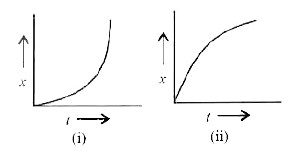
View SolutionFigures (i) and (ii) below show the displacement - time graphs of two particles moving along the x-axis. We can say that

View Solution
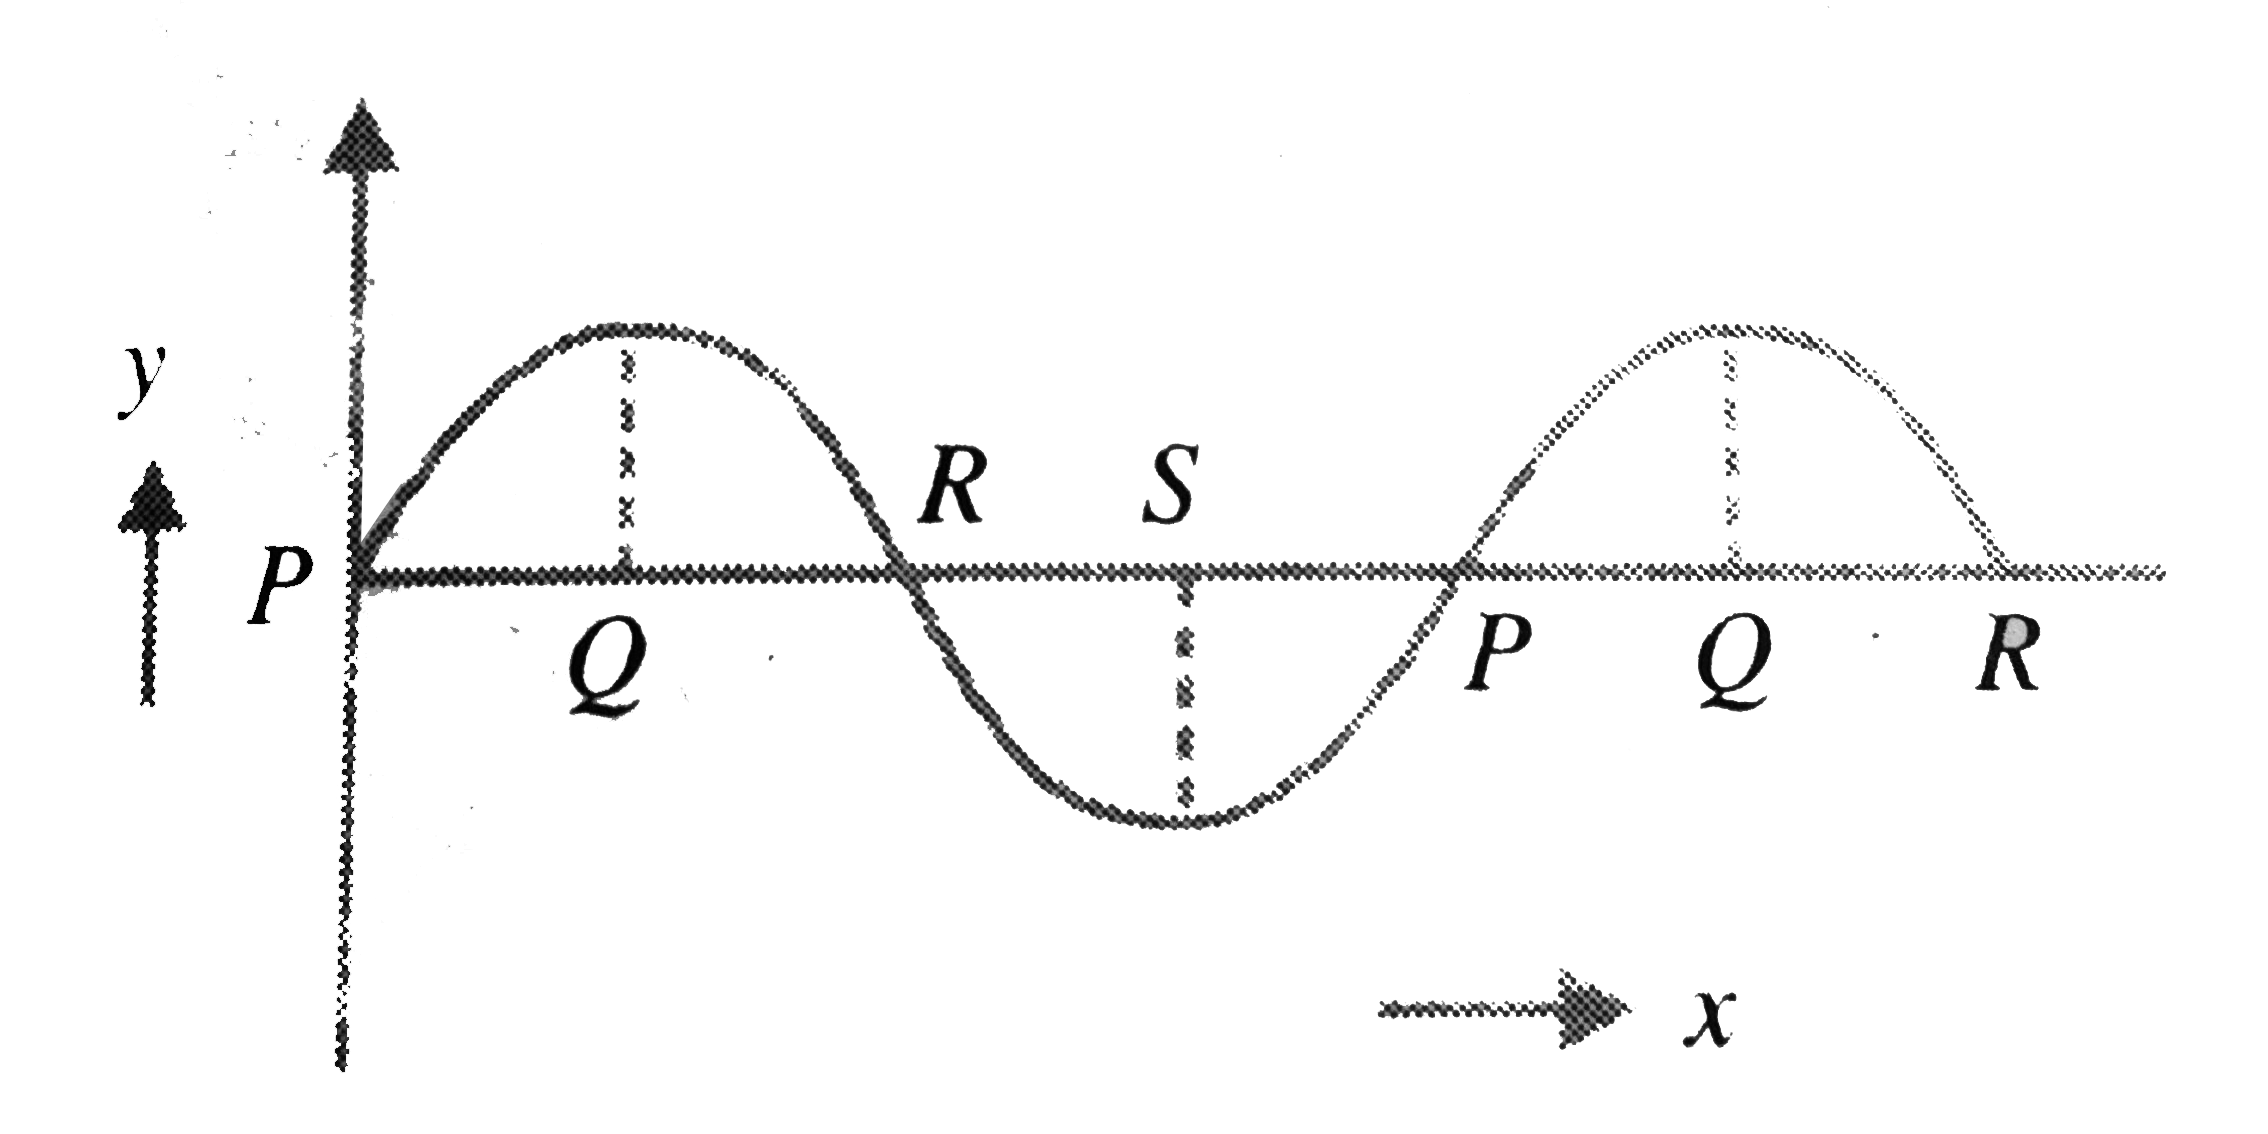
Figure. Represents the displacement y versus distance x along the direction of propagation of a longitudinal wave. The pressure is maximum at position marked
View SolutionFigure (i) and (i) show the displacement-time graphs of two particles moving along the x-axis. We can say that

View Solution
Figure. Represents the displacement y versus distance x along the direction of propagation of a longitudinal wave. The pressure is maximum at position marked
View Solution
