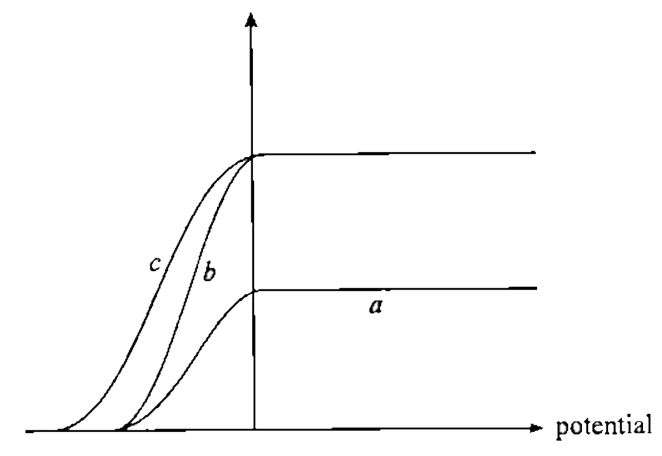
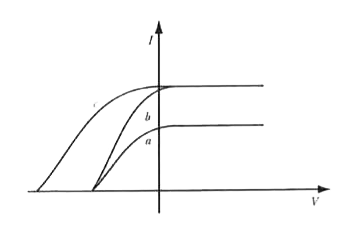
The figure shows a plot of photo current versus anode potential for a photosensitive surface for three different radiations. Which one of the following is a correct statement ?
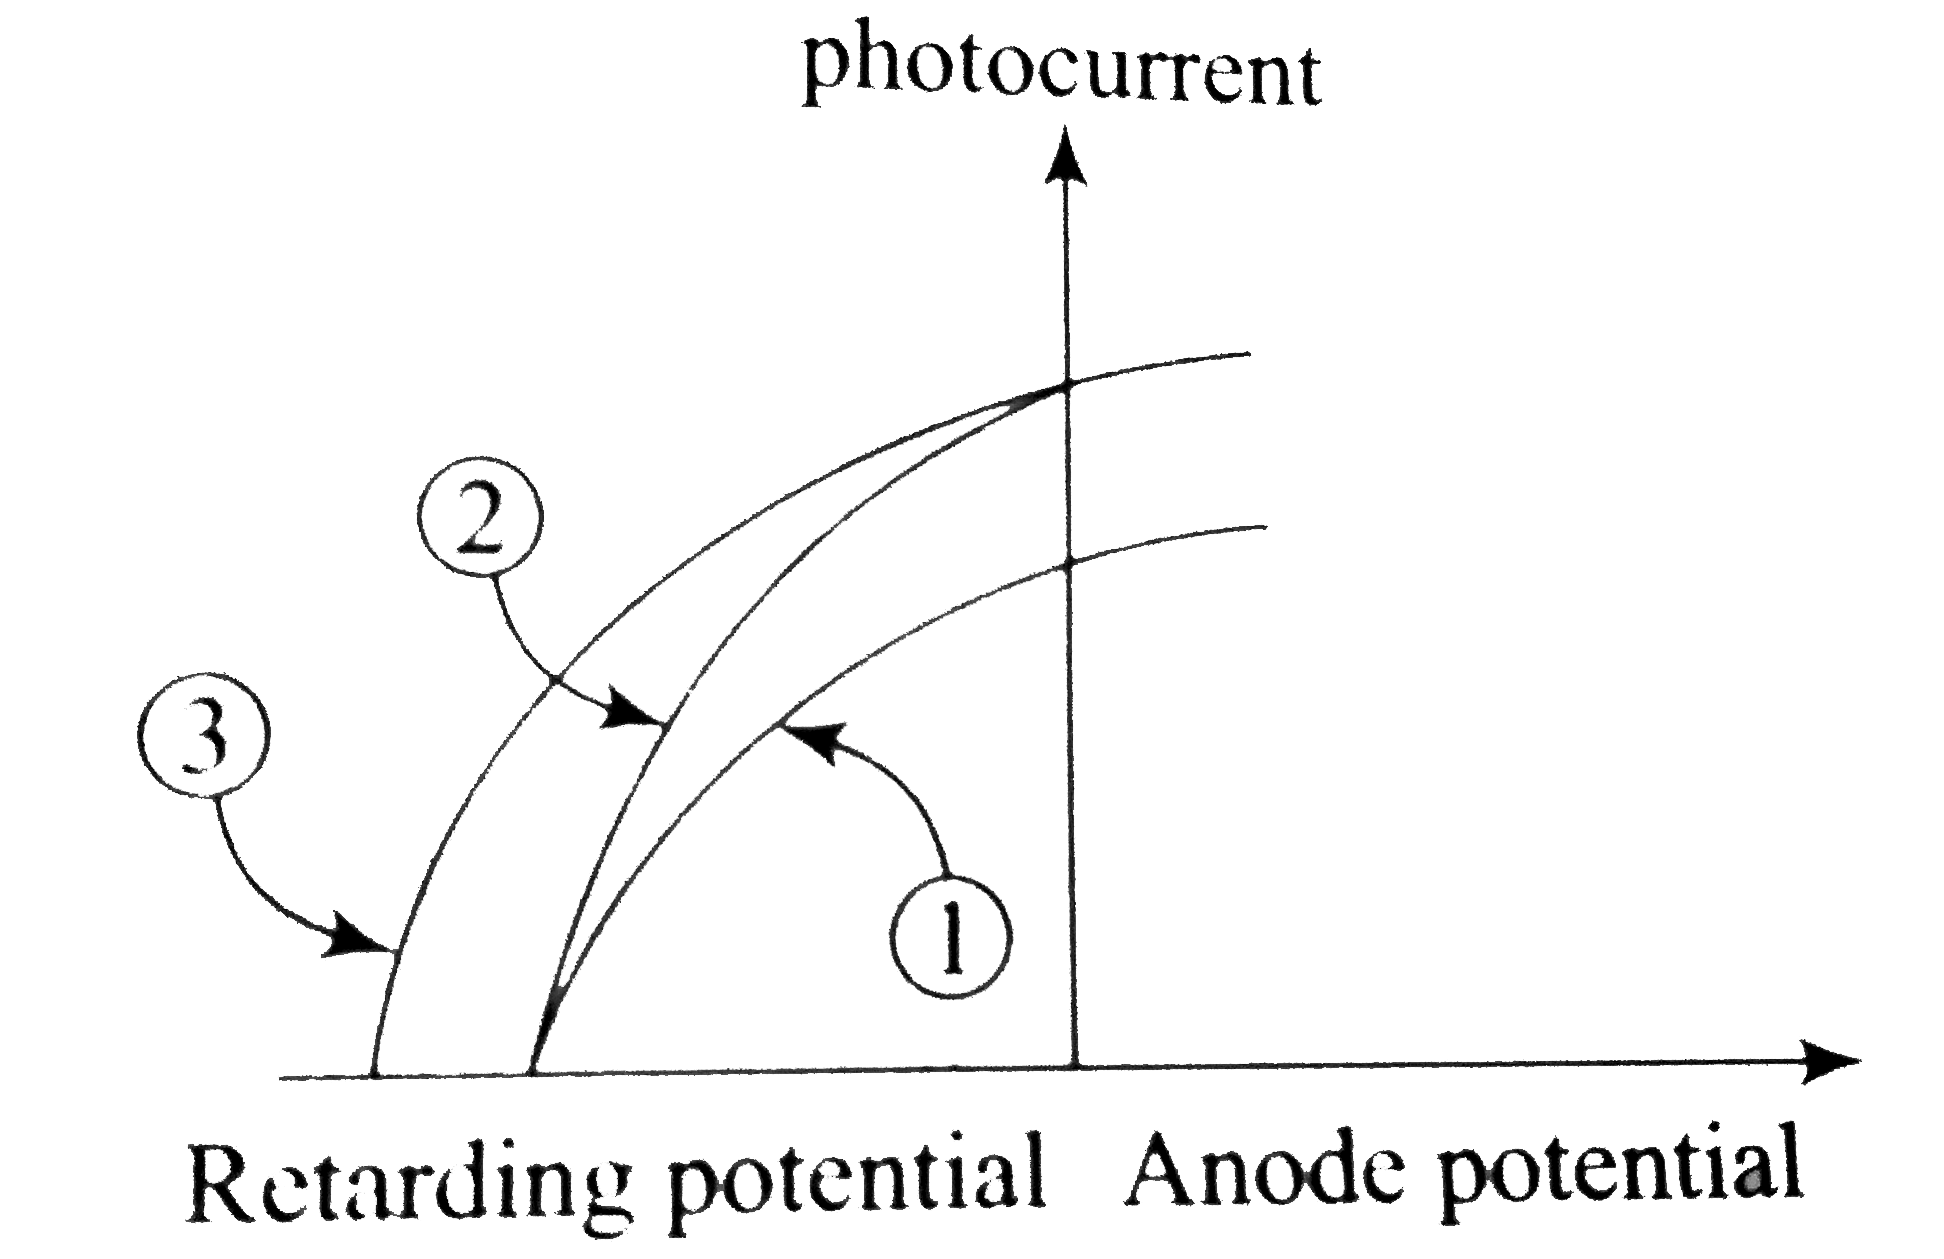
Curves a and b represent incident radiations of different frequencies and different intensities
curves a and b represent incident radiations of same frequency but of different intensities.
curves b and c represent incident radiations of different frequencies and different intensities.
Curves b and c represent incident radiations of same frequency having same intensity
The correct Answer is:B
Step by step video, text & image solution for The figure shows a plot of photo current versus anode potential for a photosensitive surface for three different radiations. Which one of the following is a correct statement ? by Physics experts to help you in doubts & scoring excellent marks in Class 12 exams.
Updated on:21/07/2023Topper's Solved these Questions
Similar Questions
Knowledge Check
The fig. shows the variation of photon current with anode potential for a photo-sensitive surface for three different radiation. Let Ia,IbandIc be the intensities and fa,fbandfc be the frequency for the curves a,b and c respectively.
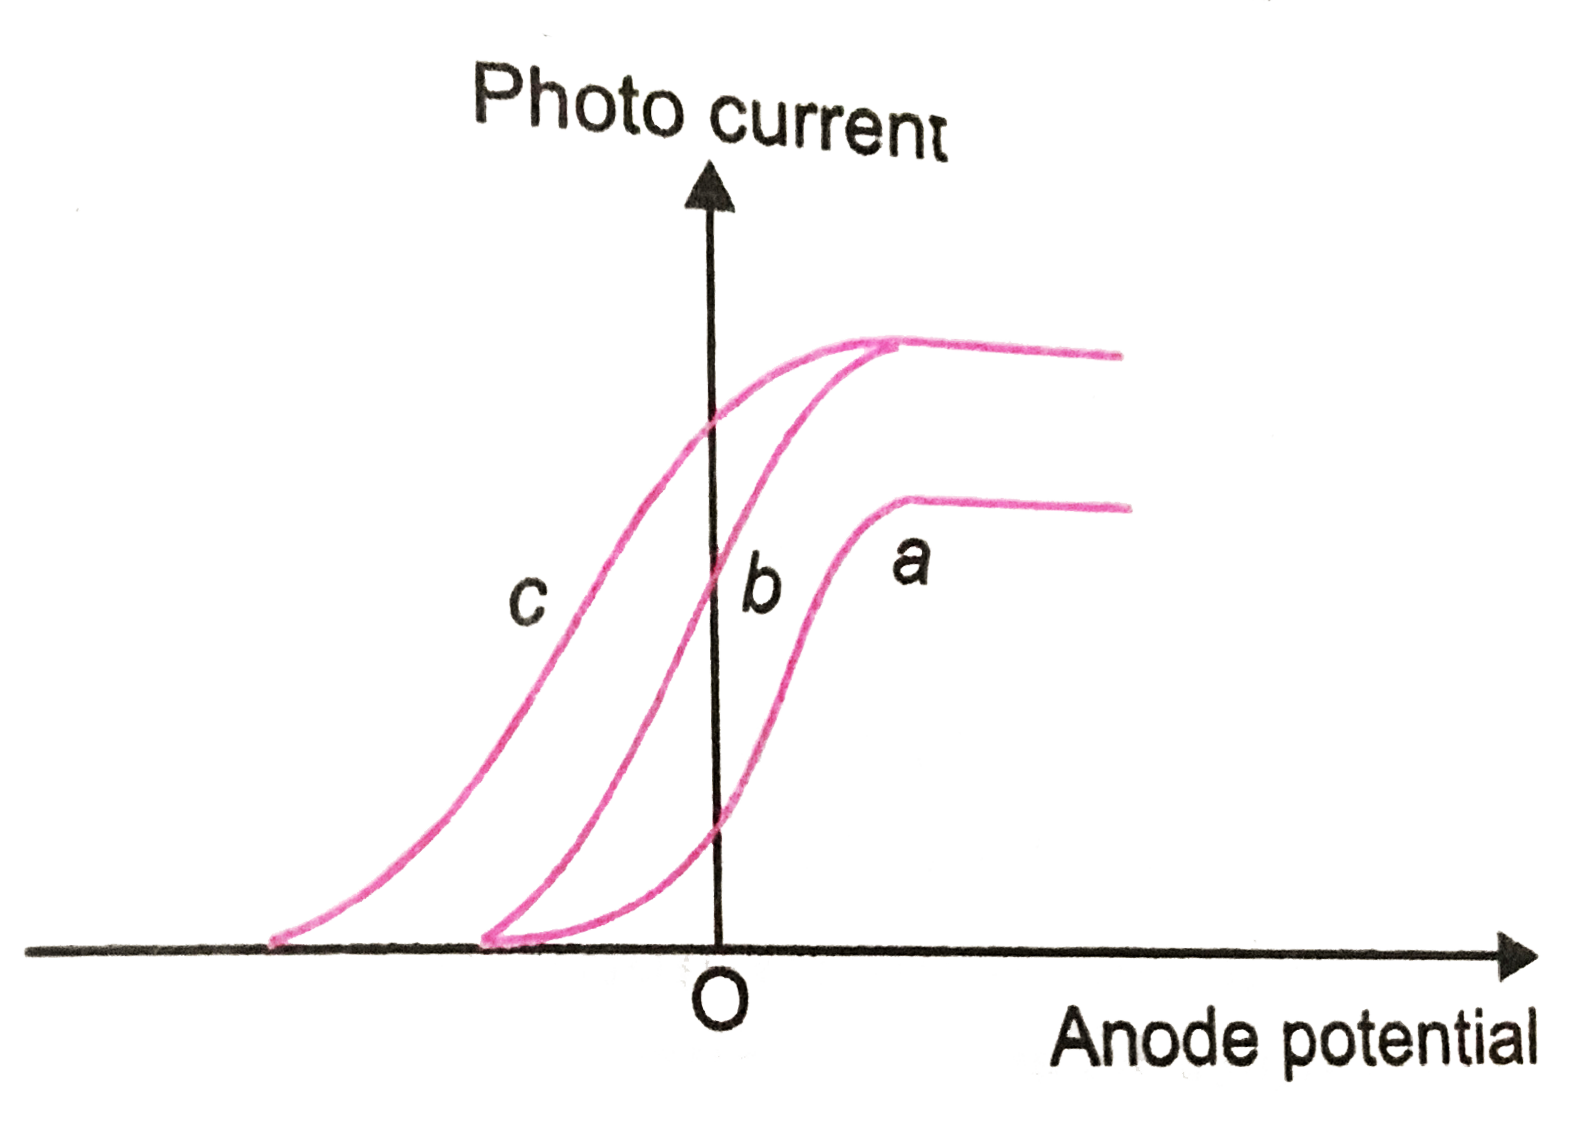 Afa=fbandIa≠IbBfa=fcandIa=IcCfa=fbandIa=IbDfb=fcandIb=Ic
In the following figure shows the variation of photocurrent with potential of the collector plate for a photosensitive surface for three different radiations. Let Ia,IbandIc be the intensities and fa,fbandfc be the frequencies for the curves a, b, and c, respectively.
 Afa=fbandIa=IbBfa=fcandIa=IcCfa=fbandIa<IbDfa=fcandIb=Ic
Which one of the show the statements is correct?
Abenign tumours show the property of metastasisBheroine accelerates body functionsCmalignant tumours may exhibit metastasisDpatients who have undergone surgery are give cannabinoids to relieve pain
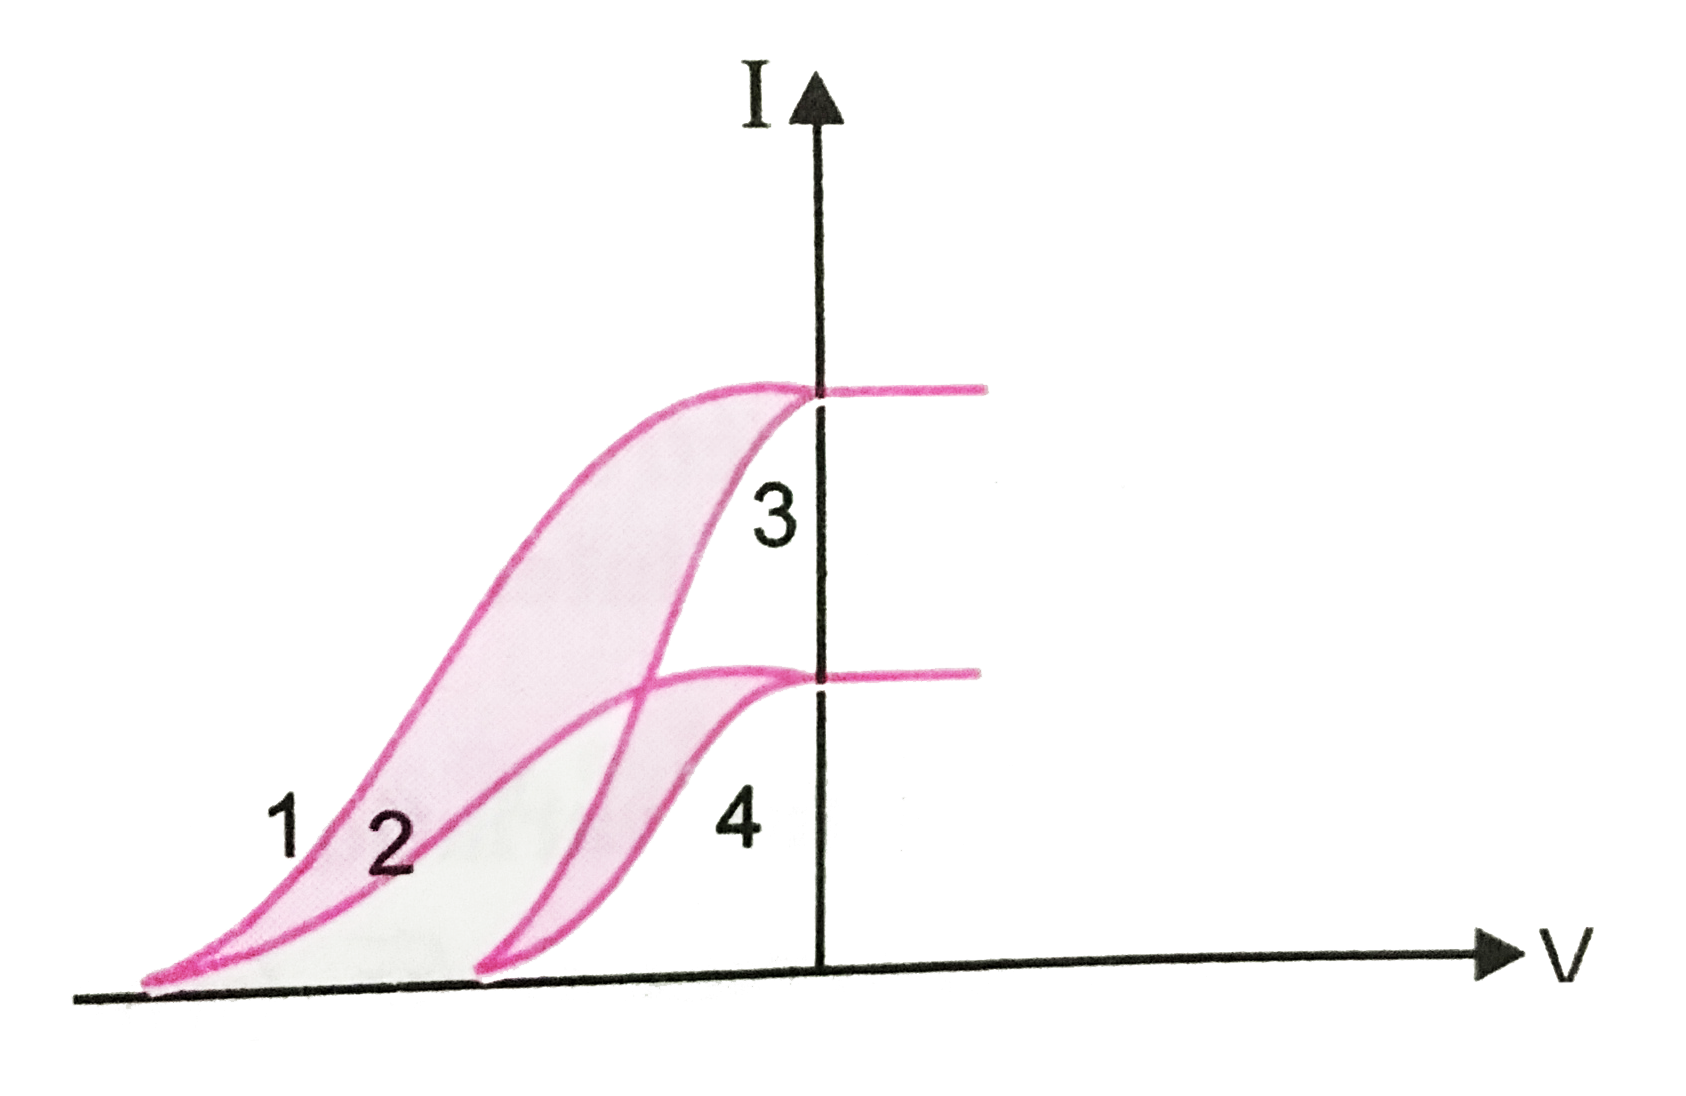
The graph of Fig. shows the variation of photoelectric current (I) versus applied voltage (V) for the two different photosensitive materials for two different intensities of the incident radiation. Identify the pairs of curves that correspond to different materials but same intensity of incident radiation.
View SolutionFor the first order reaction A→ Products, which one of the following is the correct plot of log[A] versus time?
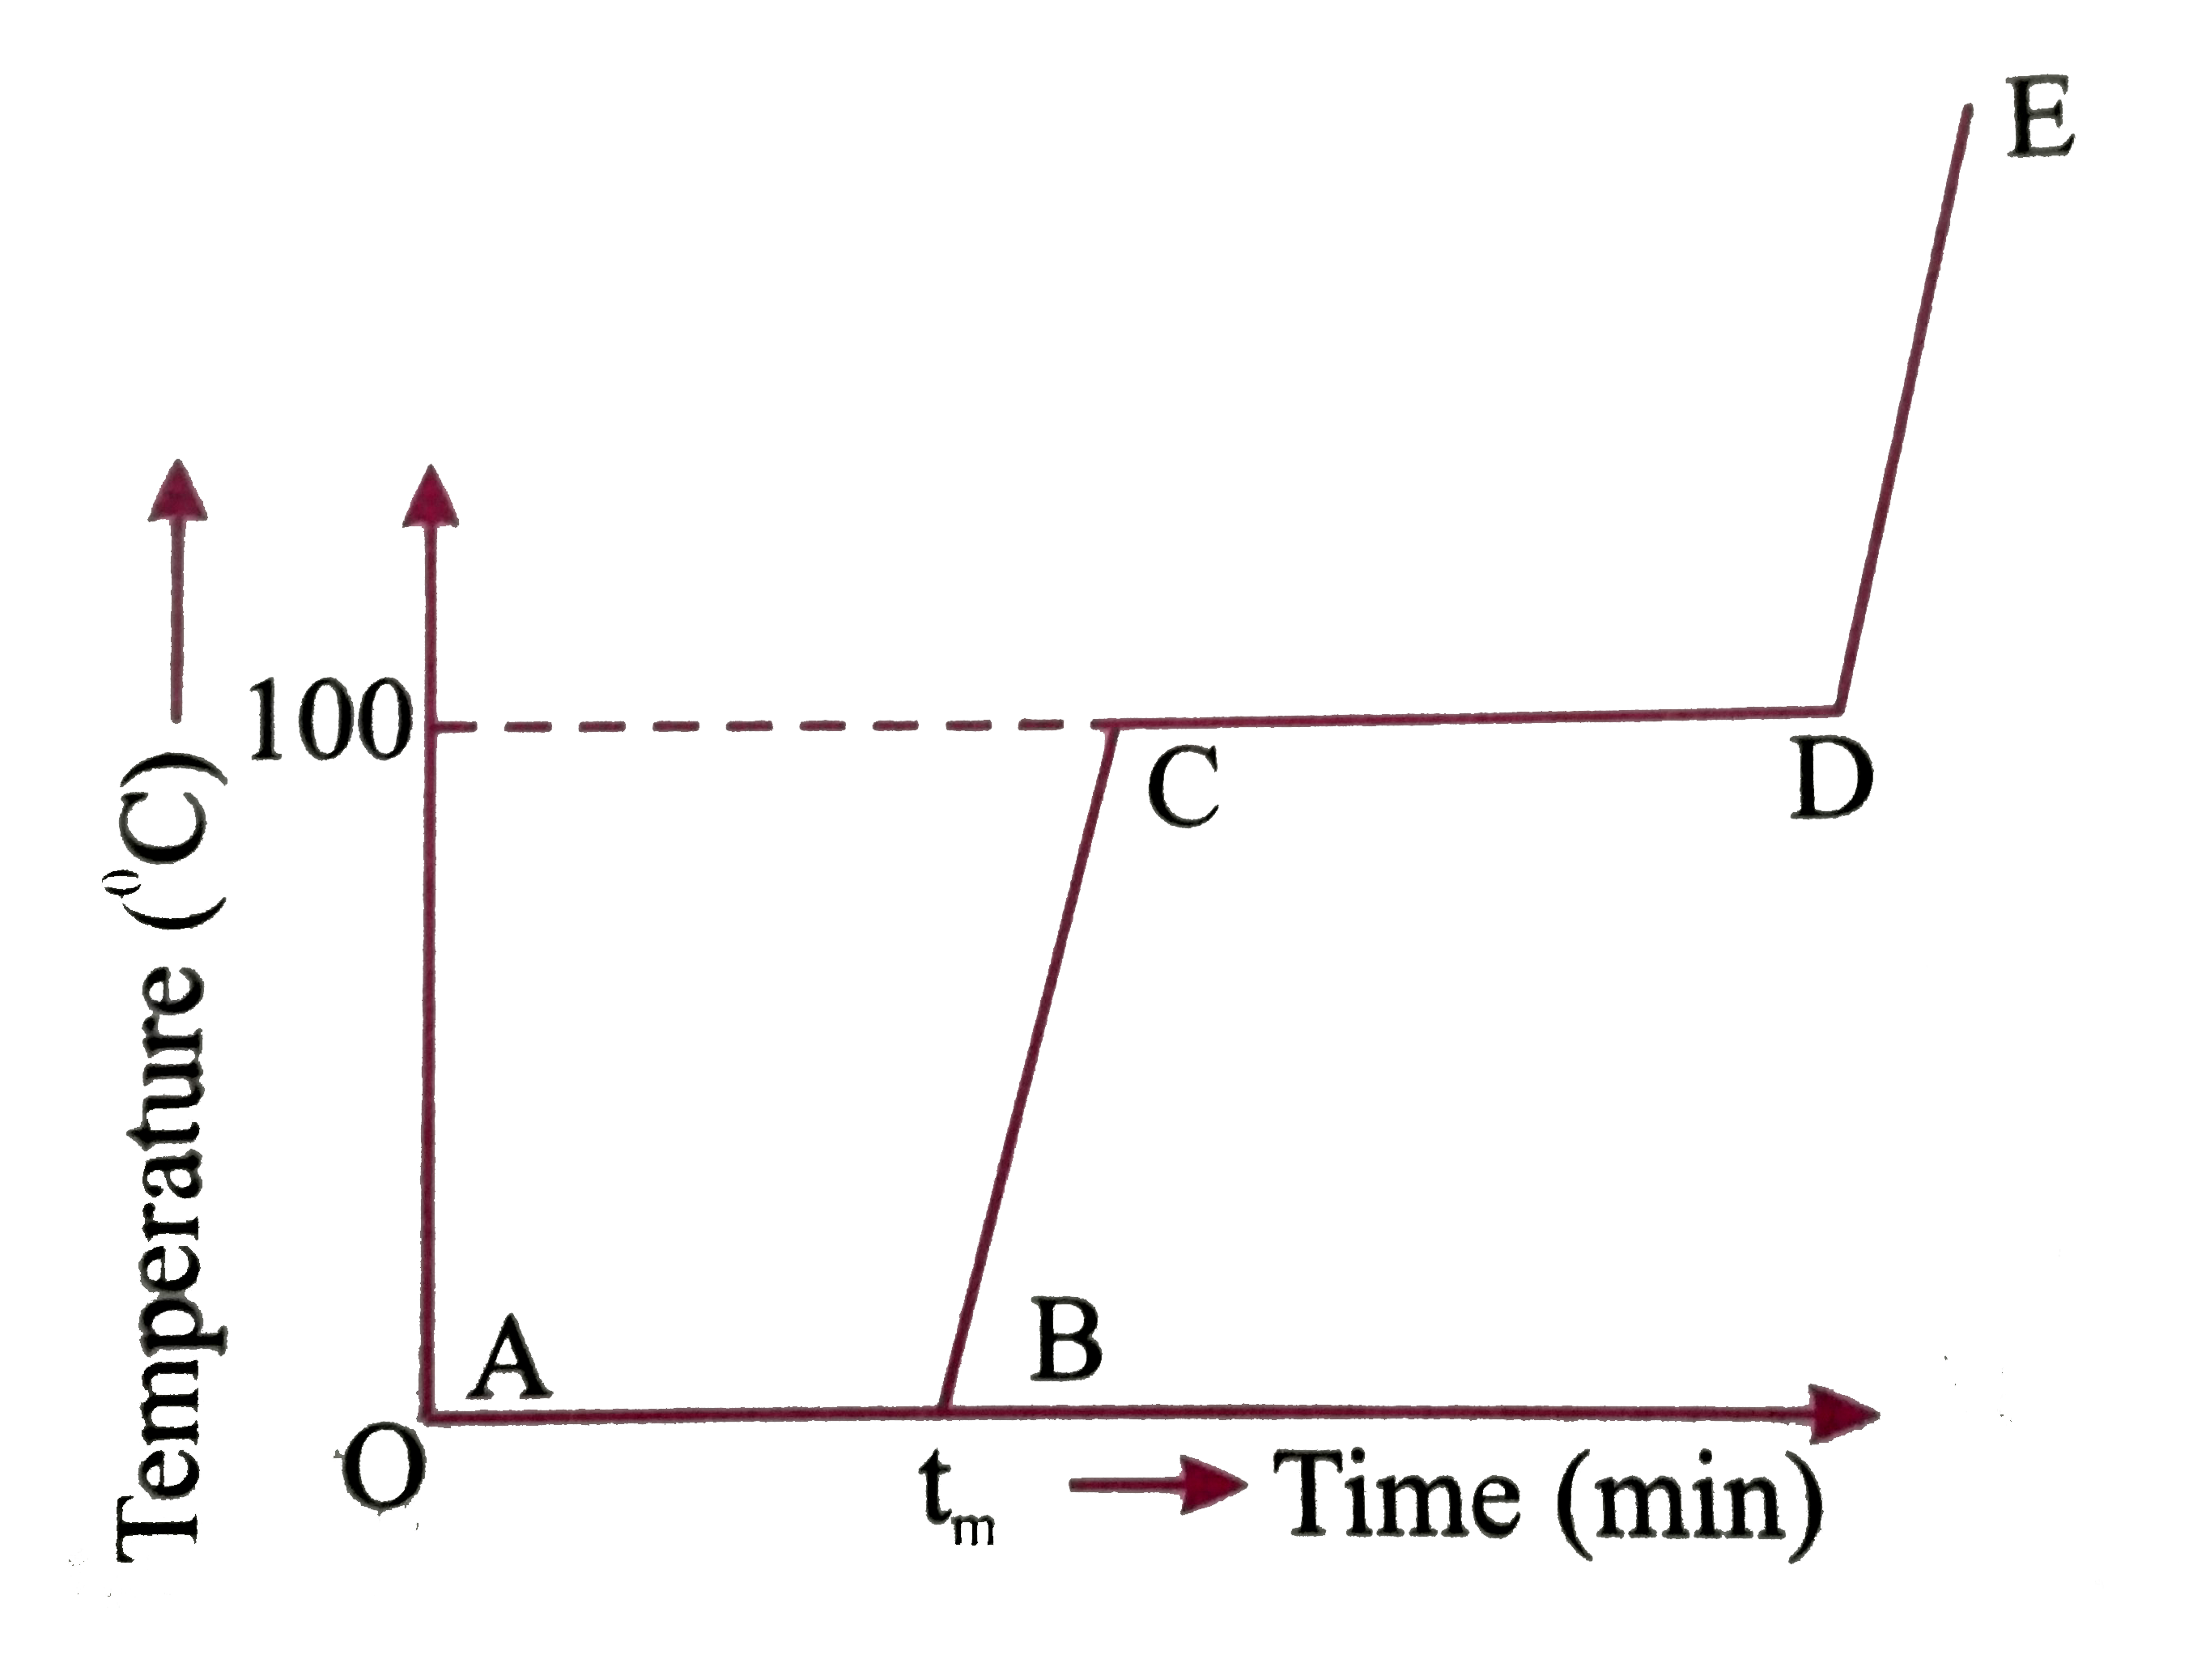
View SolutionRefer to the plot of temperature versus time (figure) showing the changes in the state if ice on heating (not to scale). Which of the following is correct ?
 .
.
View SolutionRefer to the plot of temperature versus time showing the changes in the state of ice on heating (not to scale).
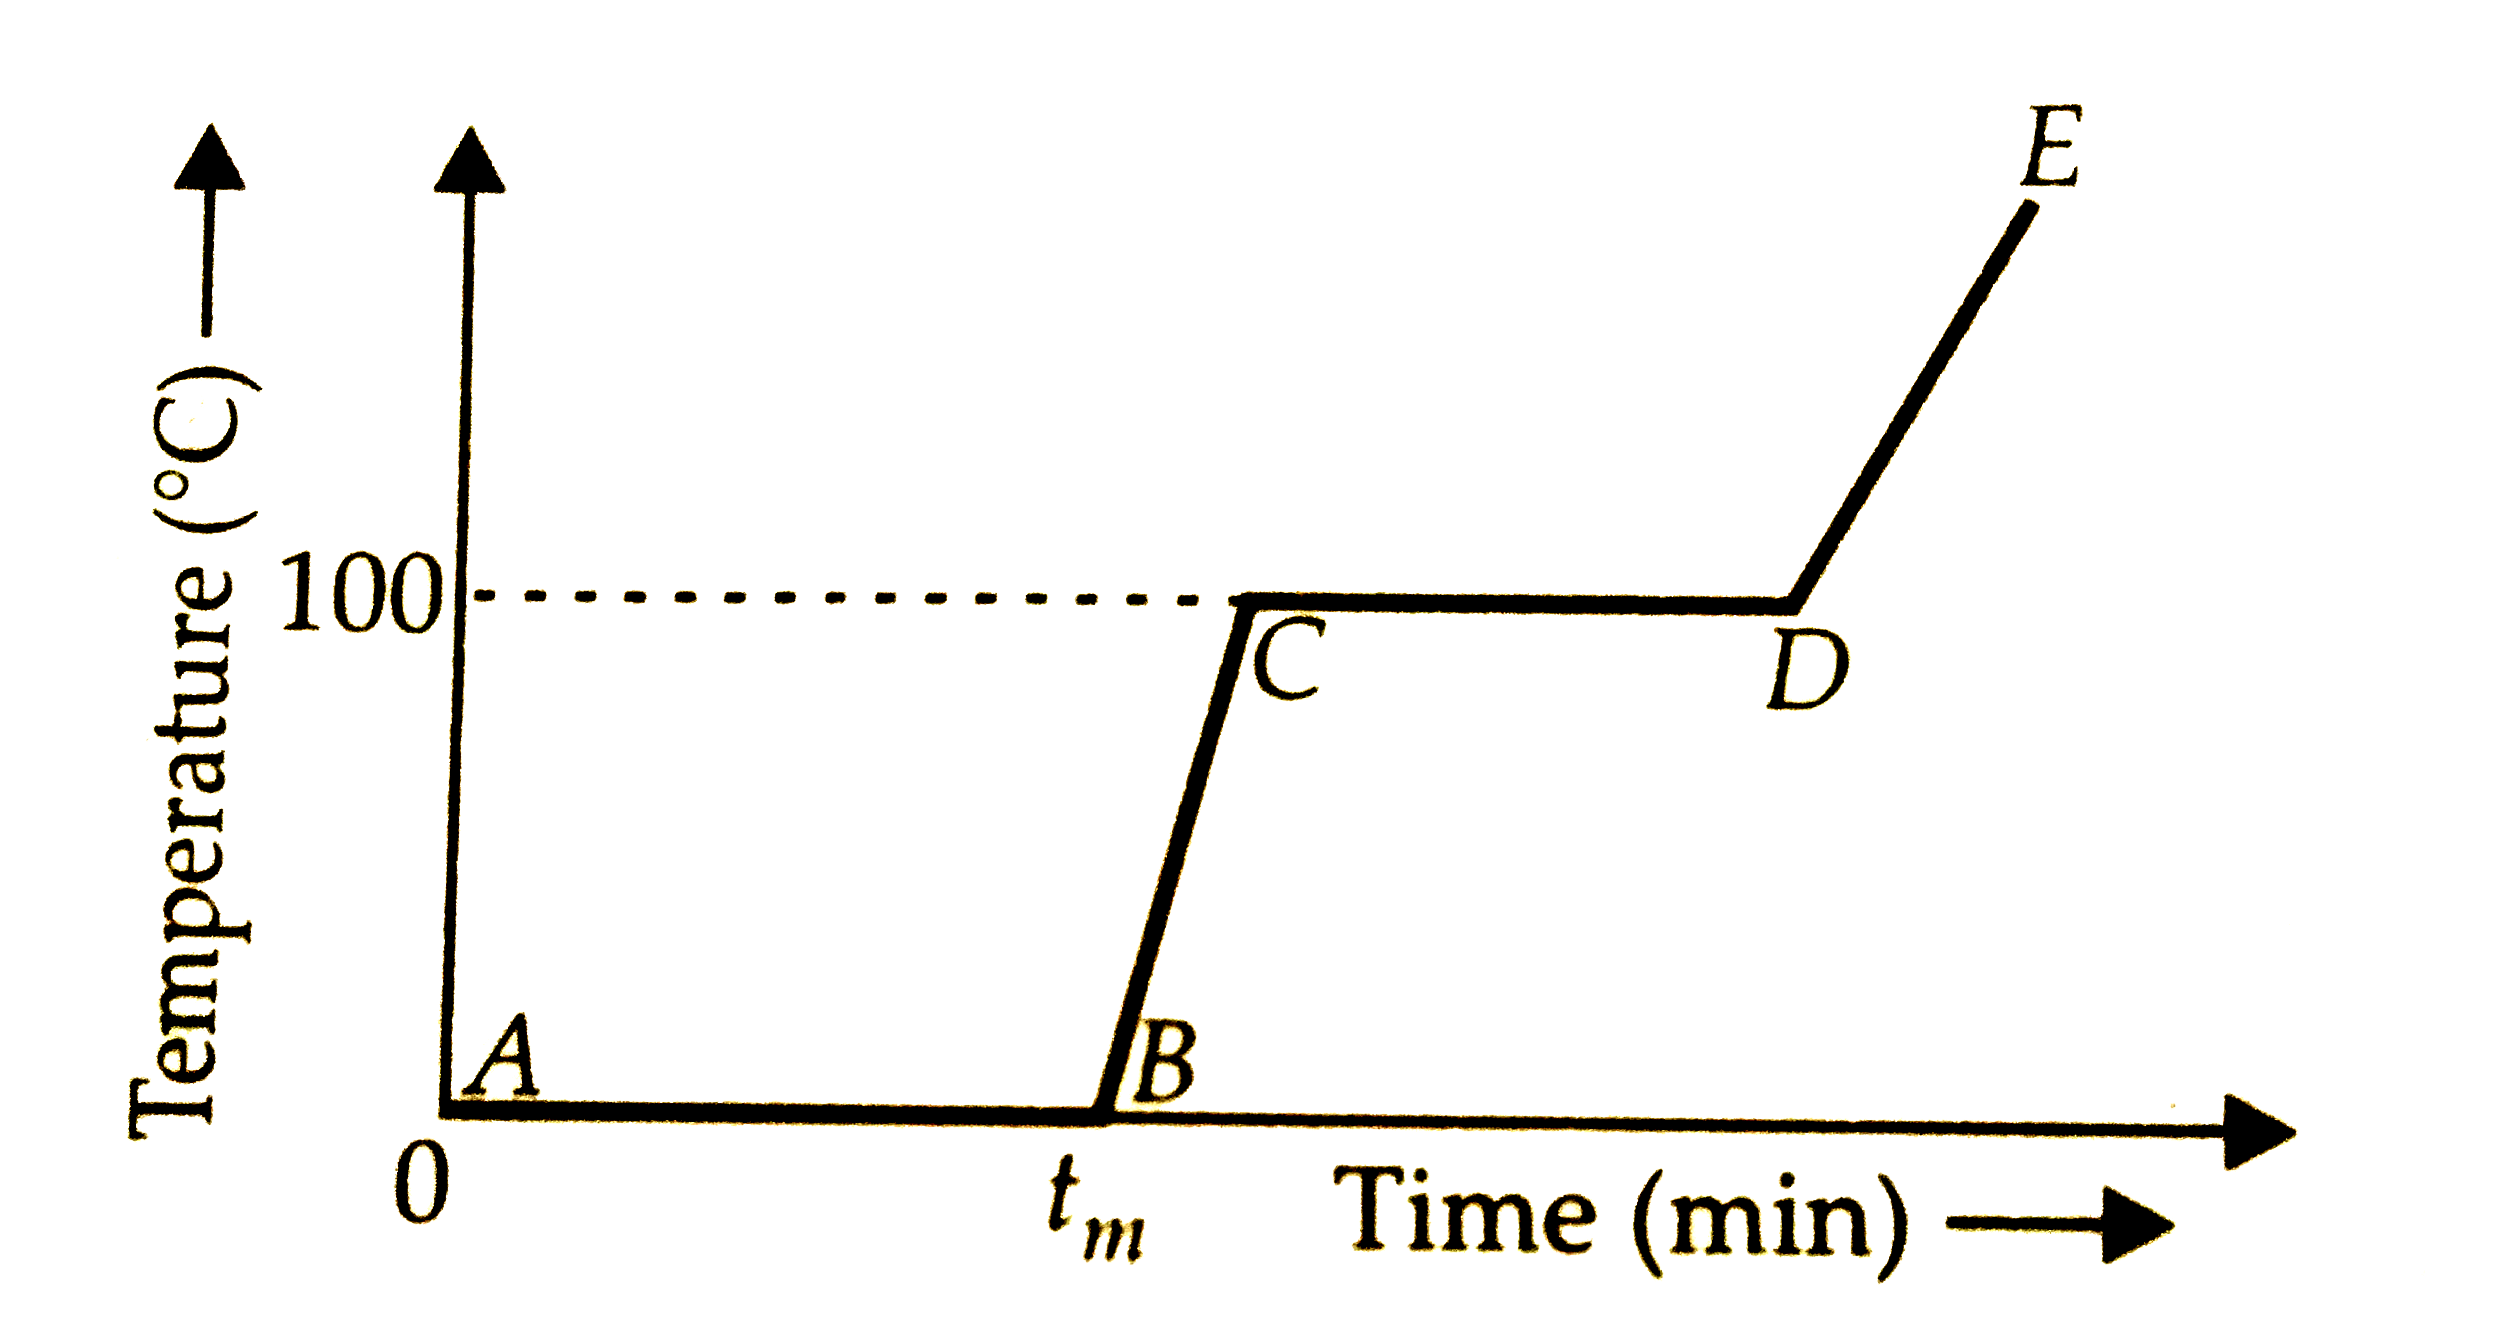
Which of the following is correct ?
View SolutionRefer to the plot of temperature versus time, showing the changes in the state of ice on heating (not to scale).
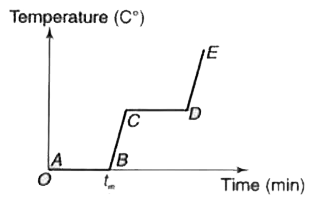
which of the following is correct ?
View Solution

