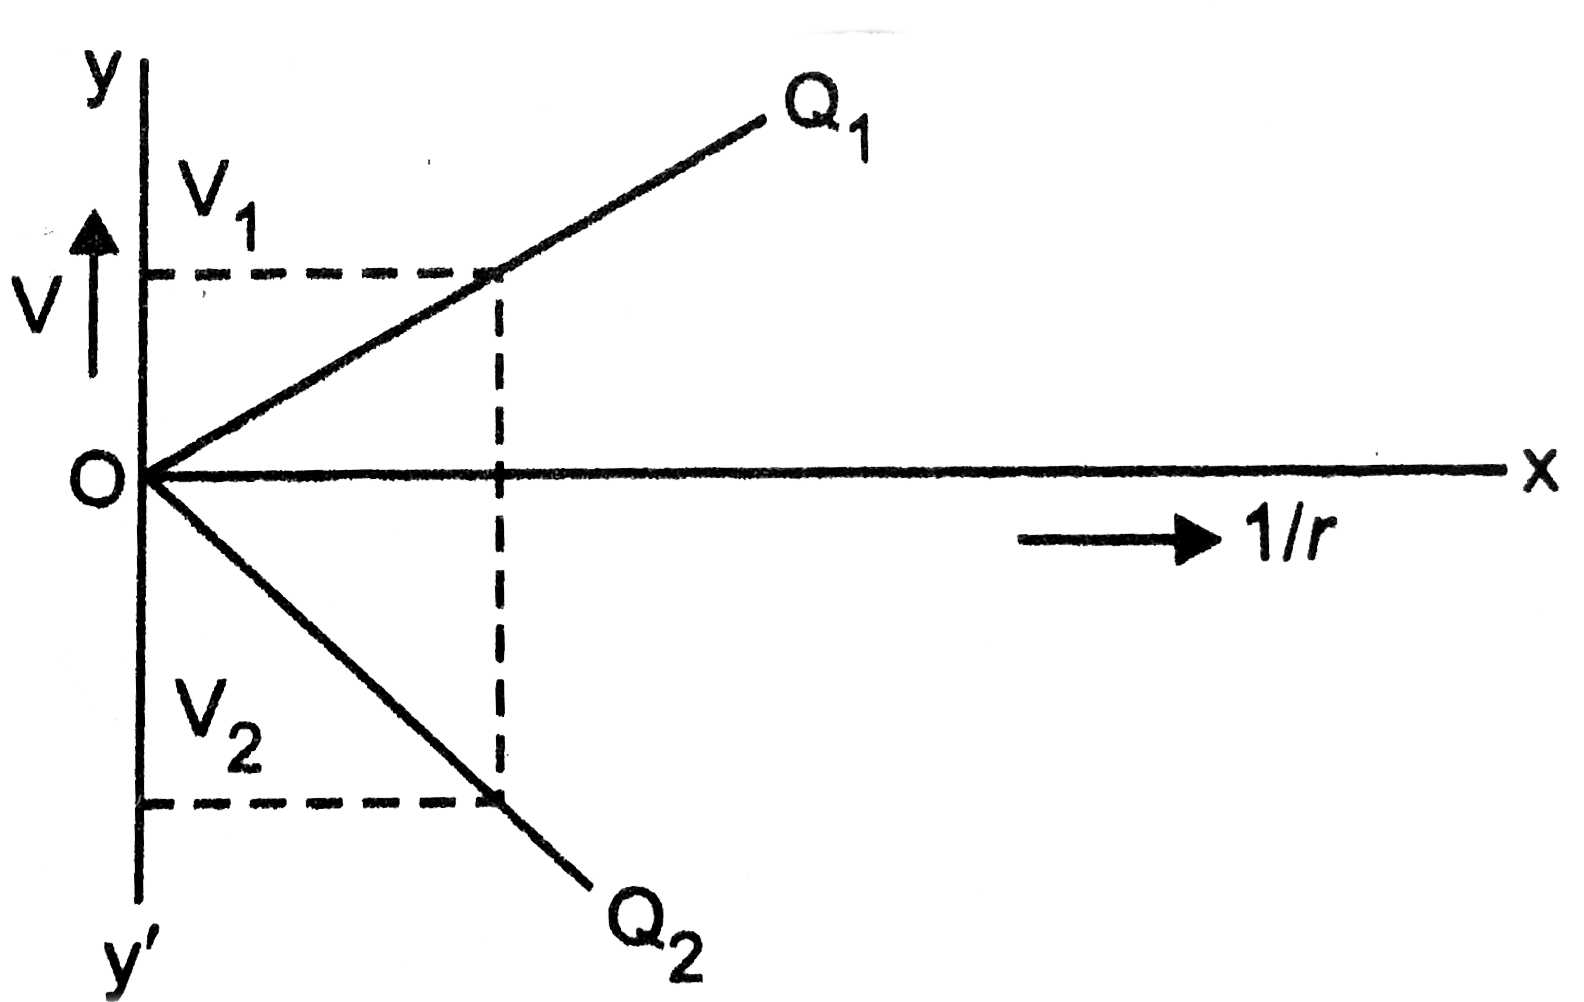
Fig. shows the variation of electric potential V with 1r for two charge Q1andQ2 (where r is the distance from a point charge).

(ii) Which of the two charges is greater in magnitude ? Justify.
Since V2>V1, so charge Q2 is greater in magnitude as compared to charge Q1.
Topper's Solved these Questions
- ELECTRIC POTENTIAL BOOK - CHHAYA PUBLICATIONCHAPTER - ELECTRIC POTENTIAL EXERCISE - NCERT textbook questions with answer hint
14 Videos
- ELECTRIC POTENTIAL BOOK - CHHAYA PUBLICATIONCHAPTER - ELECTRIC POTENTIAL EXERCISE - NCERT examplar questions with answer hint (MCQ -1 single option correct)
3 Videos
- ELECTRIC POTENTIAL BOOK - CHHAYA PUBLICATIONCHAPTER - ELECTRIC POTENTIAL EXERCISE - Section related questions
25 Videos
- ELECTRIC FIELDBOOK - CHHAYA PUBLICATIONCHAPTER - ELECTRIC FIELDEXERCISE - CBSE SCANNER
31 Videos
- ELECTROMAGNETIC INDUCTION & ALTERNATING CURRENTBOOK - CHHAYA PUBLICATIONCHAPTER - ELECTROMAGNETIC INDUCTION & ALTERNATING CURRENTEXERCISE - CBSE SCANNER
28 Videos
Similar Questions
Fig.1 shows the variation of electric potential V with 1/r, where r is the distance from the two charges Q1andQ2. Determine

(i) signs of two charges Q1andQ2
(ii) Which of the two charges has a larger magnitude ? Justify.
View SolutionPotential energy of a system of charges q1 and q2 which are separated by a distance r is ?
View SolutionDraw a plot showing the variation of (i) electric field (E ) and (ii) electric potential (V) with distance r due to a point charge Q.
View SolutionDraw a plot showing the variation of (i) electric field E, and (ii) electric potential V with distance 'r' due to a point charge Q.
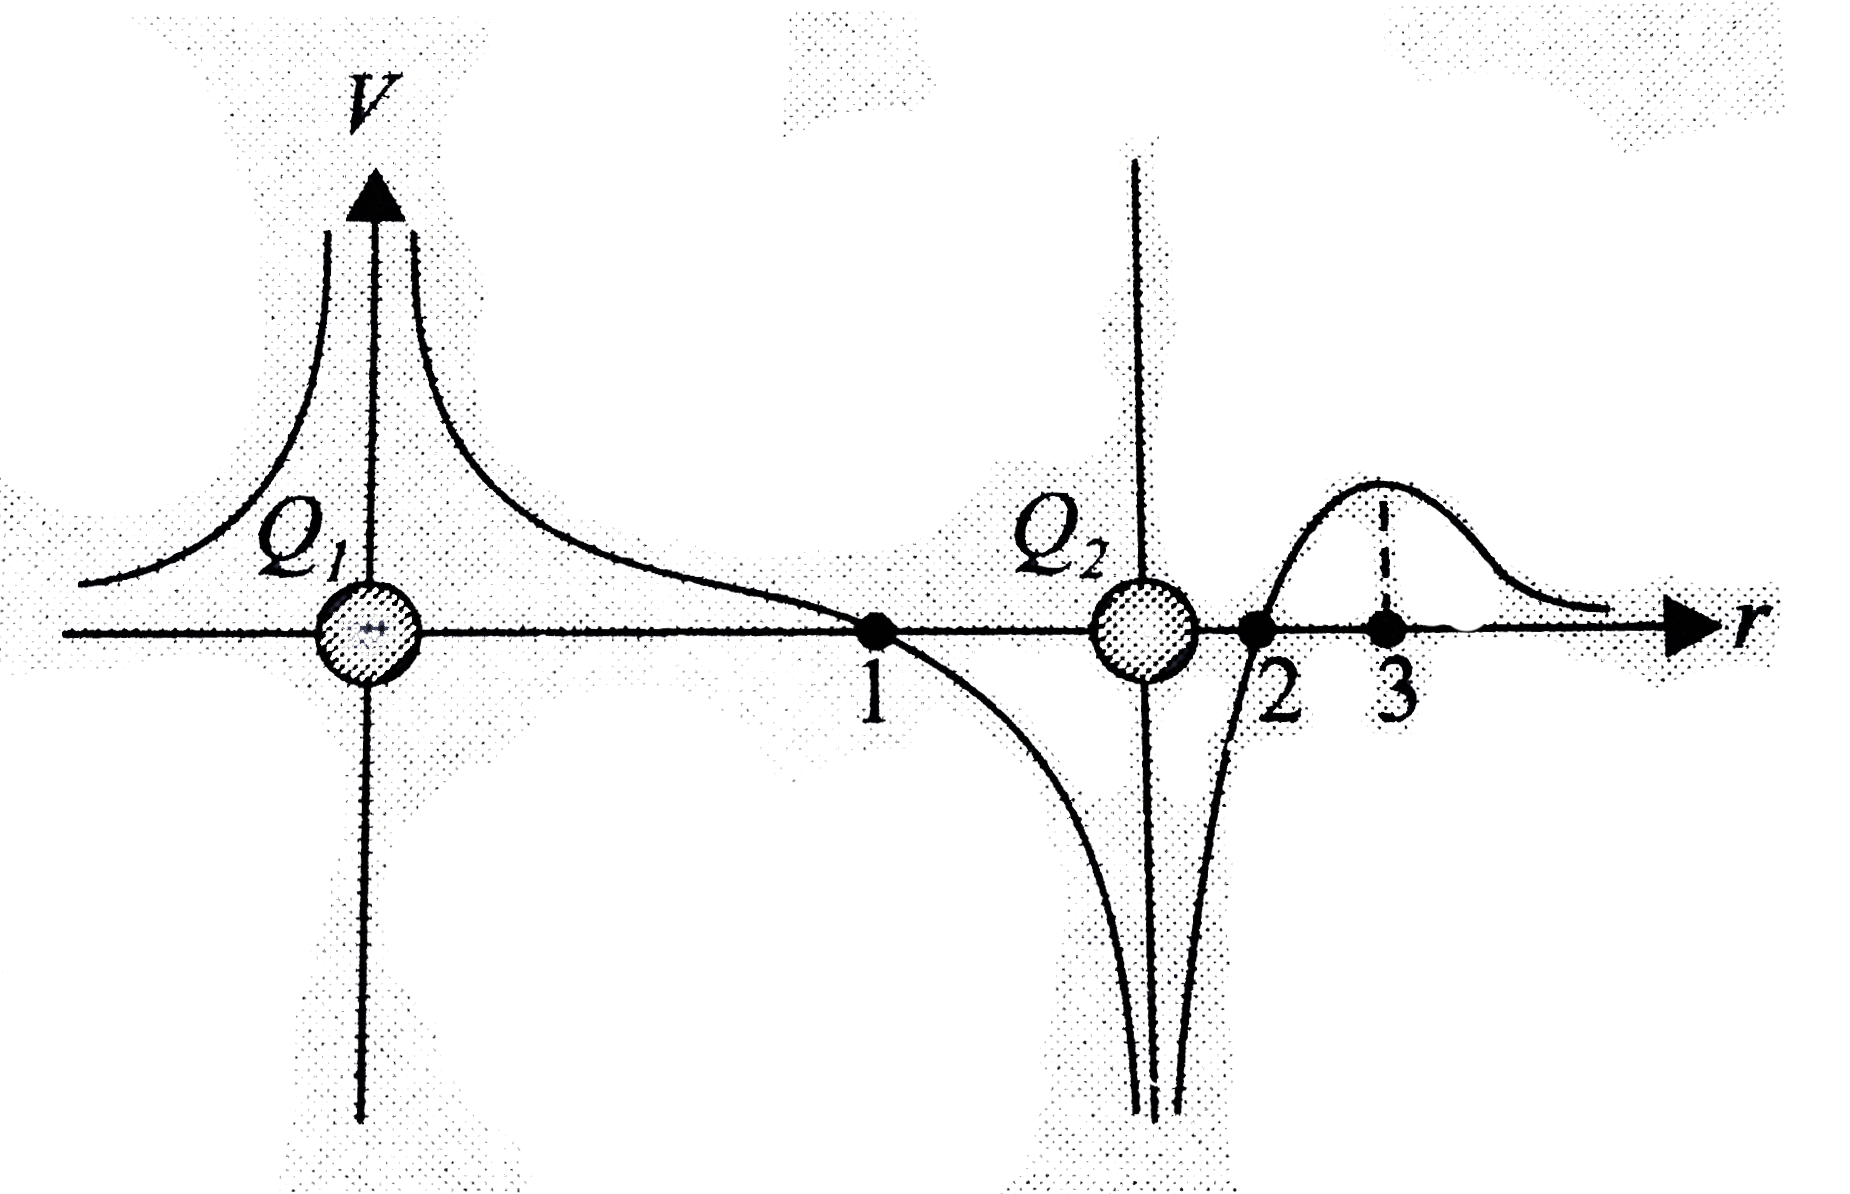
View SolutionTwo point charges Q1 and Q2 lie along a line at a distance from each other. Figure 3.7 shows the potential variation along the line of charges. At which of the points 1, 2, and 3 is the electric field zero ? What are the singns of the charges Q1 and Q2 and which of the two charges is greater in magnitude ?
 .
.
View SolutionTwo point charges Q1 and Q2 lie along a line at a distance from each other. Figure 3.7 shows the potential variation along the line of charges. At which of the points 1, 2, and 3 is the electric field zero ? What are the singns of the charges Q1 and Q2 and which of the two charges is greater in magnitude ?
 .
.
View SolutionThe following curve represents the variation of potential of points along x-axis due to two-point charges q1 and q2 separated by a distance 2 a. Find the ratio of magnitude of two charges (point 0 is origin and coordinates of point P is(a/3,0))
View SolutionTwo point charges, Q1andQ2 are positioned at a certain distance from each other. Tho curves in the figure represent the distri bution of the potential along the straight line connecting the two charges. At which points (1,2,andor3) is the electric field strength zero? What are tho signes of the charges Q1andQ2 and which of the two is greater in magnitude?
View SolutionShow that electric potential at a point P, at a distance .r. from a fixed point charge Q, is given by :
V=(14πε0)Qr
View SolutionPlot a graph comparing the variation of potential ‘V’ and electric field ‘E’ due to a point charge ‘Q’ as a function of distance r from point charge
(ii) Find the ratio of the potential differences that must be applied across the parallel and the series combination of two identical capacitors so that the energy stored, in the two cases, becomes the same.
View Solution
