The given graphs show the variation of photoelectric current (I) with the applied voltage (V) when light of different instensities is incident on surfaces of different materials. Identify the pairs of curves that correspond to different materials but same intensity of incident radiations.
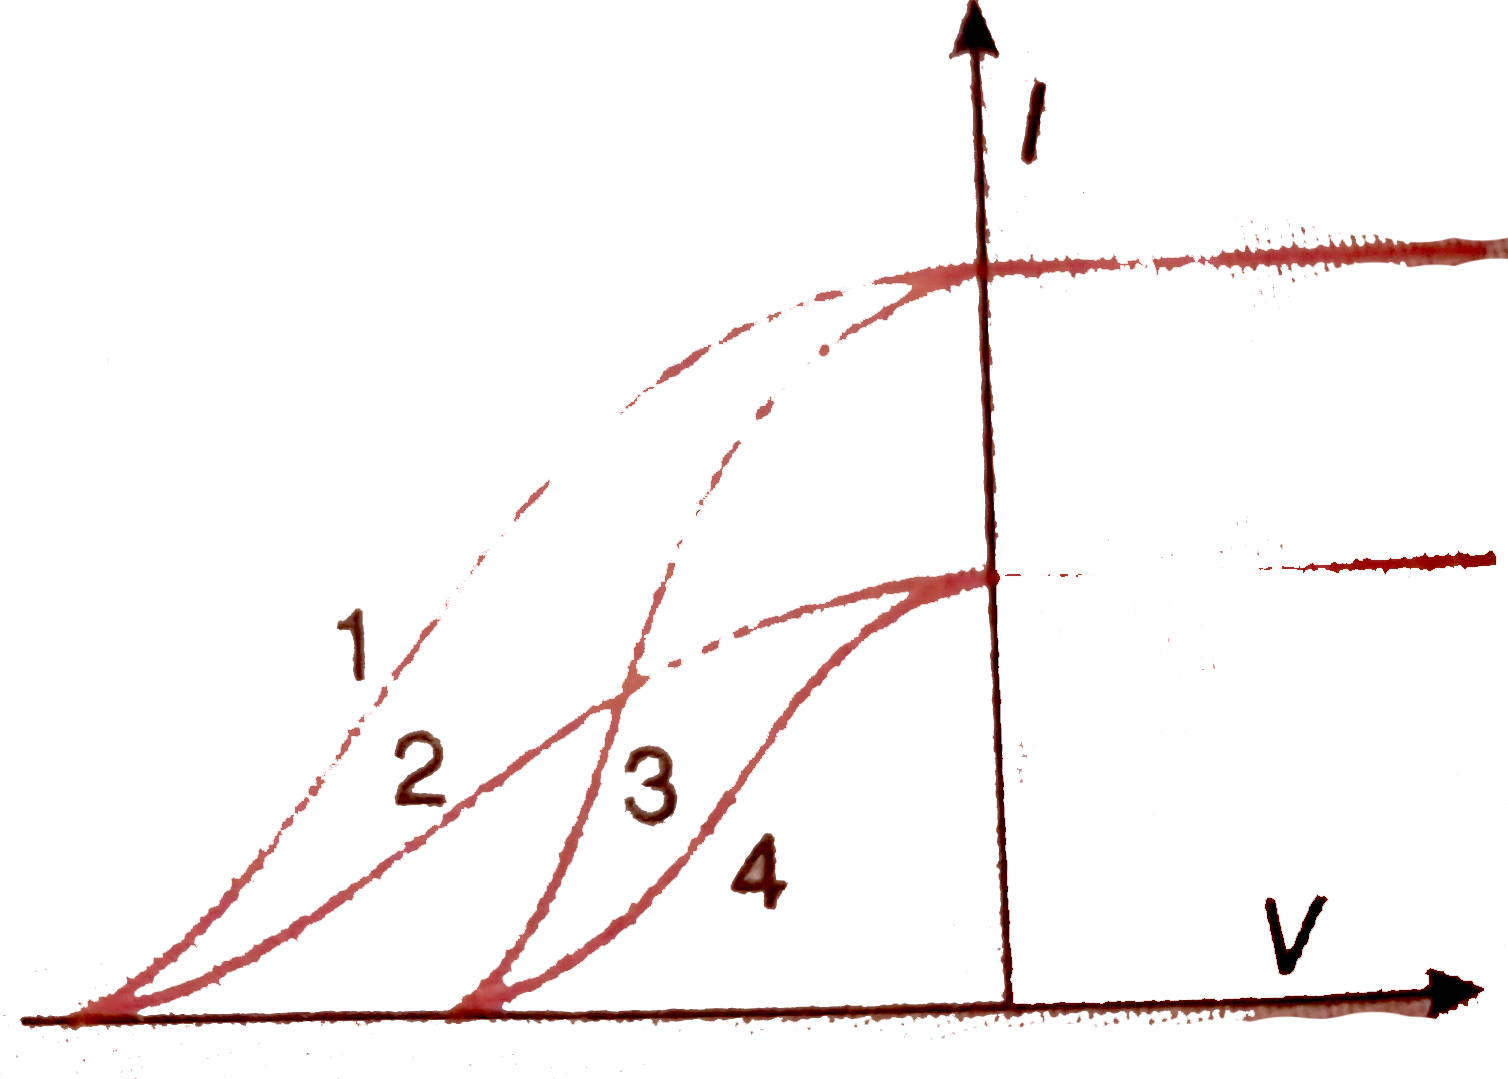
Stopping potential depends on the materia of the photocathode, but is independent of the intensity of the incident radiation. So the pairs (1,3) and (2,4) correspond to different materials but the same intensity of incident radiation.
Topper's Solved these Questions
- QUANTUM THEORYBOOK - CHHAYA PUBLICATIONCHAPTER - QUANTUM THEORYEXERCISE - NCERT Textbook Questions with Answer Hint
19 Videos
- QUANTUM THEORYBOOK - CHHAYA PUBLICATIONCHAPTER - QUANTUM THEORYEXERCISE - NCERT Exemplar Questions with Answer HINT
8 Videos
- QUANTUM THEORYBOOK - CHHAYA PUBLICATIONCHAPTER - QUANTUM THEORYEXERCISE - Section Related Question
18 Videos
- OPTICAL INSTRUMENTSBOOK - CHHAYA PUBLICATIONCHAPTER - OPTICAL INSTRUMENTSEXERCISE - CBSE SCANNER
8 Videos
- QUESTION PAPER OF NEET 2017BOOK - CHHAYA PUBLICATIONCHAPTER - QUESTION PAPER OF NEET 2017EXERCISE - QUESTION PAPERS OF (NEET) (2017)
39 Videos
Similar Questions
The graph of Fig. shows the variation of photoelectric current (I) versus applied voltage (V) for the two different photosensitive materials for two different intensities of the incident radiation. Identify the pairs of curves that correspond to different materials but same intensity of incident radiation.
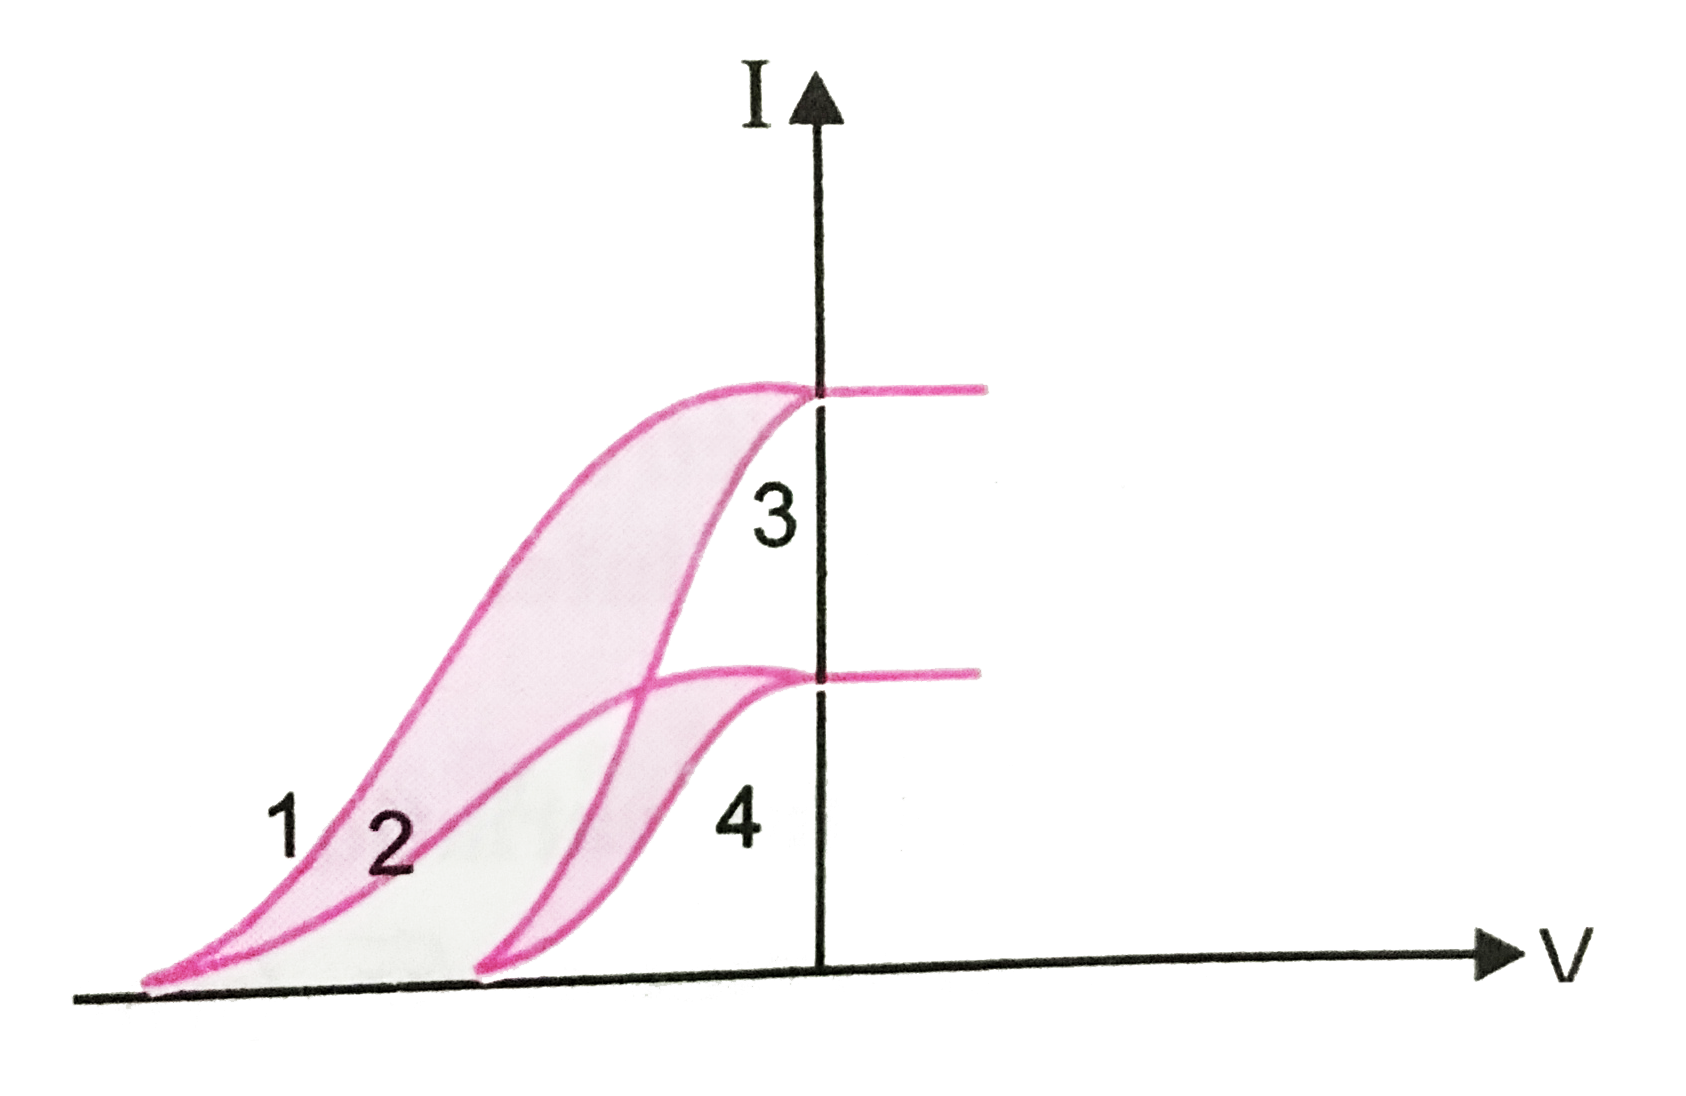
View SolutionThe graph of Fig. shows the variation of photoelectric current (I) versus applied voltage (V) for the two different photosensitive materials for two different intensities of the incident radiation. Identify the pairs of curves that correspond to different materials but same intensity of incident radiation.

View Solution
Knowledge Check
Which one of the following graphs in figure shows the variation of photoelectric current (I) with voltage (V) between the electrodes in a photoelectric cell?
A B
B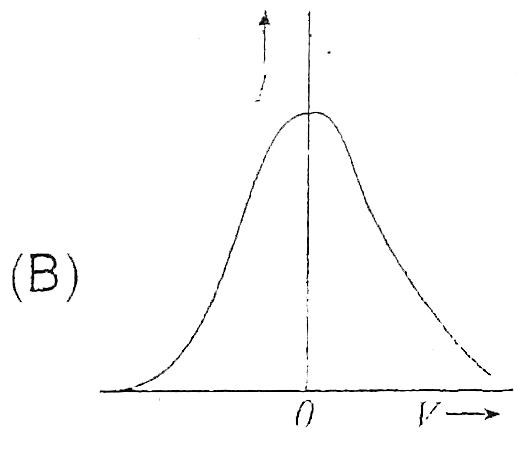 C
C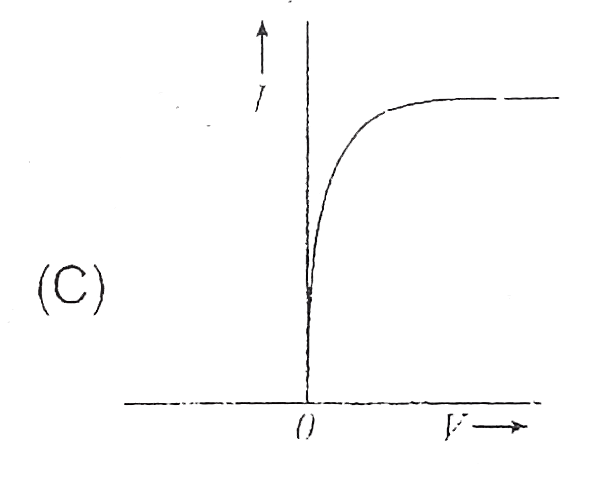 D
D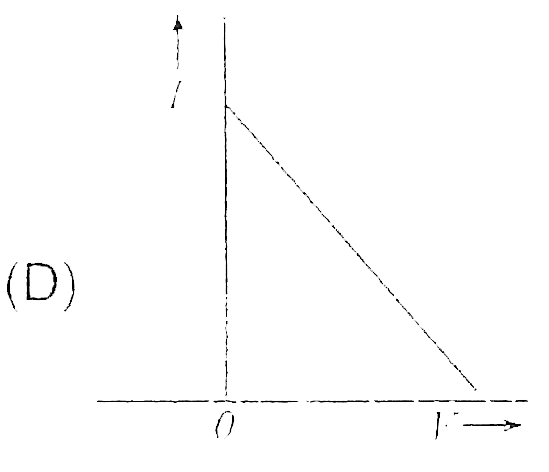
Plot a graph showing the variation of photoelectric current with anode potential for two light beam of same wavelength but different intensity.
View SolutionDraw graphs showing variation of photoelectric current with applied voltage for three incident radiations of equal frequency and different intensities. Mark the graph for the radiation of higher intensity.
View SolutionDarw graphs showing variation of photoelctric current with applied voltage for two incident radiations of equal frequecny and different intensities. Mark the graph for the radiaiton of higher intensity.
View SolutionDarw graphs showing variation of photoelctric current with applied voltage for two incident radiations of equal frequecny and different intensities. Mark the graph for the radiaiton of higher intensity.
View SolutionDarw graphs showing variation of photoelctric current with applied voltage for two incident radiations of equal frequecny and different intensities. Mark the graph for the radiaiton of higher intensity.
View SolutionDraw a plot showing the variation of photoelectric current versus the intensity of incident radiation on a given photosenstive surface.
View SolutionWhich one of the following graphs in figure shows the variation of photoelectric current (I) with voltage (V) between the electrodes in a photoelectric cell?
View Solution
