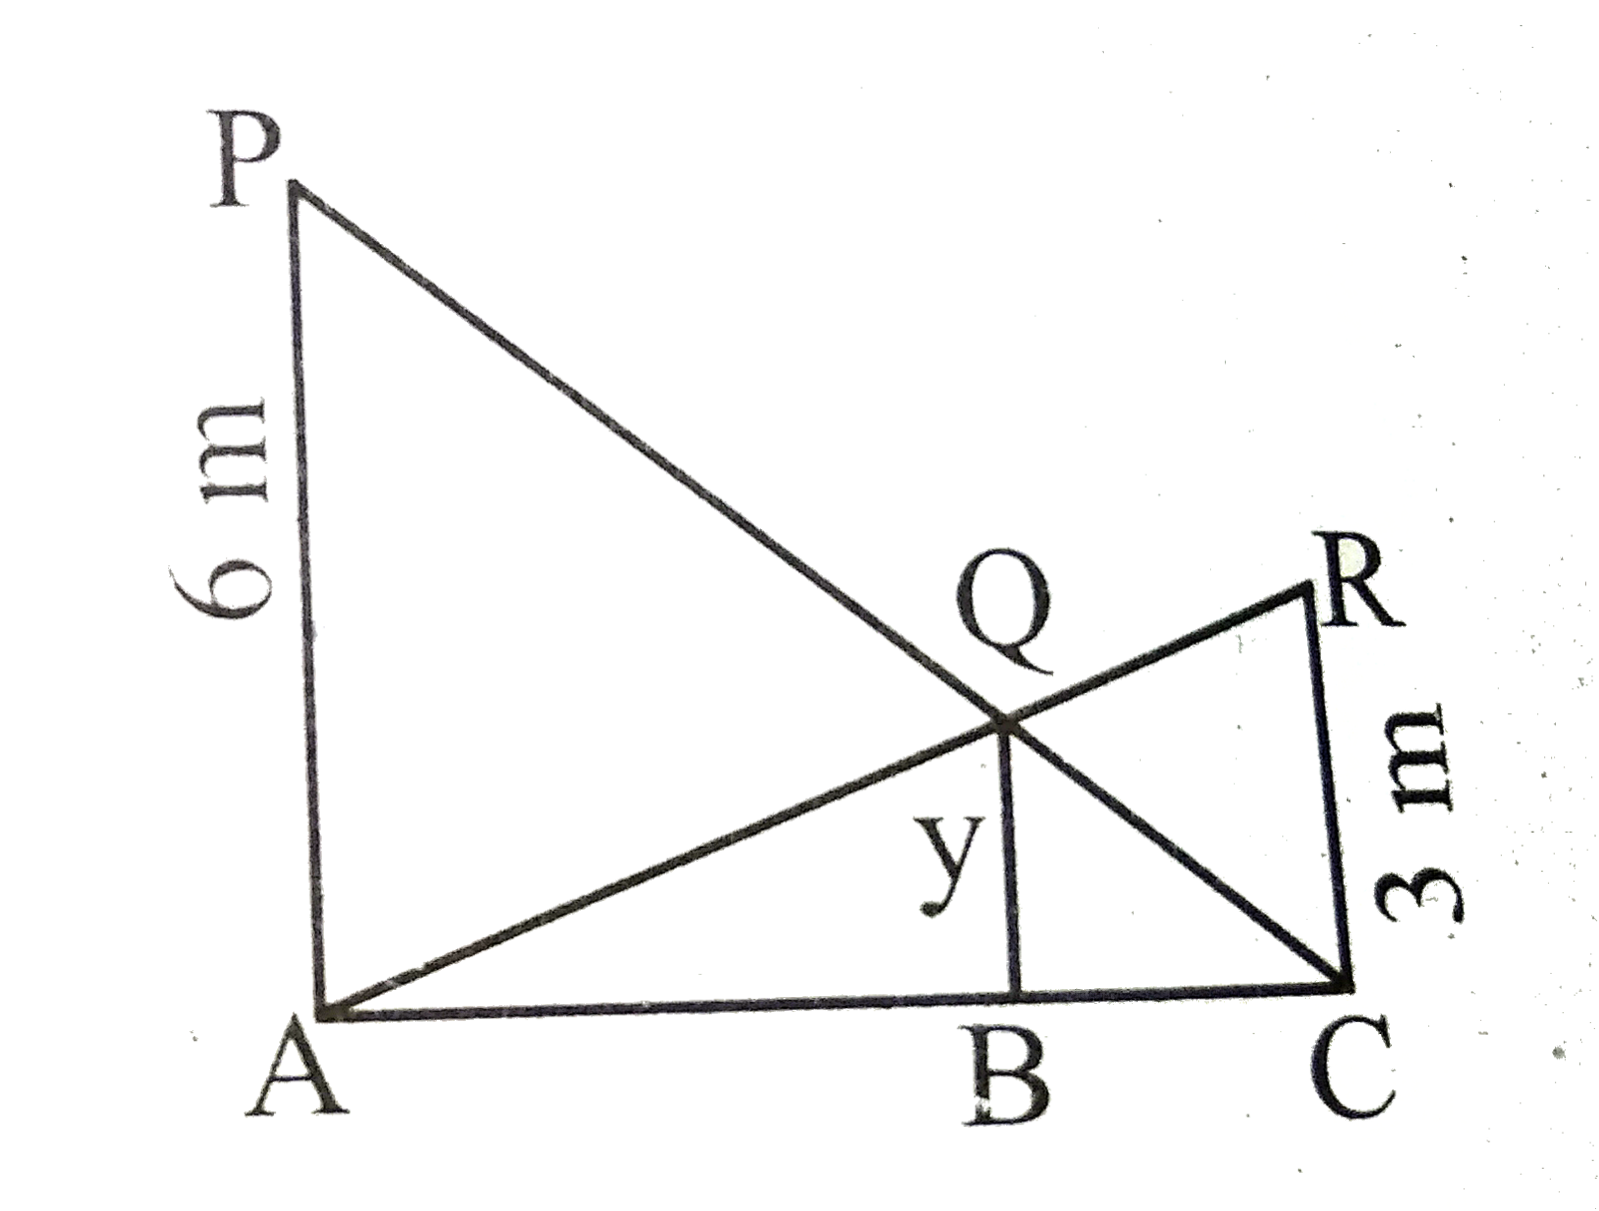
Two vertical poles of heights 6 m and 3 m are erected above a horizontal ground AC. Find the value of y.
 Solution in Tamil
Step by step video & image solution for Two vertical poles of heights 6 m and 3 m are erected above a horizontal ground AC. Find the value of y. by Maths experts to help you in doubts & scoring excellent marks in Class 10 exams.
Updated on:21/07/2023Topper's Solved these Questions
- GEOMETRYBOOK - SURA PUBLICATIONCHAPTER - GEOMETRYEXERCISE - Exercise 4.2
17 Videos
- GEOMETRYBOOK - SURA PUBLICATIONCHAPTER - GEOMETRYEXERCISE - Exercise 4.3
8 Videos
- CREATIVE QUESTION SET BOOK - SURA PUBLICATIONCHAPTER - CREATIVE QUESTION SET EXERCISE - Multiple Choice Question
120 Videos
- GOVT. MODEL QUESTION PAPER-2019-20BOOK - SURA PUBLICATIONCHAPTER - GOVT. MODEL QUESTION PAPER-2019-20EXERCISE - Part-IV
6 Videos
Similar Questions
In ΔABC, D and E are points on the sides AB and AC respectively such that DE∣∣BC
(i) If ADDB=34 and AC=15 cm find AE.
(ii) If AD=8x-7, DB=5x-3, AE= 4x-3 and EC=3x - 1, find the value of x.
View SolutionA man goes 18 m due east and then 24 m due north. Find the distance of his current position from the starting point ?
View SolutionIf n(A×B)=20andn(A)=5 then n(B)=
View SolutionFind two consecutive positive integers, sum of whose squares is 365.
View SolutionHow many lines of symmetry does the above figure have ?
View SolutionDetermine the point of symmetry of a regular hexagon.
View SolutionIn the figure above (not to scale), ¯¯¯¯¯¯AB⊥¯¯¯¯¯¯CDandAD is the bisector of ∠BAE.AB=3cm and AC=5cm. Find CD.
View SolutionMatch the following Column A to Column B

View SolutionMatch the following Column A to Column B

View SolutionMatch the following Column A to Column B

View SolutionFind the area of figure given below.

View SolutionFind the area of the figure given below.

View SolutionThe inequation represented by the graph given below is :
View SolutionThe inequation that best describes the graph given below is _________
View SolutionThe inequation that best describes the following graph is _________
View Solution
