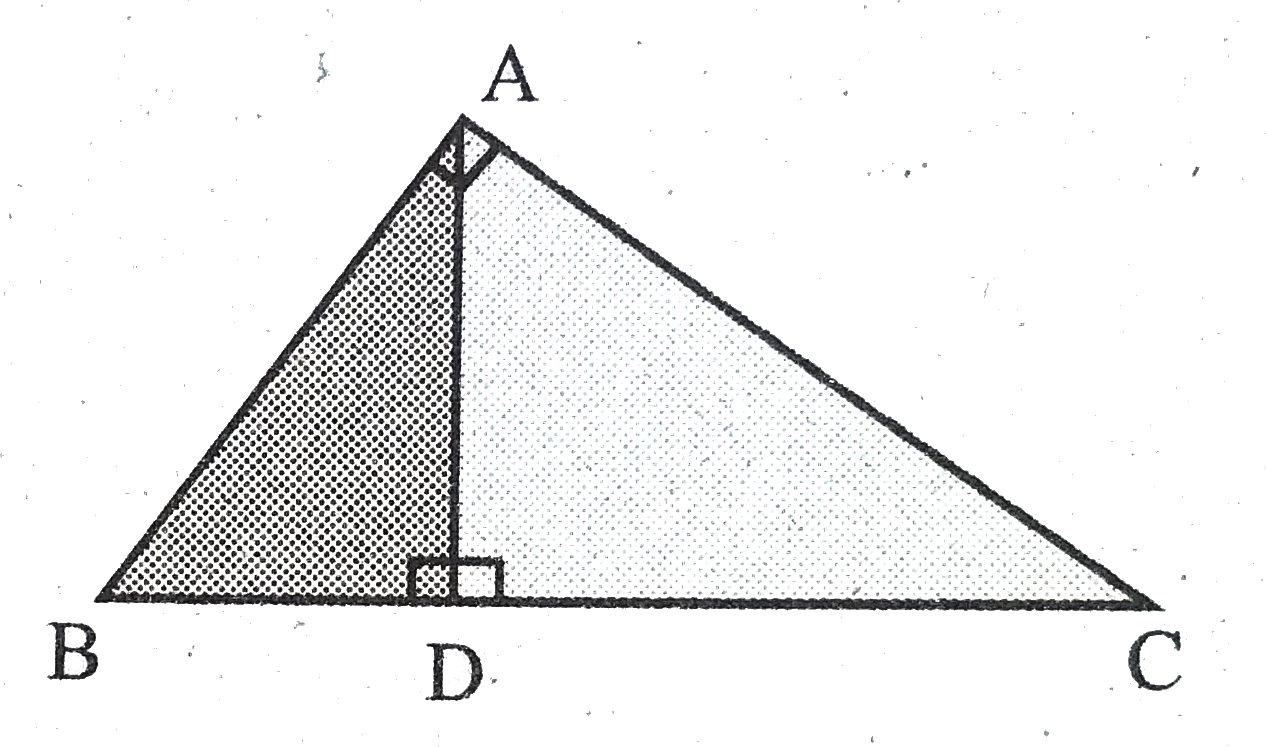
In the adjacent figure ∠BAC=90∘andAD⊥BC then
 Solution in Tamil
BD.CD=BC2
AB.AC=BC2
BD.CD=AD2
AB.AC=AD2
The correct Answer is:C
Step by step video, text & image solution for In the adjacent figure angle BAC=90^(@) and AD bot BC then by Maths experts to help you in doubts & scoring excellent marks in Class 10 exams.
Updated on:21/07/2023Topper's Solved these Questions
- GEOMETRYBOOK - SURA PUBLICATIONCHAPTER - GEOMETRYEXERCISE - Unit Test (Section -B)
7 Videos
- GEOMETRYBOOK - SURA PUBLICATIONCHAPTER - GEOMETRYEXERCISE - Unit Test (Section -C)
2 Videos
- GEOMETRYBOOK - SURA PUBLICATIONCHAPTER - GEOMETRYEXERCISE - Additional Question & Answers
11 Videos
- CREATIVE QUESTION SET BOOK - SURA PUBLICATIONCHAPTER - CREATIVE QUESTION SET EXERCISE - Multiple Choice Question
120 Videos
- GOVT. MODEL QUESTION PAPER-2019-20BOOK - SURA PUBLICATIONCHAPTER - GOVT. MODEL QUESTION PAPER-2019-20EXERCISE - Part-IV
6 Videos
Similar Questions
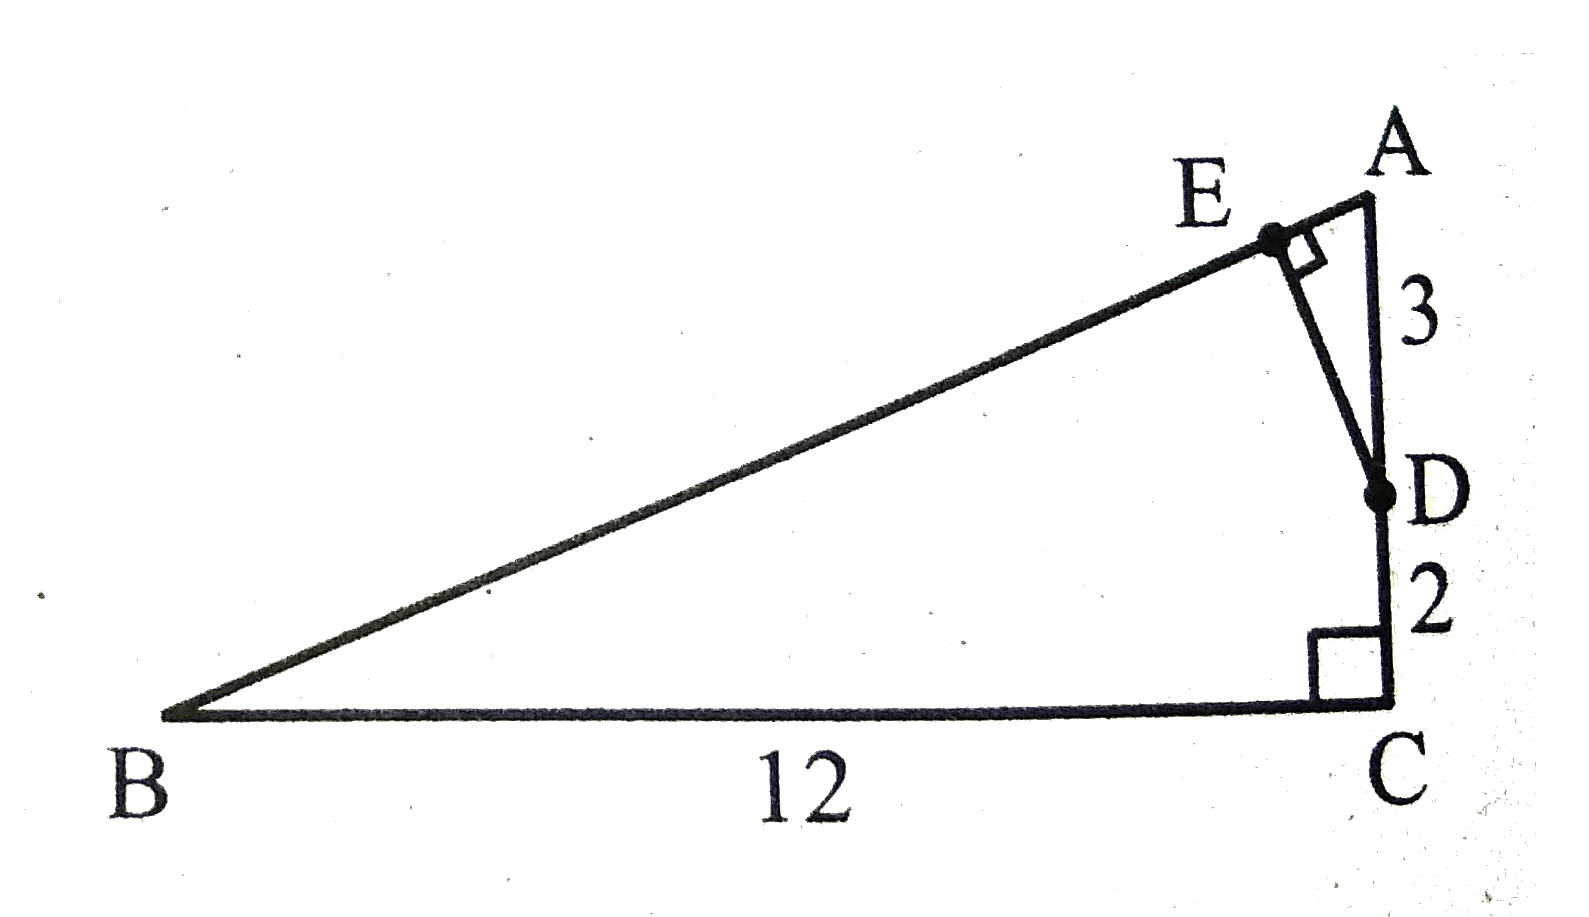
In the adjacent figure, ΔABC is right angled at C and DE⊥AB. Prove that ΔABC~ΔADE and hence find the lengths of AE and DE ?

View SolutionA man whose eye-level is 2 m above the ground wishes to find the height of a tree. He places a mirror horizontally on the ground 20 m from the tree and finds that if he stands at a point C which is 4m from the mirror B, he can see the reflection of the top of the tree. How height is the tree ?
View SolutionIn figure if PQ ||RS, Prove that ΔPOQ~ΔSOR.
View SolutionIf n(A×B)=20andn(A)=5 then n(B)=
View SolutionFind two consecutive positive integers, sum of whose squares is 365.
View SolutionHow many lines of symmetry does the above figure have ?
View SolutionDetermine the point of symmetry of a regular hexagon.
View SolutionDtermine the images of the following figure about the given line :
View SolutionMatch the following Column A to Column B

View SolutionMatch the following Column A to Column B

View SolutionMatch the following Column A to Column B

View SolutionFind the area of the figure given below.

View SolutionThe area of the shaded part in the figure given below is ______.

View SolutionThe inequation represented by the graph given below is :
View SolutionThe inequation that best describes the graph given below is _________
View SolutionThe inequation that best describes the following graph is _________
View Solution