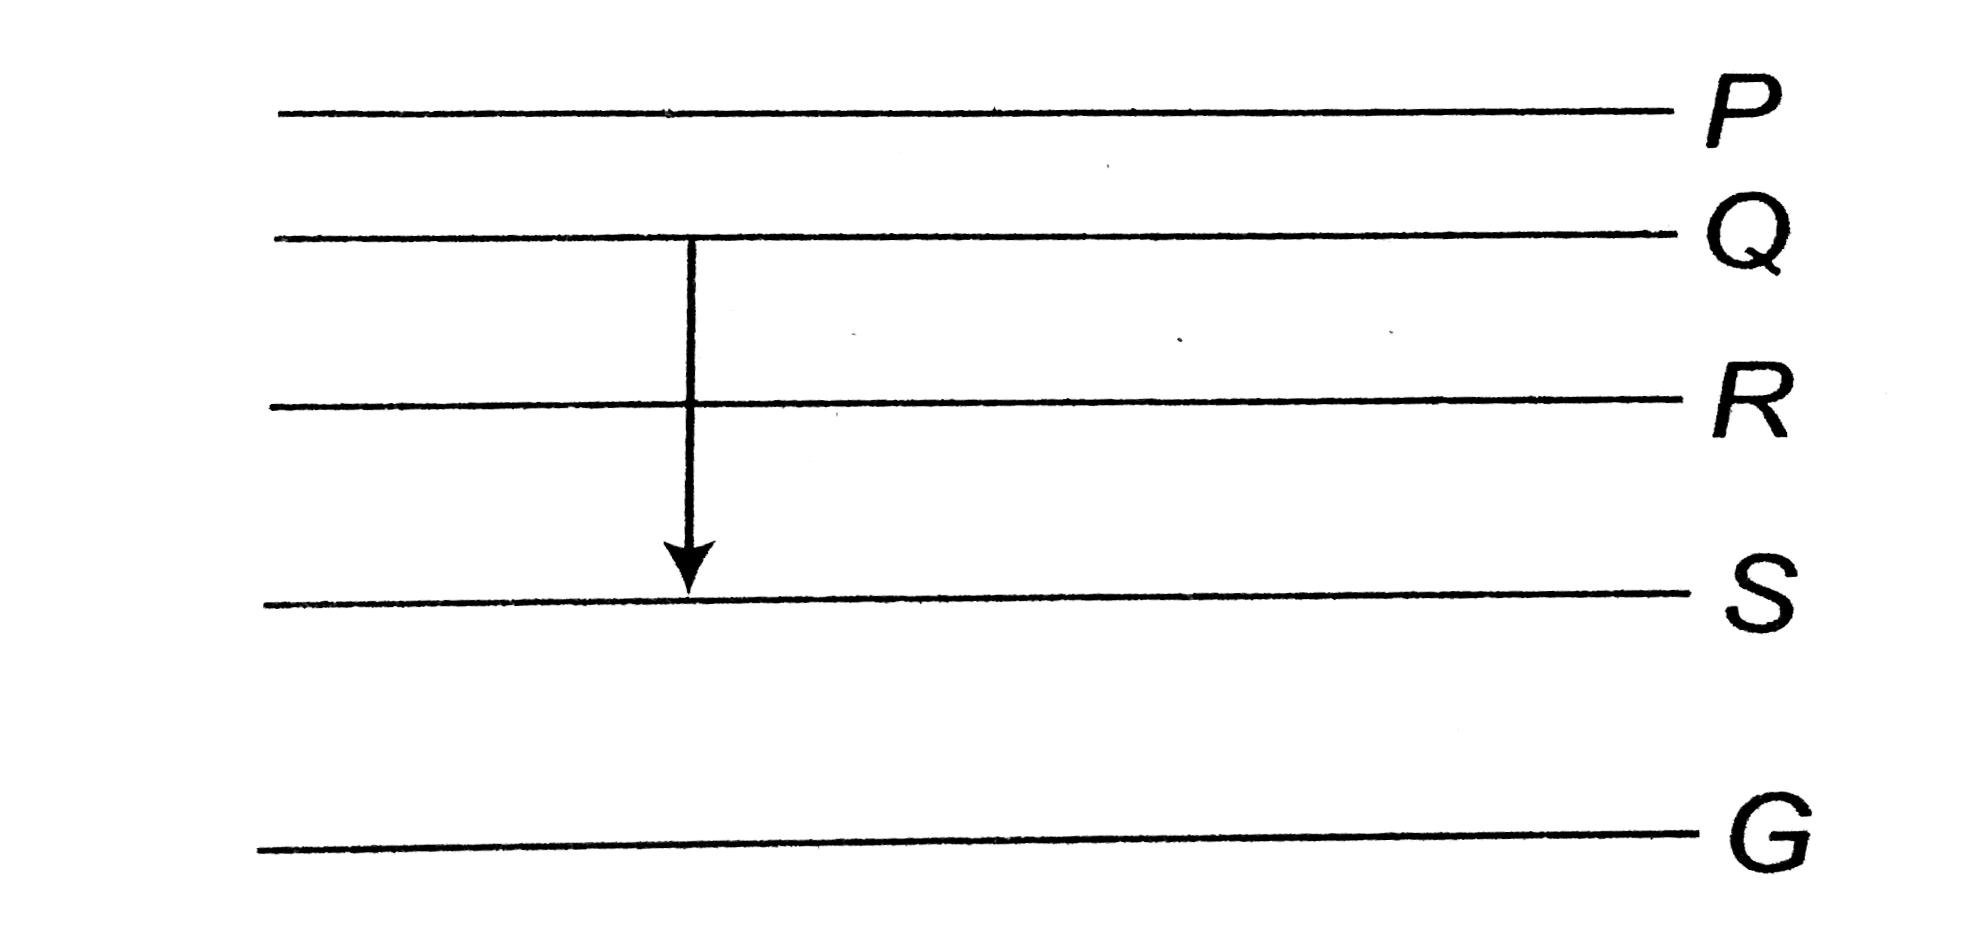
Figure shows the enegry levels and of an atom where is the ground state. A red line in the emission spectrum of the atom can be obtaned by an energy level change from so . A blue line can be obtained by following energy level change

P to Q
Q to R
R to S
R to G
The correct Answer is:D
Step by step video, text & image solution for Figure shows the enegry levels P, Q, R, S and G of an atom where G is the ground state. A red line in the emission spectrum of the atom can be obtaned by an energy level change from Q so S. A blue line can be obtained by following energy level change by Physics experts to help you in doubts & scoring excellent marks in Class 12 exams.
Topper's Solved these Questions
- BOOK - ERRORLESS CHAPTER - ATOMIC AND NUCLEAR PHYSICSEXERCISE - Ordinary15videos
ATOMIC AND NUCLEAR PHYSICS
- BOOK - ERRORLESS CHAPTER - ATOMIC AND NUCLEAR PHYSICSEXERCISE - Nuckeus, Nuclear Reaction2videos
ATOMIC AND NUCLEAR PHYSICS
- BOOK - ERRORLESS CHAPTER - ALTERNATING CURRENTEXERCISE - SET15videos
ALTERNATING CURRENT
- BOOK - ERRORLESS CHAPTER - COMMUNICATION SYSTEMEXERCISE - S E T14videos
COMMUNICATION SYSTEM
Similar Questions
Total different spectral lines observed in between 11th excited state and 3rd energy level in H-atom emission spectrum are:
View Solution1.8 g hydrogen atoms are excited to raditions . They study of spectra indicates that 27% of the atoms are
in 3rd energy level and 15% of atom in 2nd energy level and the rest in ground state .If .I.P.of H is
21.7×10⁻⁸erg . Calcute-
(i) No. the atoms present in III & II energy level .
(ii) Total energy evolved when all the atoms when all the atoms return to ground state.View Solution
Knowledge Check
- Question 1 - Select One
In the emission line spectra of hydrogen atom, how many lines can be accounted for by all possible electron transitions between five lowest energy levels within the atom ?
A4B5C10D20 - Question 2 - Select One or More
For the energy levels in an atom , which of the following statement is //are correct ?
AThere are seven principal electron energy levels.BThe second principal energy level can have four sub energy levels and contain a maximum of eight electrons.CThe M energy level can have a maximum of 32 electrons.DThe 4s sub energy level is at a lower enerty than the 3d sub energy level. - Question 3 - Select One
An atom has x energy level , then total number of lines in its spectrum are :
A1+2+3……(x+1)B1+2+3…..(x2)C1+2+3……(x−1)D(x+1)(x+2)(x+4)
In the emission line spectra of hydrogen atom, how many lines can be accounted for all possible electronic transitions from 5th energy level within the atom?
View SolutionFor the energy levels in atom, which one of the following statement (s) is (are) correct?
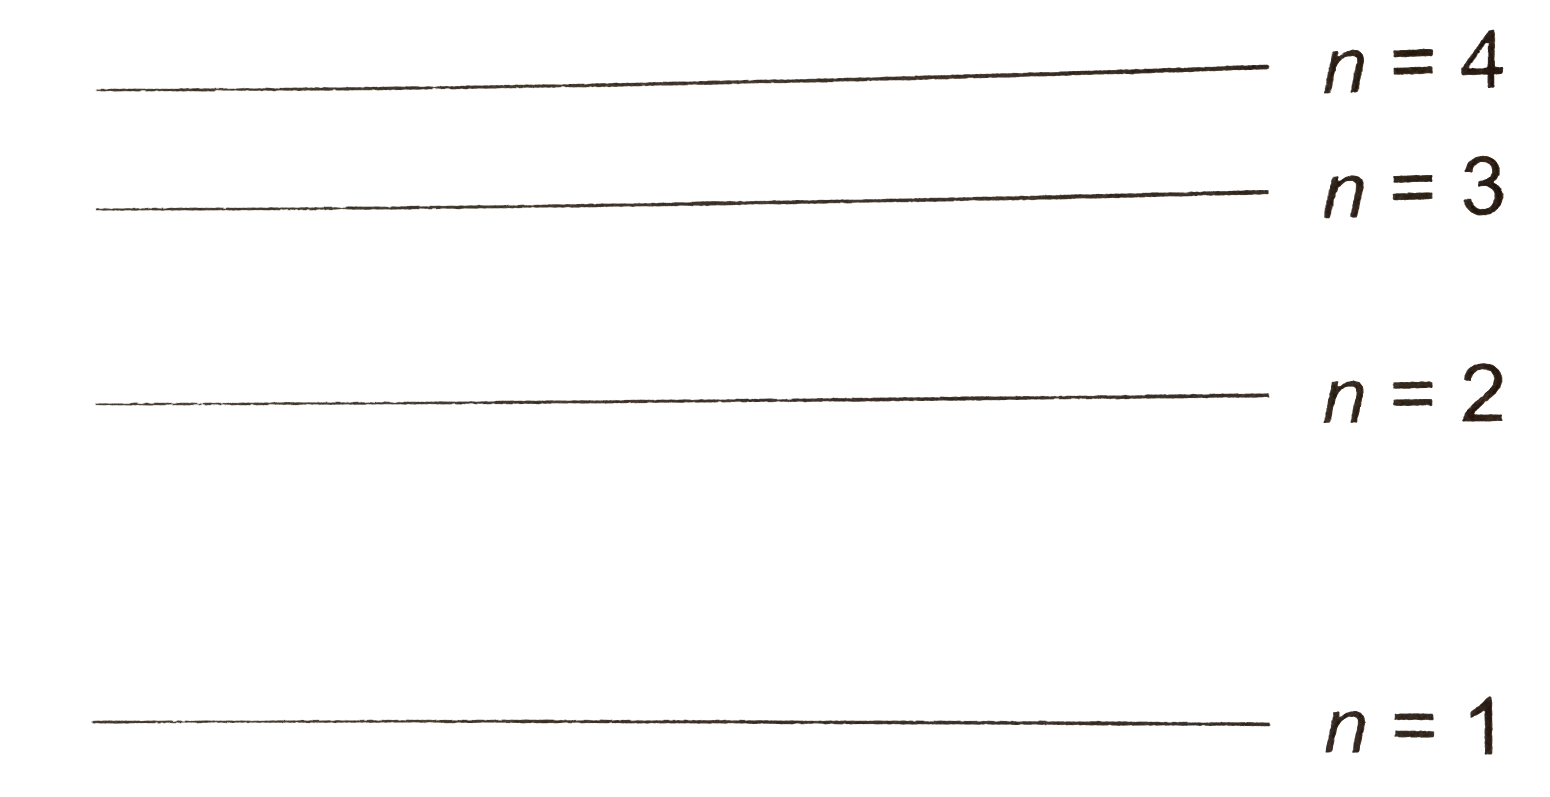
View SolutionFour lowest energy levels of H-atom are shown in the figure. The number of possible emission lines would be
 View Solution
The wavelengths of the lines emitted in the Lyman series of the spectrum of hydrogen atom correspond to transitions between energy levels with total quantum numbers
View SolutionThe wavelengths of the lines emitted in the Lyman series of the spectrum of hydrogen atom correspond to transitions between energy levels with total quantum numbers
View Solution

