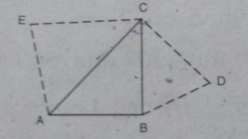
In the figure, ΔABC is an isosceles triangle right angled at B. Two equilateral triangles are constructed with sides AC and BC. Then ΔBCD=
 Solution in Telugu
ΔACE
ΔABC
12(ΔABC)
12(ΔACE)
The correct Answer is:D
Step by step video & image solution for In the figure, DeltaABC is an isosceles triangle right angled at B. Two equilateral triangles are constructed with sides AC and BC. Then DeltaBCD= by Maths experts to help you in doubts & scoring excellent marks in Class 10 exams.
Updated on:21/07/2023Topper's Solved these Questions
- SIMILAR TRIANGLES BOOK - VGS PUBLICATION-BRILLIANTCHAPTER - SIMILAR TRIANGLES EXERCISE - OBSERVATION BITS TO SOLVE VARIOUS BITS IN THE GIVEN IN THE PUBLIC EXAMINATION
29 Videos
- SETS BOOK - VGS PUBLICATION-BRILLIANTCHAPTER - SETS EXERCISE - CREATIVE BITS OF CCE MODEL EXAMINATION
116 Videos
- STATISTICSBOOK - VGS PUBLICATION-BRILLIANTCHAPTER - STATISTICSEXERCISE - EXERCISE
146 Videos
Similar Questions
The maximum nuber of possible tangents that can be draw to a circle is ……..
View SolutionLet A={1,2,{1},{1,2},3,4}, then which of the following is true?
View SolutionThe mean value can be calculated from both ungrouped and grouped date . Which one you think is more accurate ? Why ?
View SolutionHow many lines of symmetry does the above figure have ?
View SolutionDetermine the point of symmetry of a regular hexagon.
View SolutionDtermine the images of the following figure about the given line :
View SolutionIn the following figure, AB and BC are equidistant from the centre 'O' of the Show that
(a) ABC is an isosceles triangle.
(b) OB bisects angle ABC.
ltimg src="https://d10lpgp6xz60nq.cloudfront.net/physics_images/PS_MATH_X_C13_E02_006_Q01.png" width="80%"gt
View SolutionMatch the following Column A to Column B

View SolutionMatch the following Column A to Column B

View SolutionMatch the following Column A to Column B

View SolutionFind the area of the figure given below.

View SolutionThe area of the shaded part in the figure given below is ______.

View SolutionThe inequation represented by the graph given below is :
View SolutionThe inequation that best describes the graph given below is _________
View SolutionThe inequation that best describes the following graph is _________
View Solution
