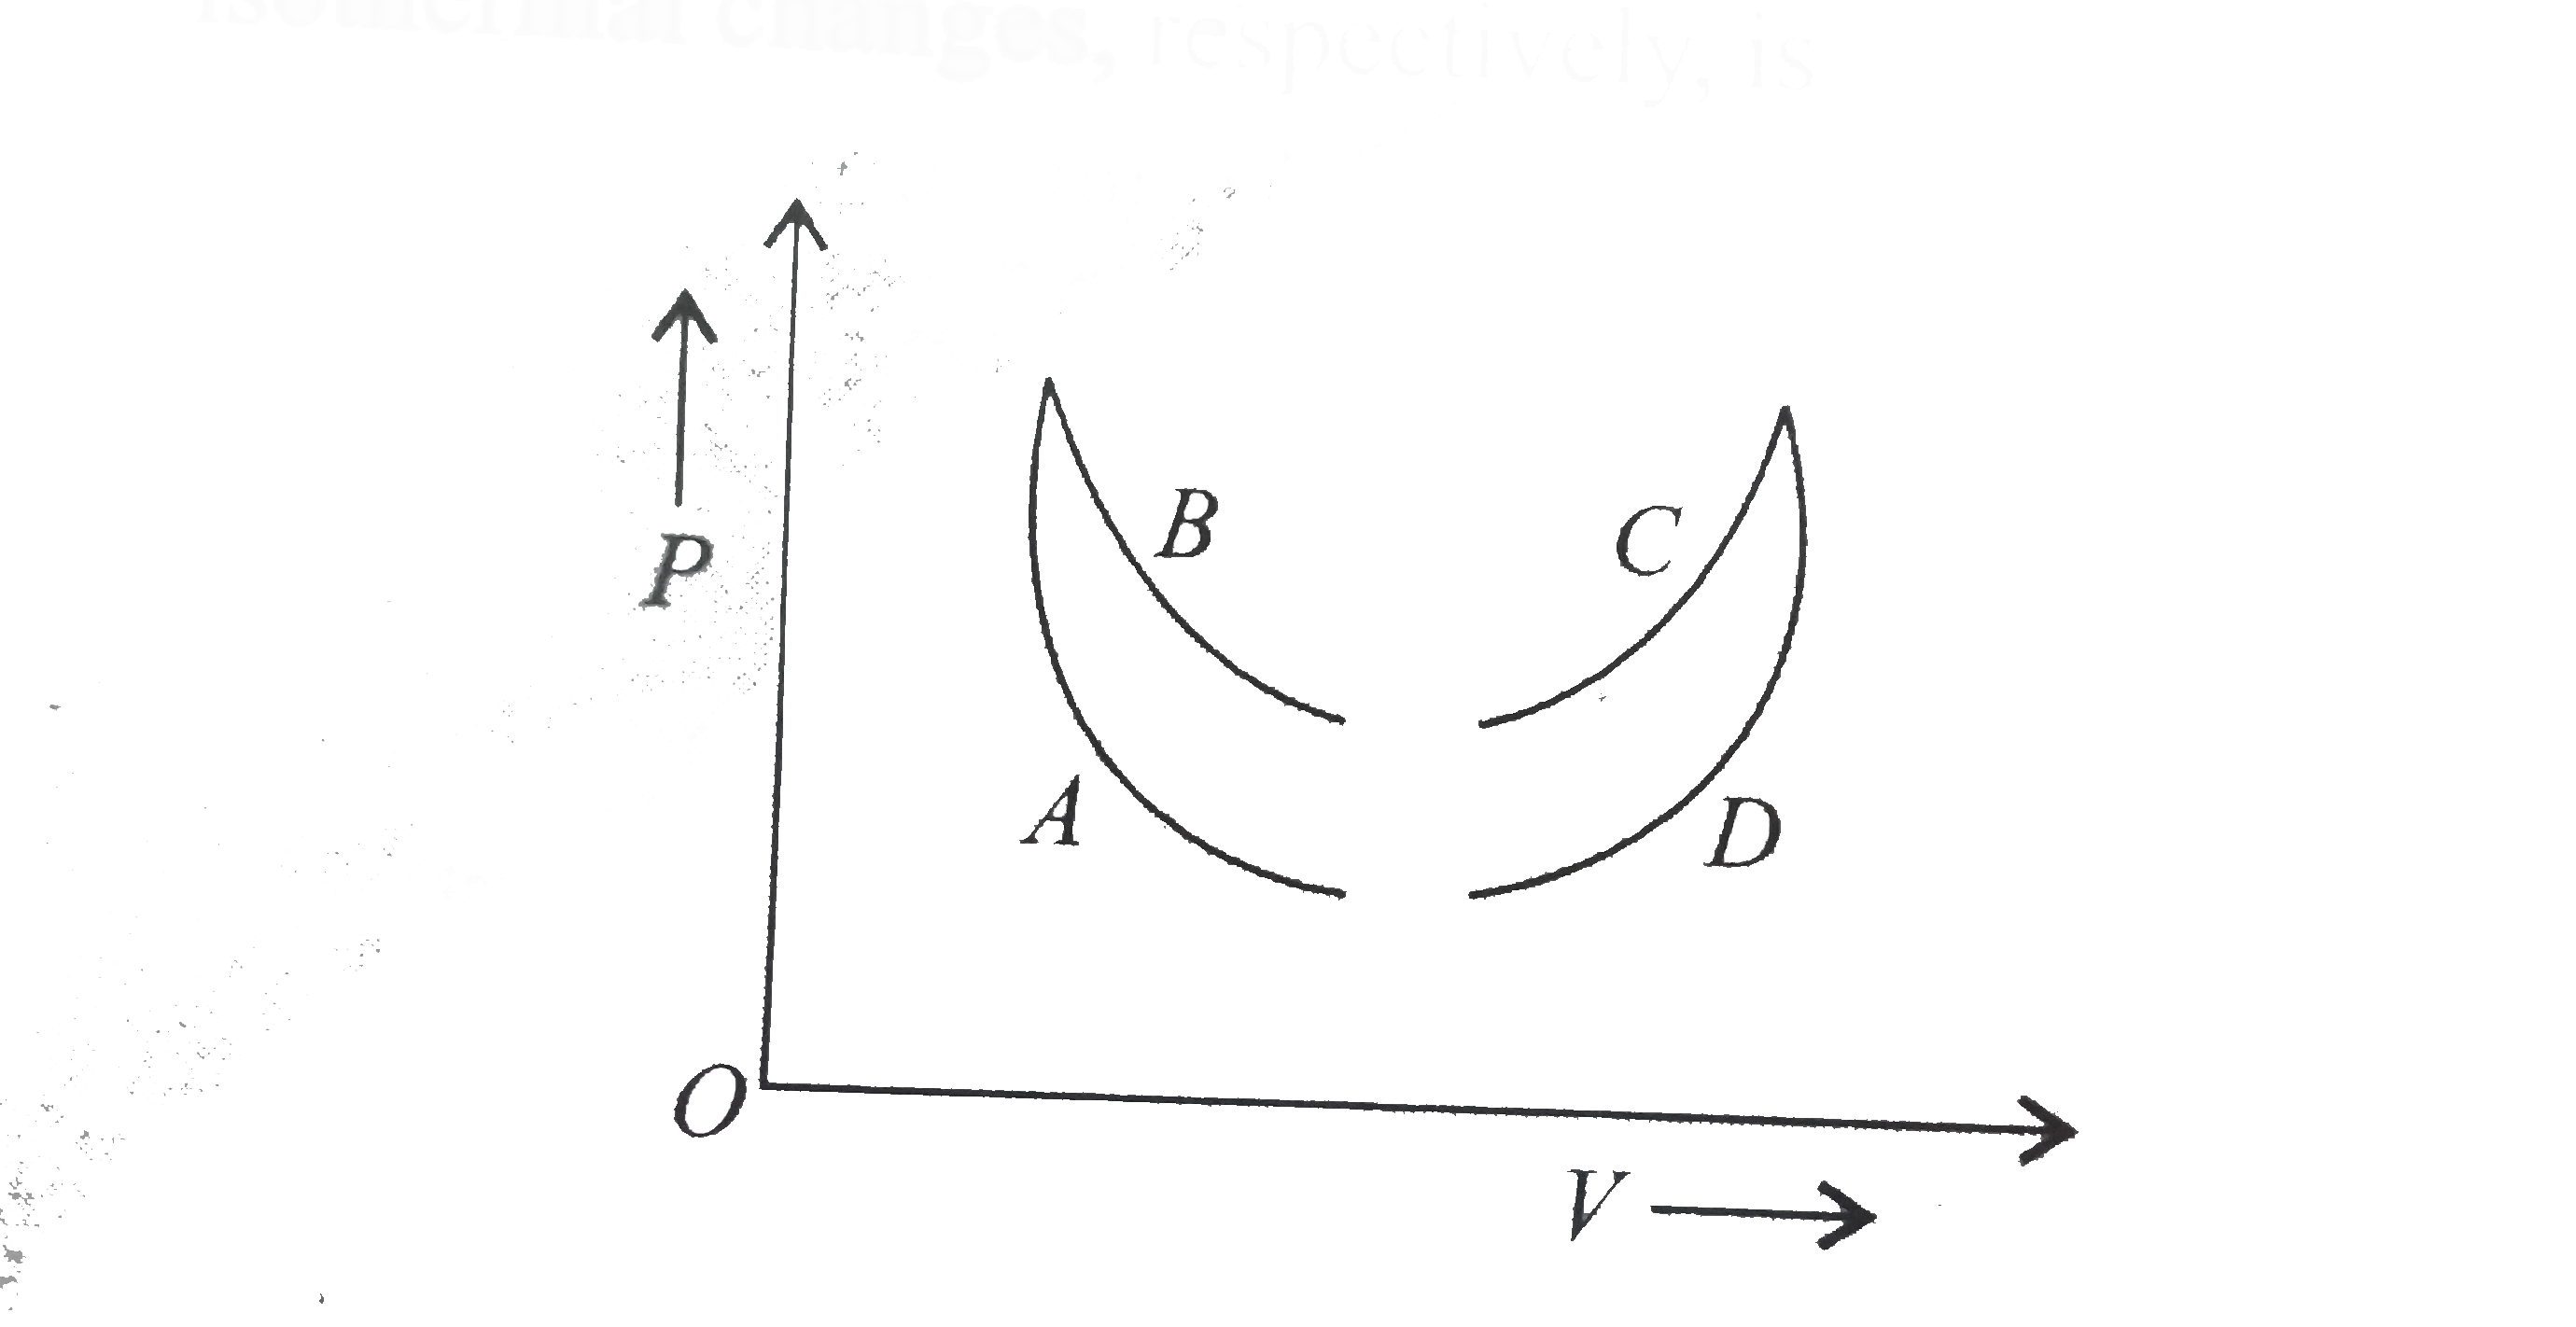
In the following figure, four curves A,B, C and D are shown. The curves are
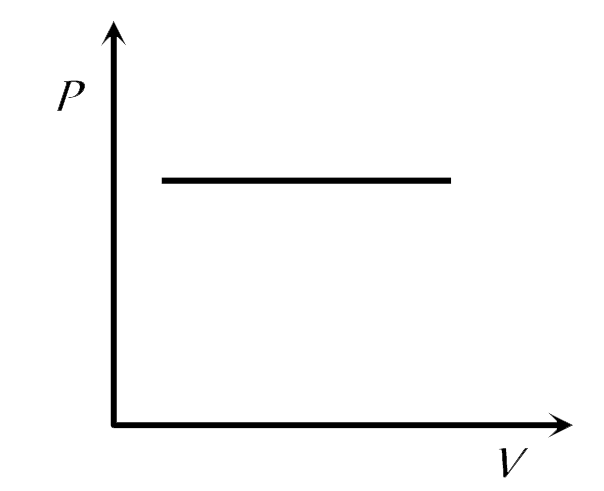
Isothermal for A and D while adiabatic for B and C
Adiabatic for A and C while isothermal for B and D
Isothermal for A and B while adiabatic for C and D
Isothermal for A and C while adiabatic for B and D
The correct Answer is:D
Step by step video, text & image solution for In the following figure, four curves A,B, C and D are shown. The curves are by Physics experts to help you in doubts & scoring excellent marks in Class 11 exams.
Topper's Solved these Questions
Similar Questions
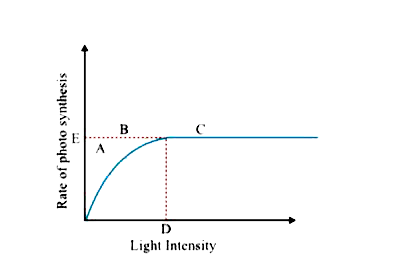
The figure shows the effect of light on the rate of photosynthesis. Based on the graph, answer the following questions :
What do region C and D represent on the curve ?
 View Solution
Figure shows the effect of light on the rate of photosynthesis.
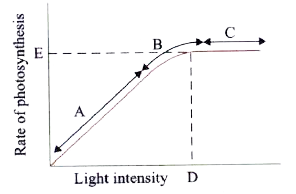
Based on the graph, answer the following questions.
What do C and D represent on the curve?View Solution
Knowledge Check
- Question 1 - Select One
A particle is being acted upon by one dimensional conservative force. In the F−x curve shown, four points A,B,C,D are marked on the curve. State which type of equilibrium is the particle have at position c.
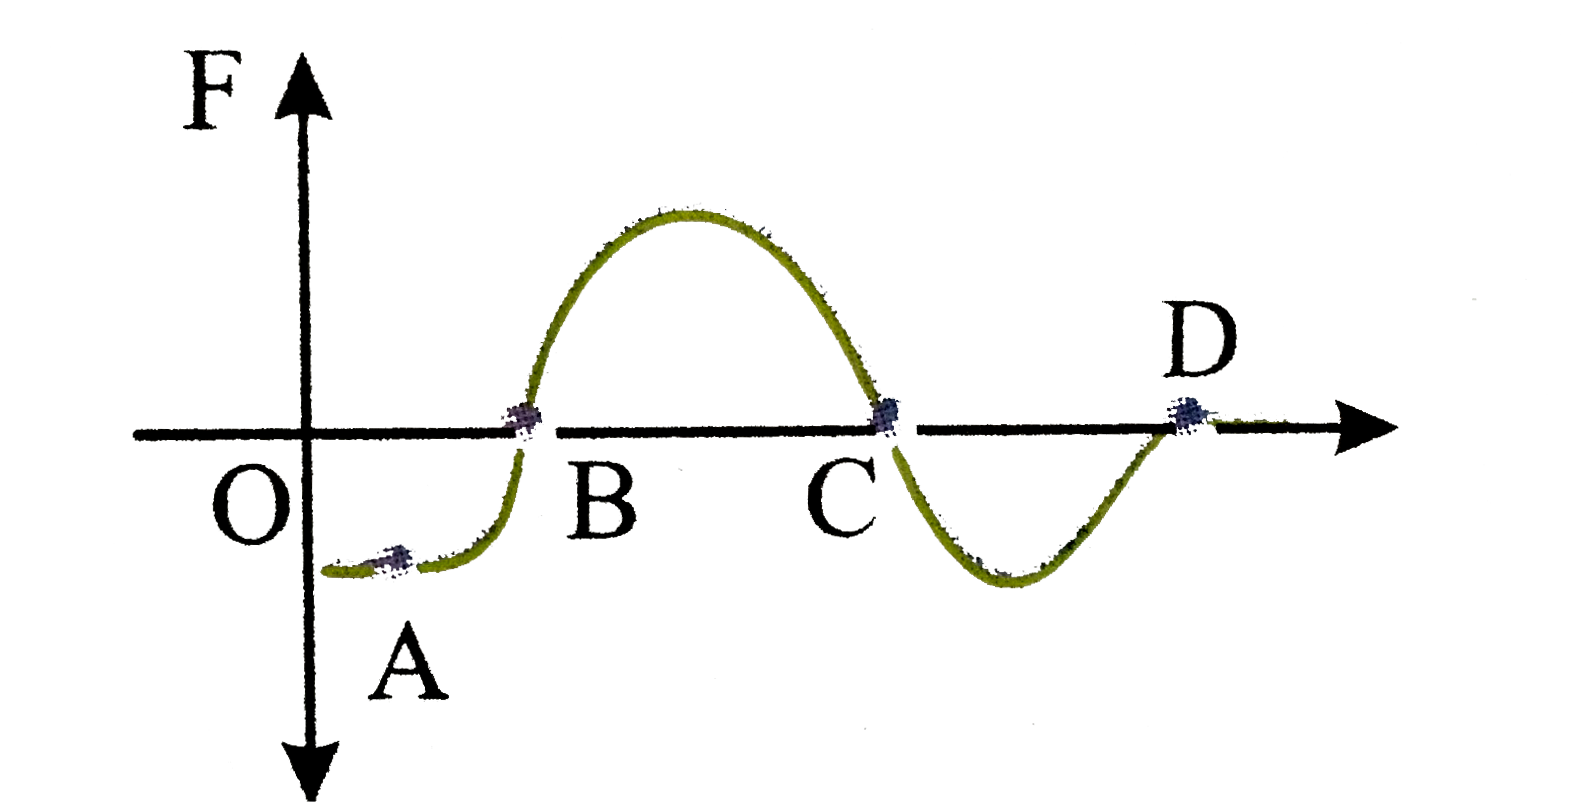 .Astable equilibriumBunstableCNeutralDNo equilibrium
 - Question 2 - Select One
At certain temperature the volume - pressure curves for four gases A , B , C and D are as shown below . The gas that deviates least from ideal nature is
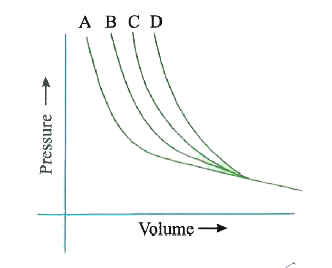 ABBDCCDA
 - Question 3 - Select One
Which one of the following figures is an open curve?
A B
B C
C D
D
Four figures marked A, B, C & D are given. Out of the four figures A, B, C & D one of the figure is hidden in the figure marked ‘X’. Find the correct option and write the answer in the answer box.
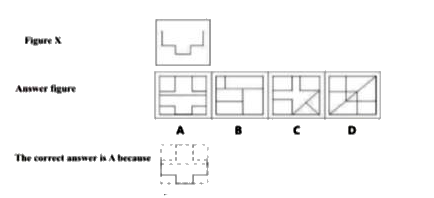 View Solution
Four curves A,B,C and D are drawn in figure for a given amount of gas. The curve which represents adiabatic and isothermal changes, respectively, is
 View Solution
Which one of the following figures is an open curve ?
View SolutionFigure-I-Mango, Figure-II-Coconut are shown in the following digram. Identify the parts of the fruit A,B,C and D are respectively
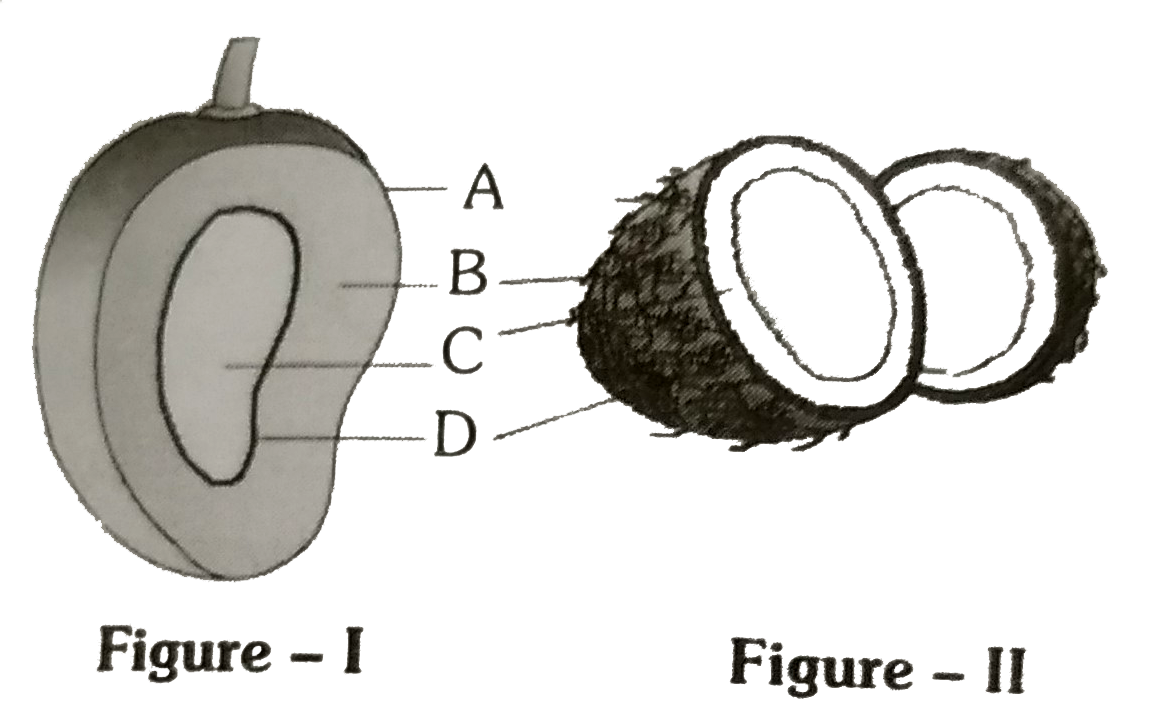 View Solution
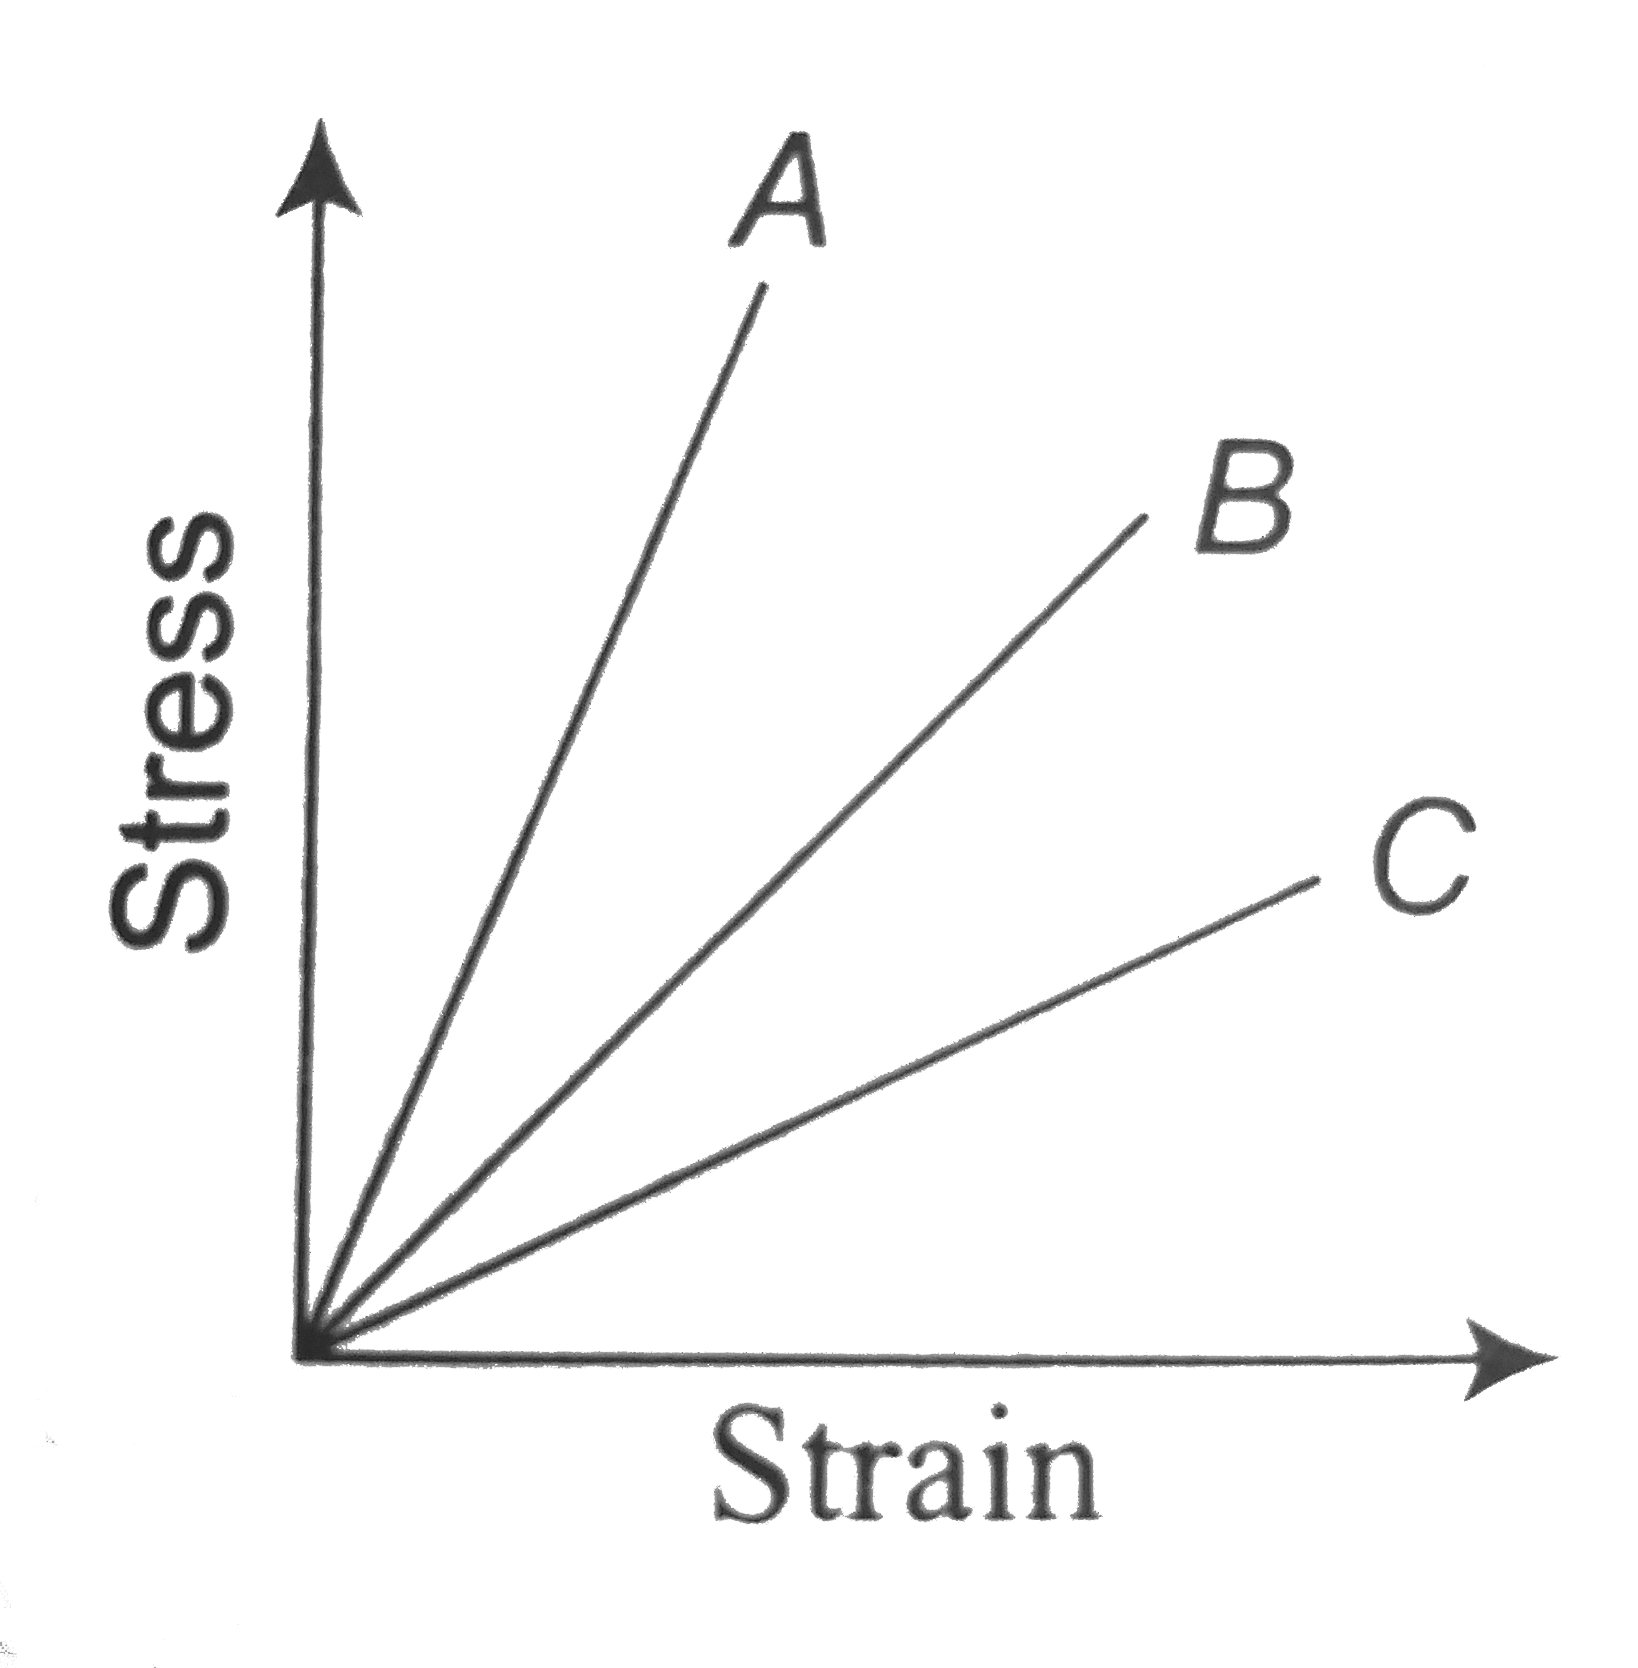
The stress strain curves for brass, steel and rubber are shown in the figure. The lines A, B and C are forView Solution

