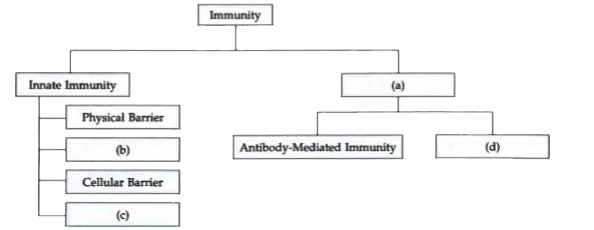
Explain the flow chart given below.

Text Solution
It is the pyramid of biomass.
(1) In this pyramid 10% of the food will reach to the next trophical level and so on at each level.
(2) It would take 100 kg of phytoplankton to provide 100 kg of zooplankton and to form 1 kg of human tisue, 10 kg of frog is needed.
(3) The fewer the steps in the food chain, the more energy will be for the species at the top.
|
Topper's Solved these Questions
- OUR ENVIRONMENT-OUR CONCERNBOOK - VGS PUBLICATION-BRILLIANTCHAPTER - OUR ENVIRONMENT-OUR CONCERNEXERCISE - CREATIVE QUESTIONS FOR NEW MODEL PAPER
62 Videos
- OUR ENVIRONMENTBOOK - VGS PUBLICATION-BRILLIANTCHAPTER - OUR ENVIRONMENTEXERCISE - EXERCISE
219 Videos
- OVER USE OF GROUNDWATER-IT'S CONSEQUENCESBOOK - VGS PUBLICATION-BRILLIANTCHAPTER - OVER USE OF GROUNDWATER-IT'S CONSEQUENCESEXERCISE - FILL IN THE BLANKS
10 Videos
Similar Questions
Knowledge Check
Identify labels a- e in the flow-chart given below.
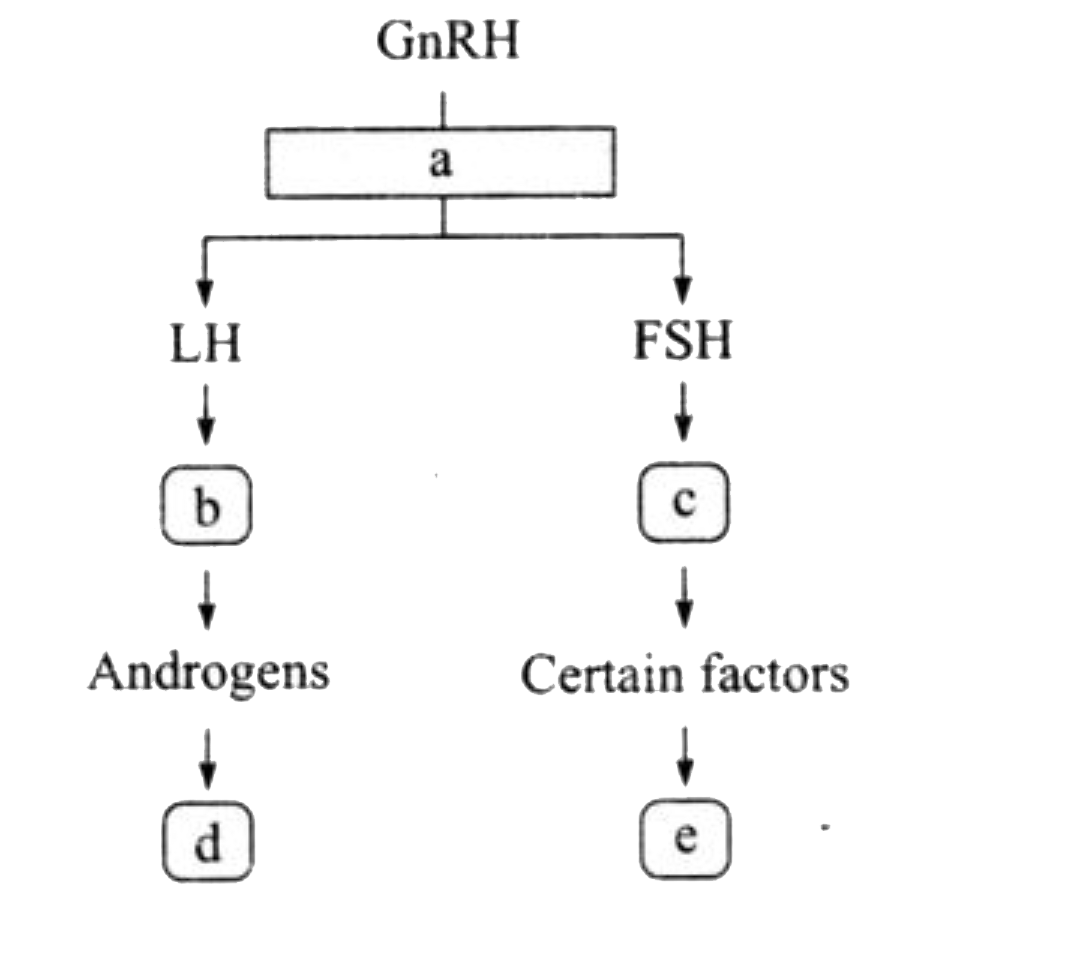 Aa-anterior pituitary, b - Sertoli cell, c - Leydig cell, d - spermiogenesis, e- spermatogenesisBa-posterior pituitary, b - Leydig cell, c - Sertoli cell, d - spermiogenesis, e- spermatogenesisCa-anterior pituitary, b - Leydig cell, c - Sertoli cell, d - spermatogenesis , e- spermiogenesisDa-anterior pituitary, b - Leydig cell, c - Sertoli cell, d - spermiogenesis , e- spermatogenesis
Find out A, B and C in the flow chart given below
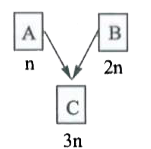 AA - female gamete , B- male gamete, C EndospermBA - Endosperm, B - female gamete, C - Male gameteCA - Male gamete, B - polar nuclei, C EndospermDA - Female gamete, B - Endosperm , C - Male gamete
.Find out A, B and C in the flow chart given below
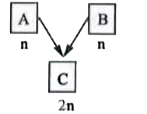 A(1) A - Female gamete, B - Male gamete, C EmbryoBA - Male gamete, B - Female gamete, C EmbryosacCA - Female gamete, B - Male gamete, C EndospermDA - Male gamete, B - Embyro, C - Female gamete
Study the flow chart given below . Name the hormones involved at each stage and explain their functions .

View SolutionStudy the flow chart given below . Name the hormones involved at each stage and explain their functions .

View Solution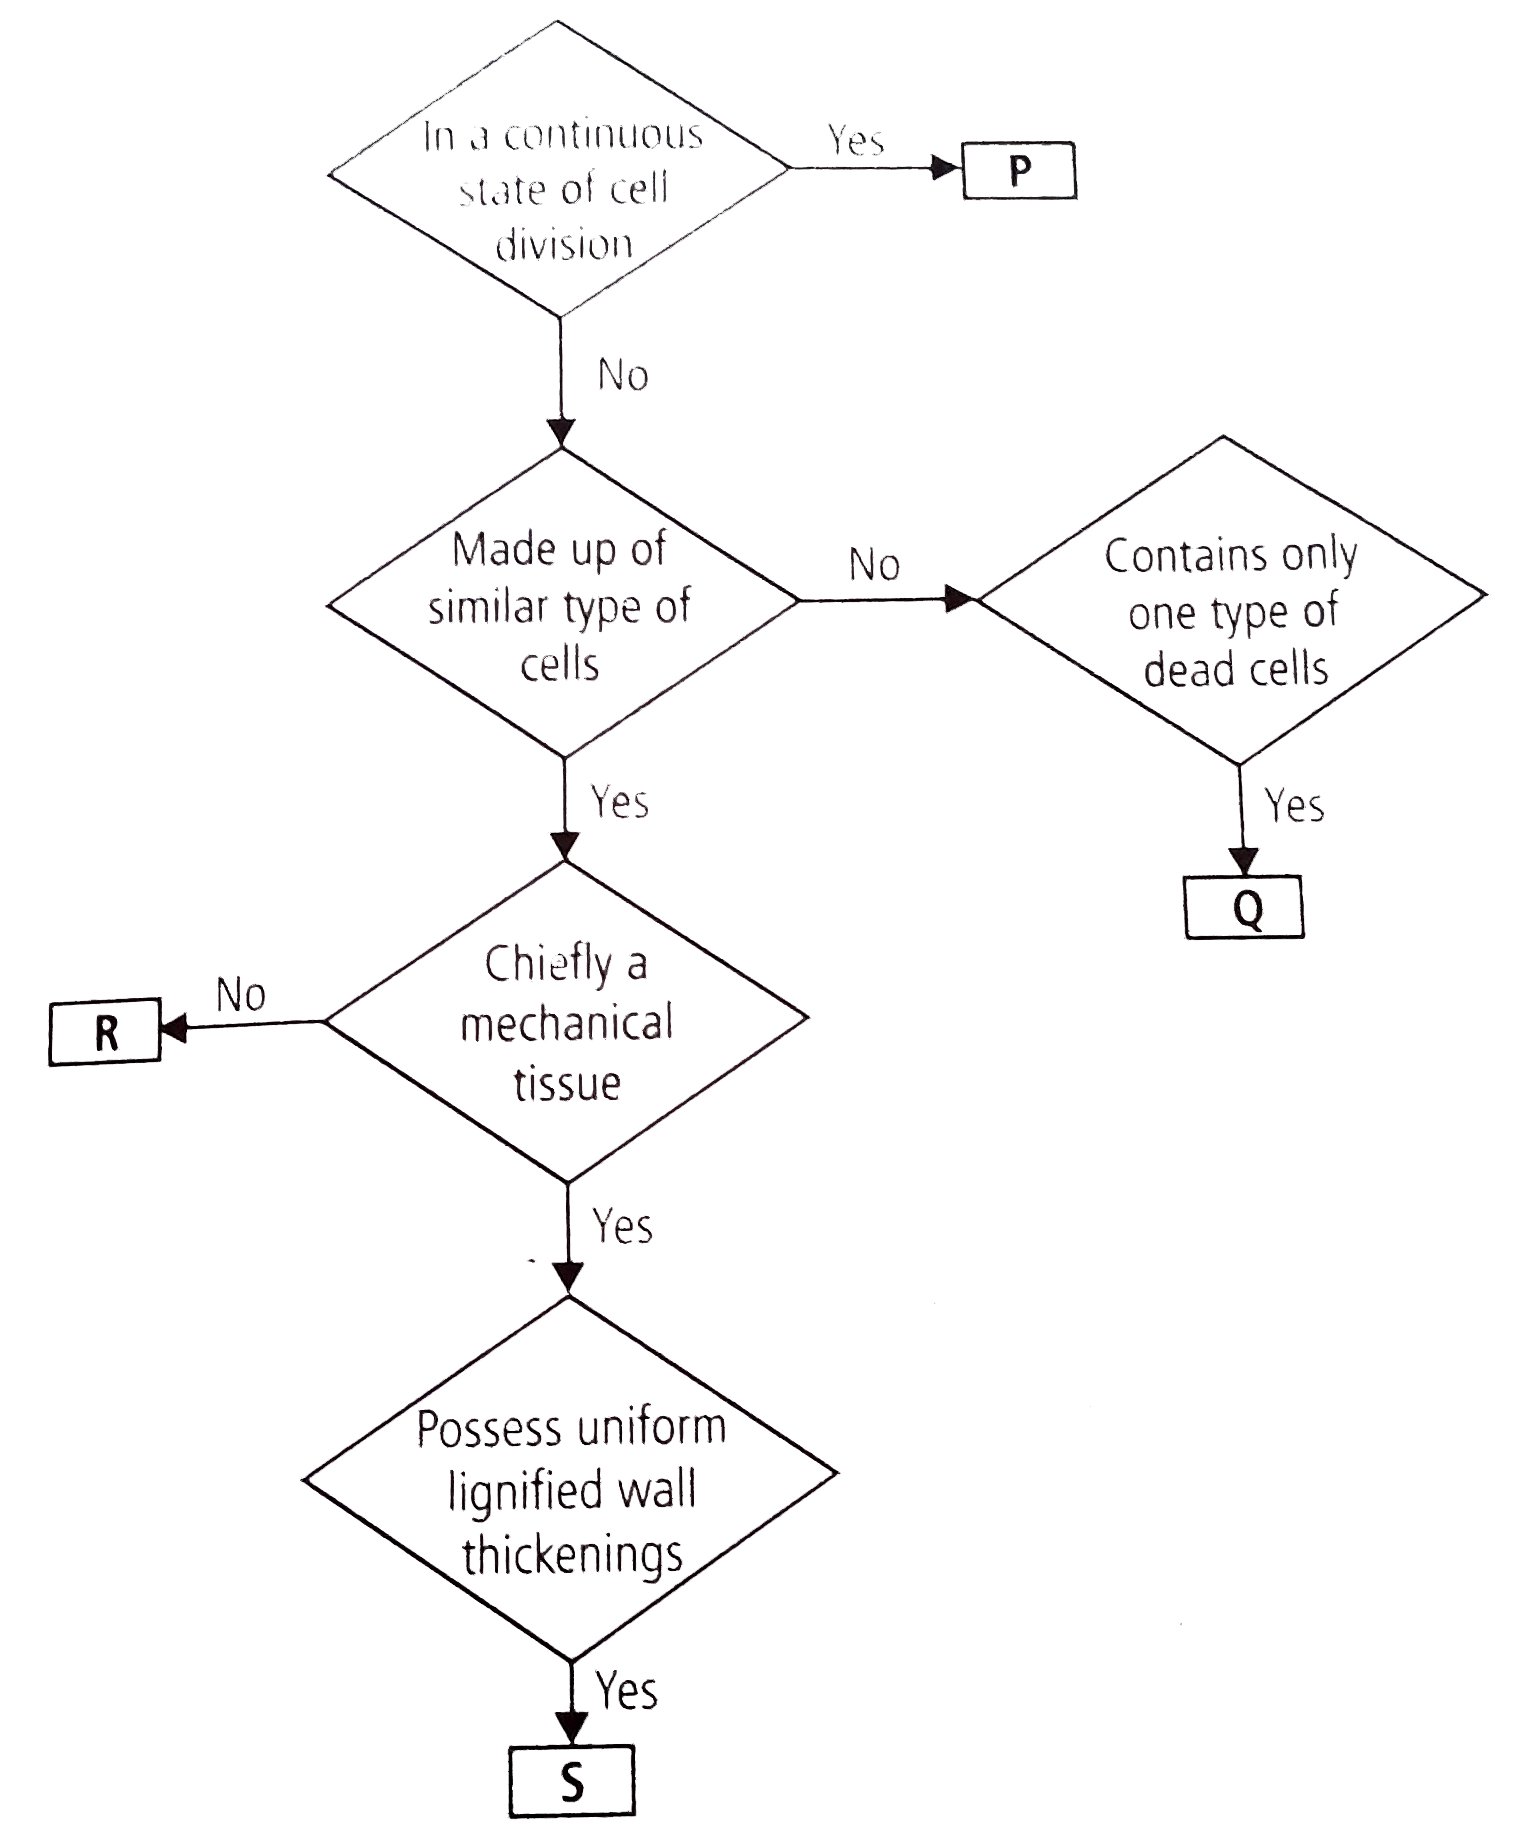
Study the flow chart given below:
Which of the following statements is incorrect regarding this?
View Solution
Study the flow chart given below:
Which of the following statements is incorrect regarding this?
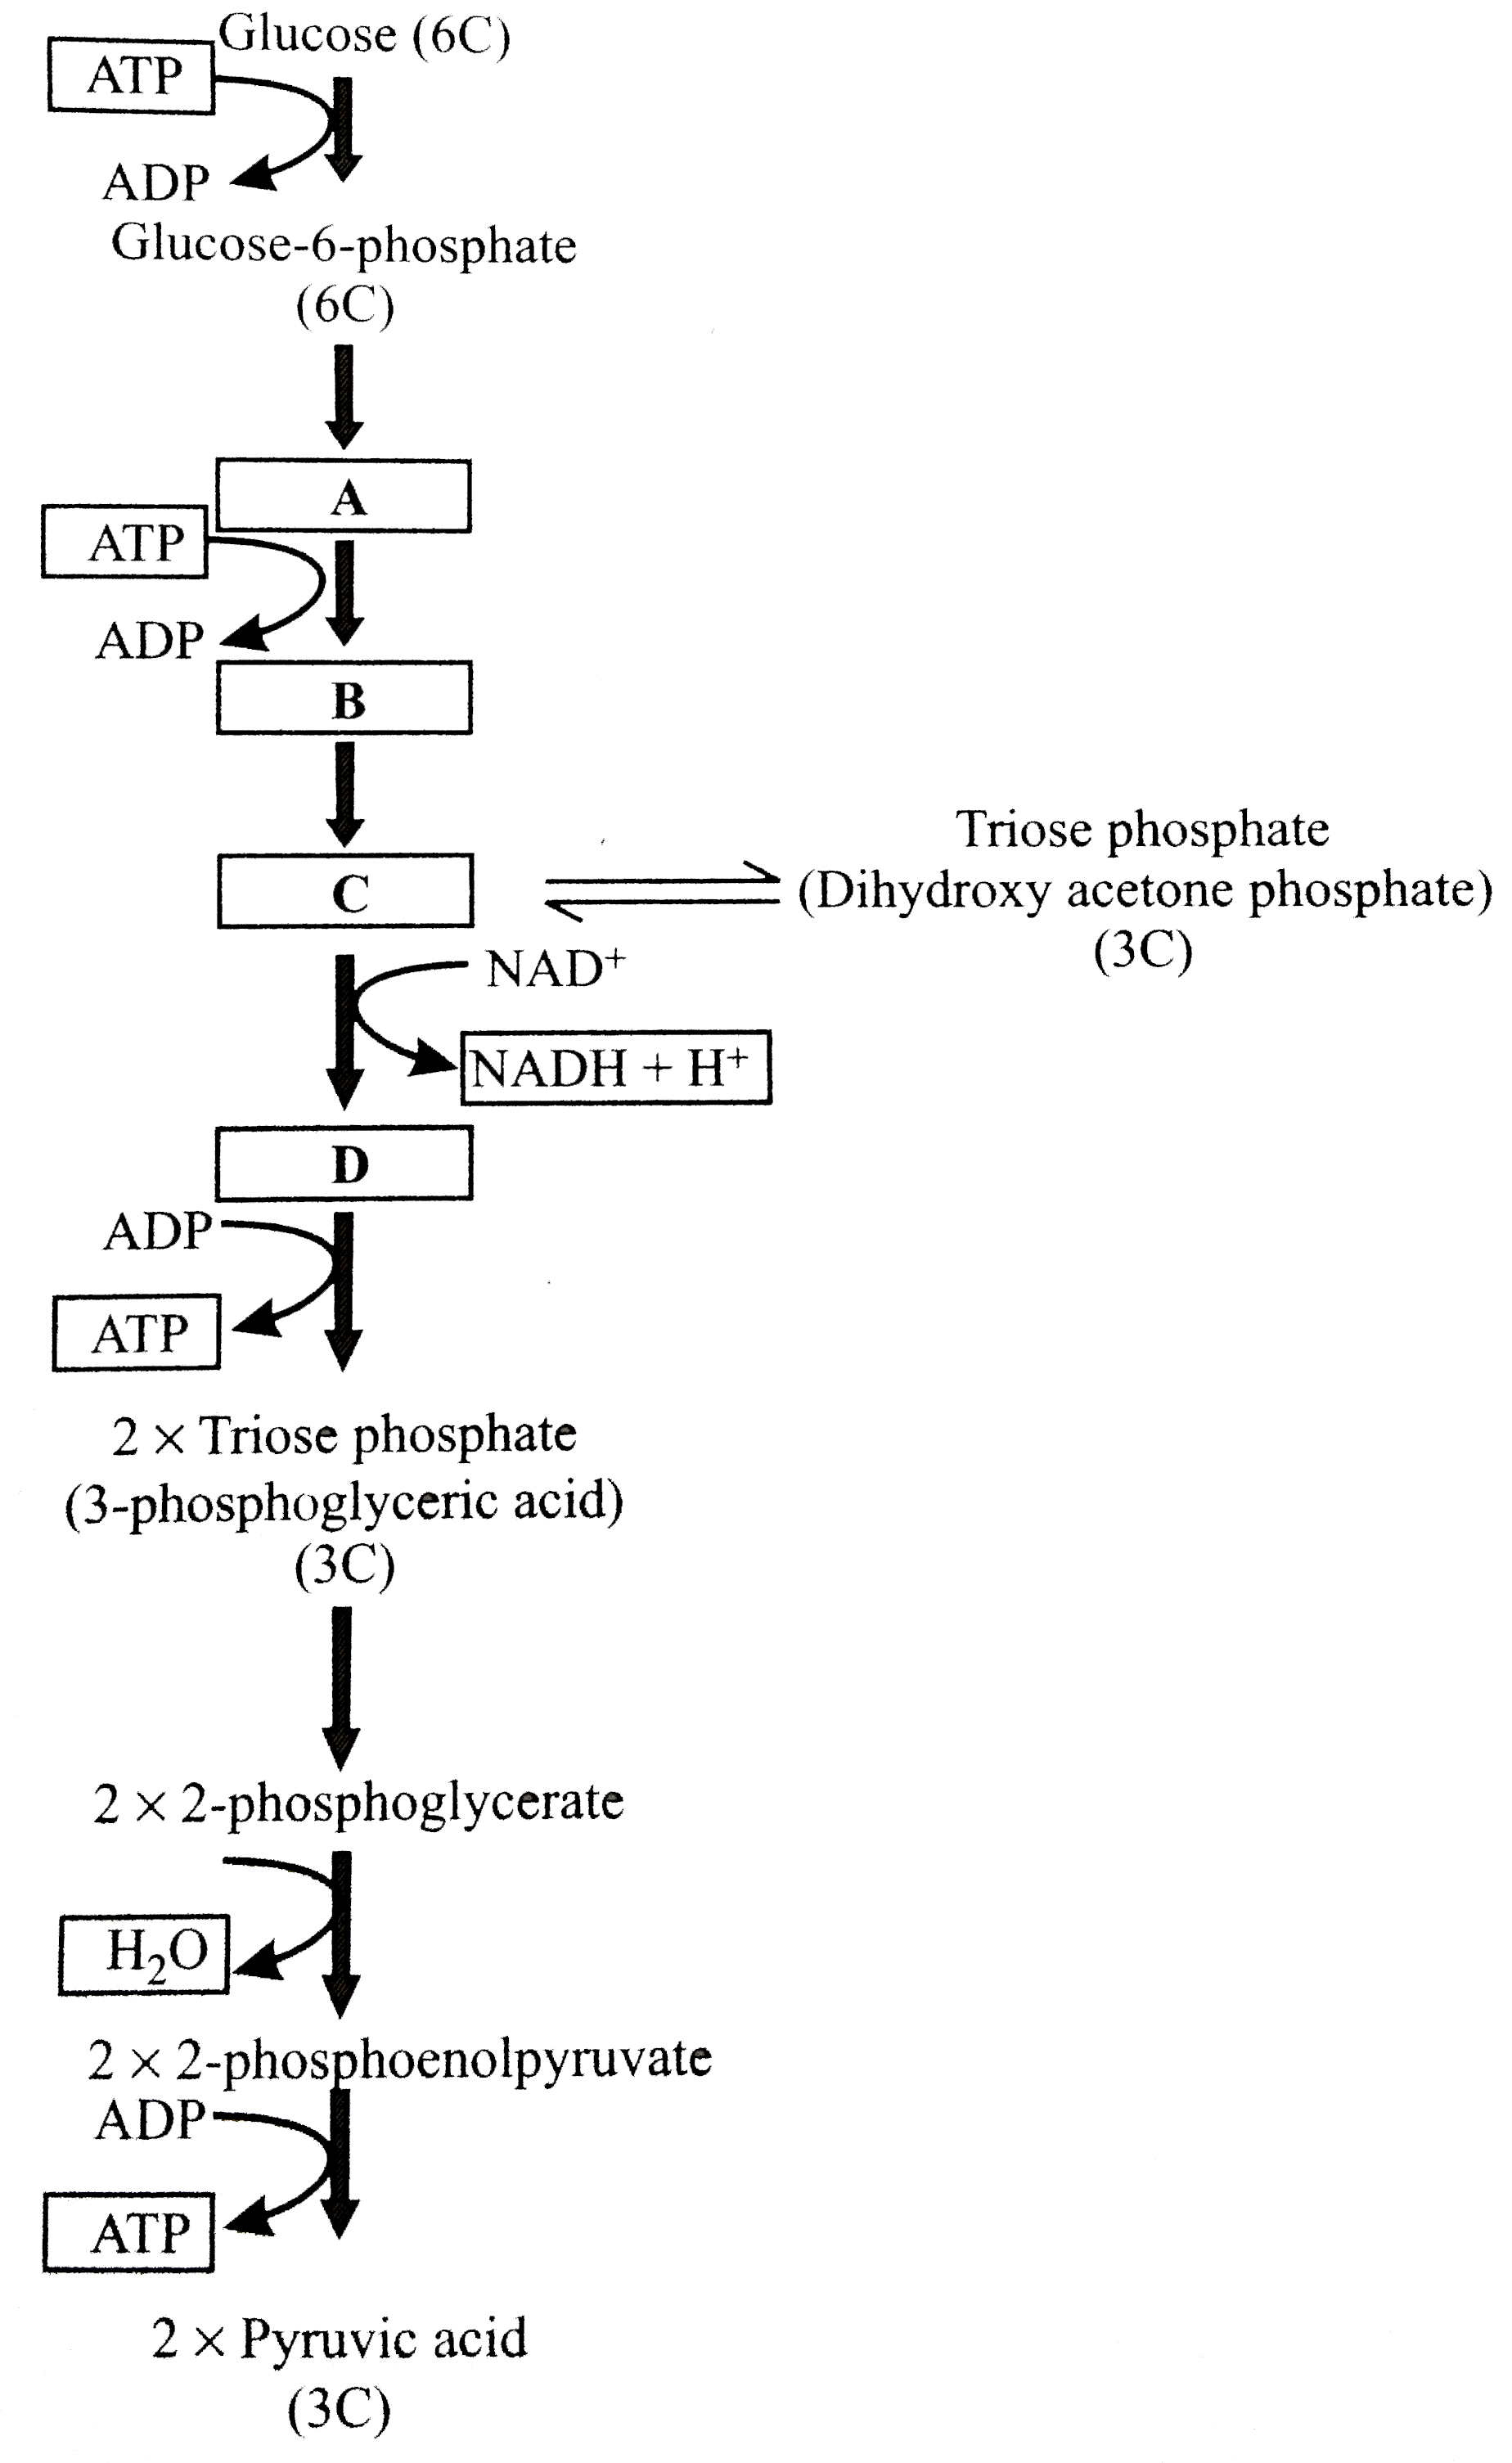
View SolutionThe flow chart given below shows the steps in glycolysis. Select the option that correctly fills in the missing steps A,B,C and D.
View Solution

