The figure showing the correct relationship between the stopping potential V and the frequency v of the light for potassium and tungsten is
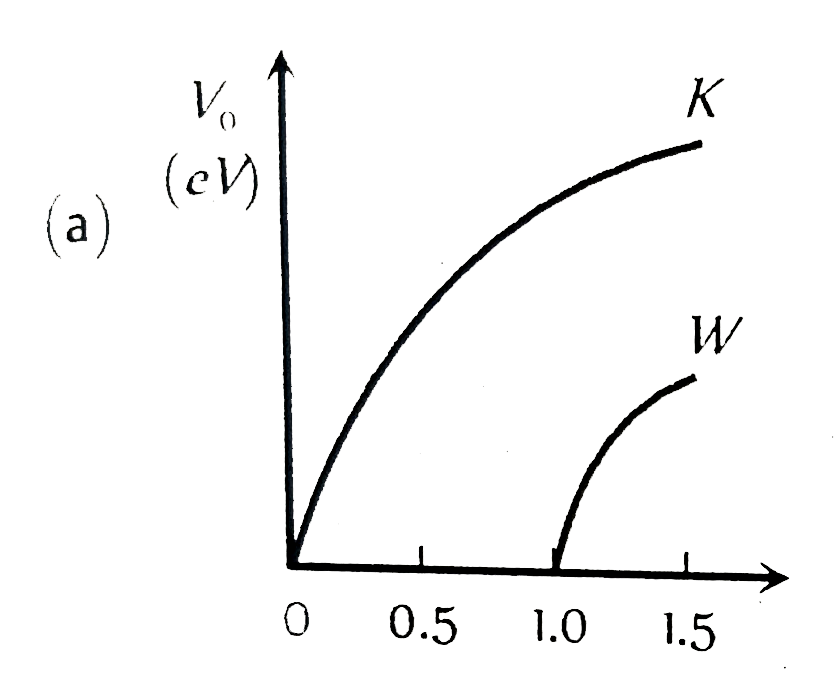
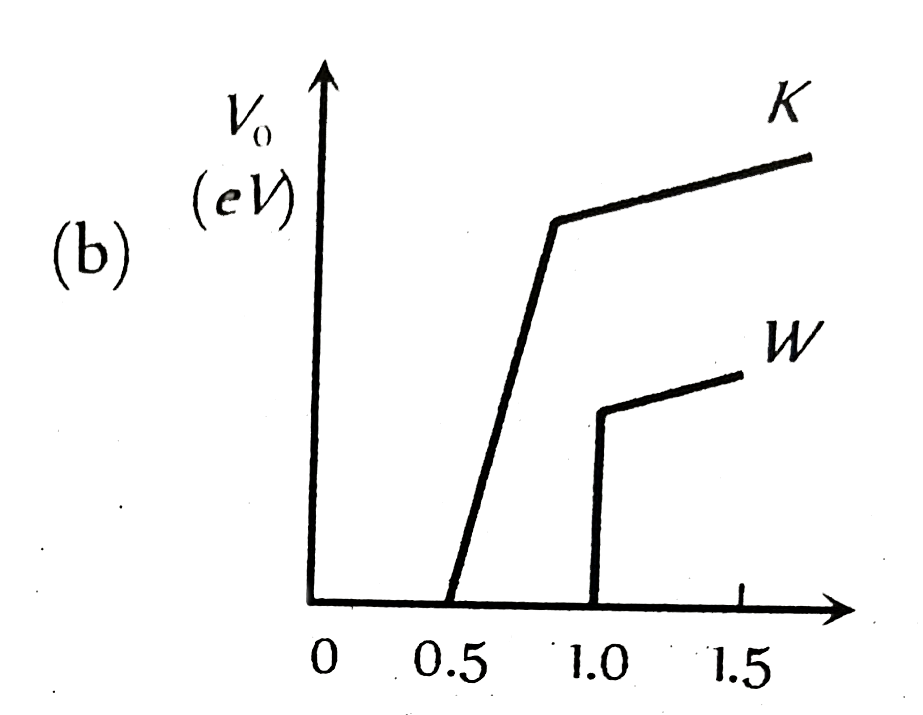
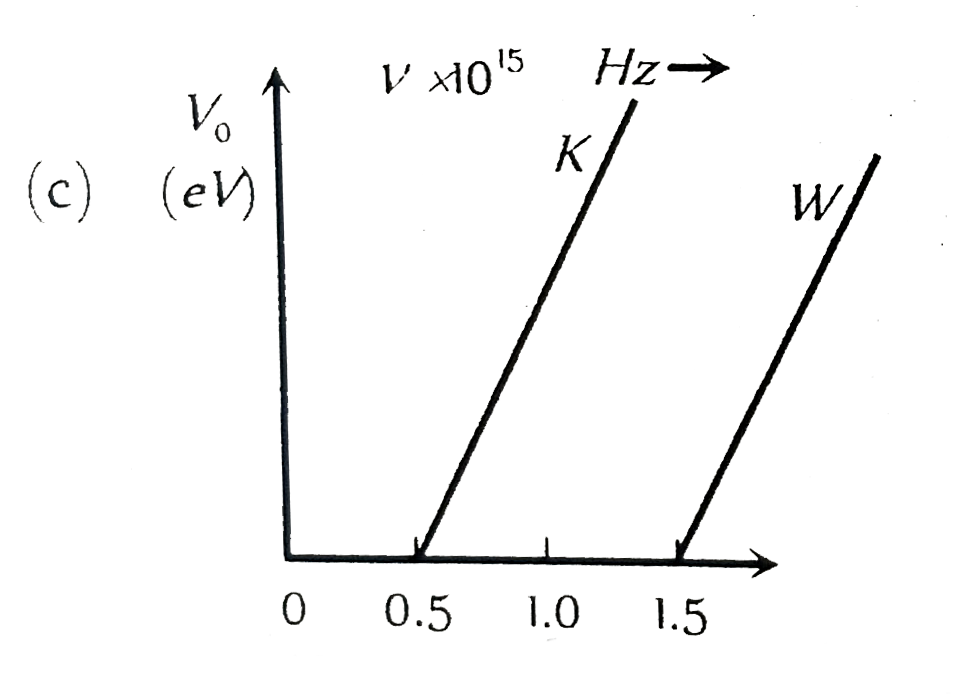
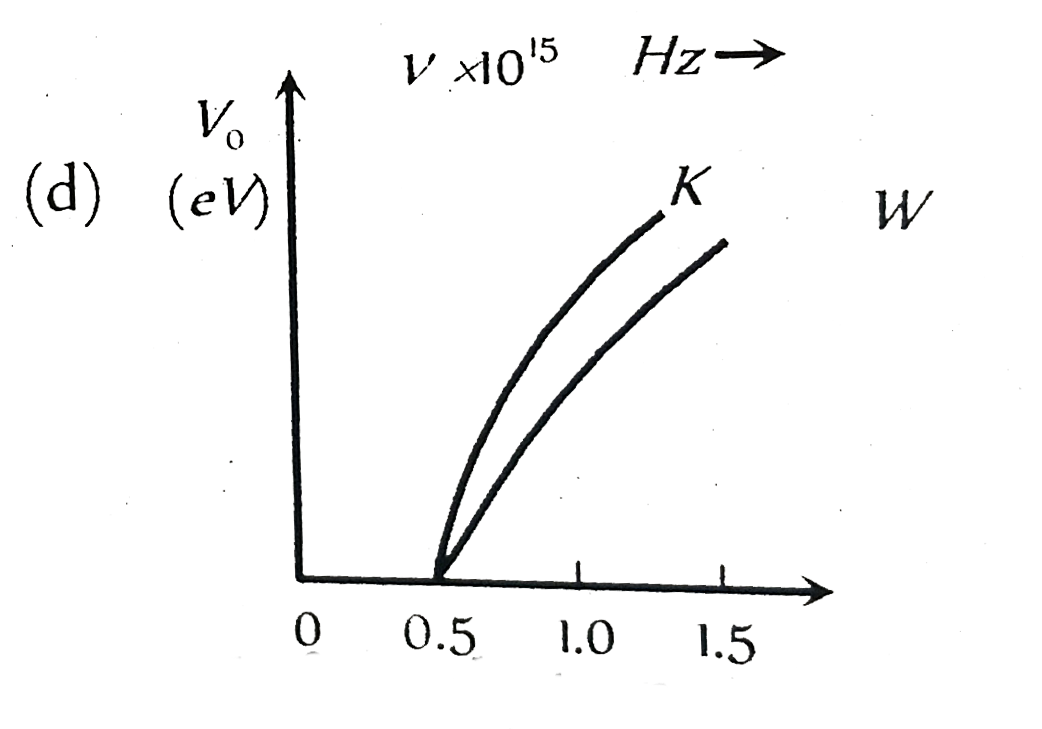
The correct Answer is:C
Topper's Solved these Questions
- ELECTRON, PHOTON, PHOTOELECTRIC EFFECT AND X-RAYSBOOK - ERRORLESS CHAPTER - ELECTRON, PHOTON, PHOTOELECTRIC EFFECT AND X-RAYSEXERCISE - Assertion & Reason
3 Videos
- ELECTRON, PHOTON, PHOTOELECTRIC EFFECT AND X-RAYSBOOK - ERRORLESS CHAPTER - ELECTRON, PHOTON, PHOTOELECTRIC EFFECT AND X-RAYSEXERCISE - Self Evaluation Test
3 Videos
- ELECTRON, PHOTON, PHOTOELECTRIC EFFECT AND X-RAYSBOOK - ERRORLESS CHAPTER - ELECTRON, PHOTON, PHOTOELECTRIC EFFECT AND X-RAYSEXERCISE - Critical Thinking
1 Videos
- ELECTRO MAGNETIC INDUCTIONBOOK - ERRORLESS CHAPTER - ELECTRO MAGNETIC INDUCTIONEXERCISE - SET
20 Videos
- ELECTRONICSBOOK - ERRORLESS CHAPTER - ELECTRONICSEXERCISE - Selv Evaluation Test
23 Videos
Similar Questions
Graph between stopping potential and frequency of light as shown find the work function
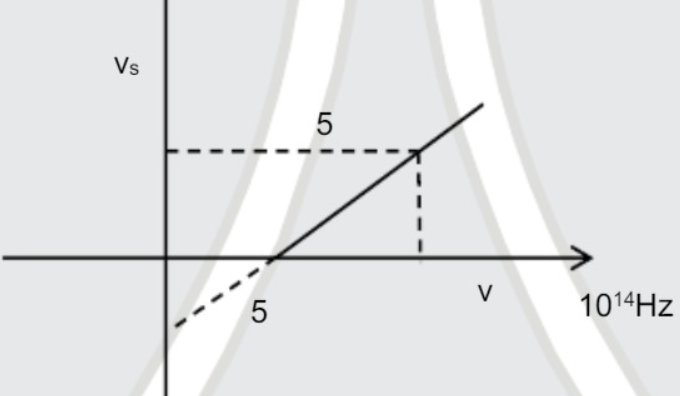
View SolutionThe figure shows different graphs between stopping potential (V0) and frequency (v) for photosensitive surface of cesium , potassium , sodium and lithium. The plots are parallel. Correct ranking of the targets according to their work function greatest forst will be

View Solution
Knowledge Check
Choose the graph showing the correct relationship between the stopping potential V0 and the frequency v of light for potassium and tungsten.
A B
B C
C D
D
The stopping potential (V0)
ADepends upon the angle of incident lightBDepends upon the intensity of incident lightCDepends upon the surface nature of the substanceDIs independent of the intensity of the incident lightThe correct curve between the stopping potential (V) and intensity of incident light (I) is
A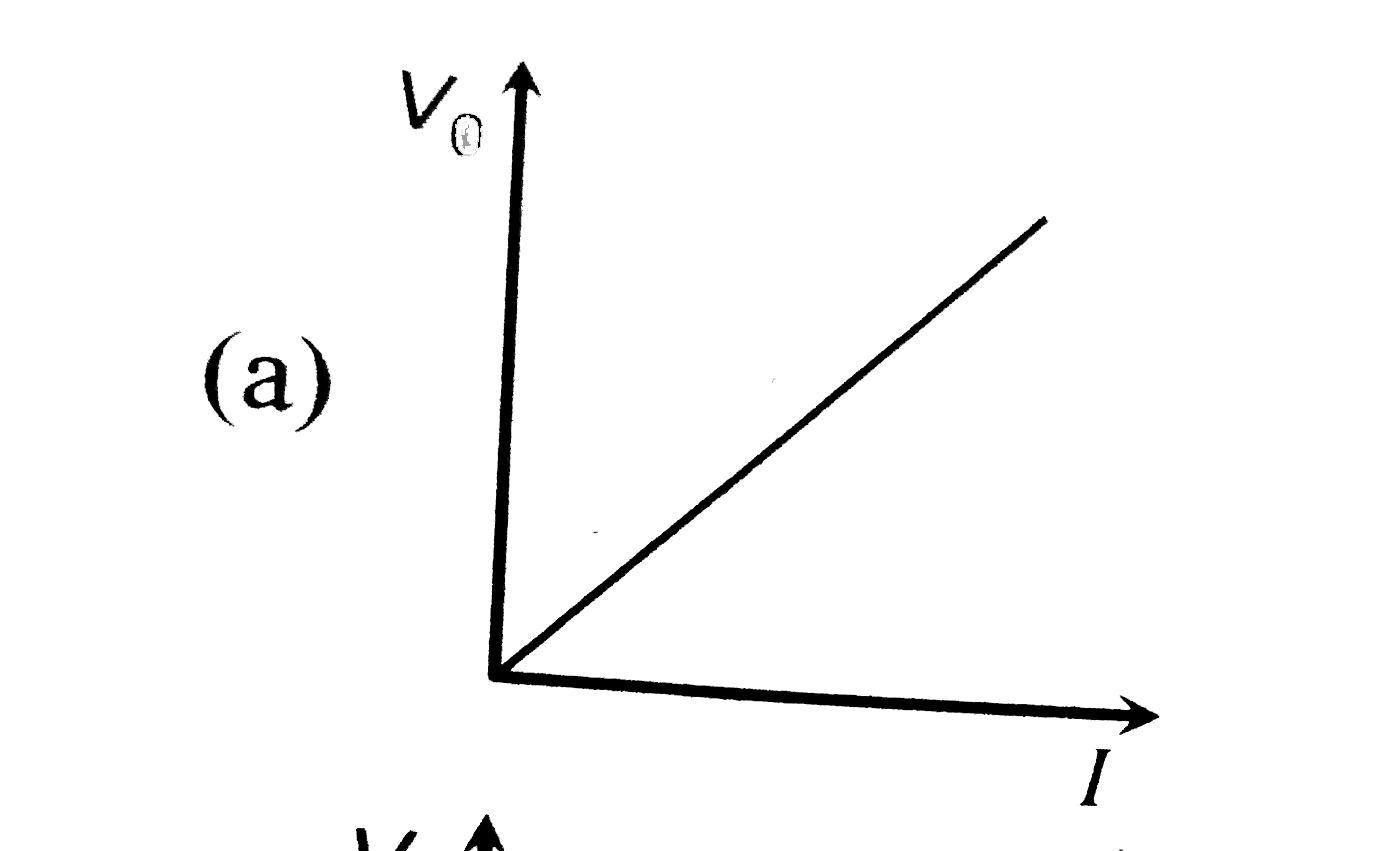 B
B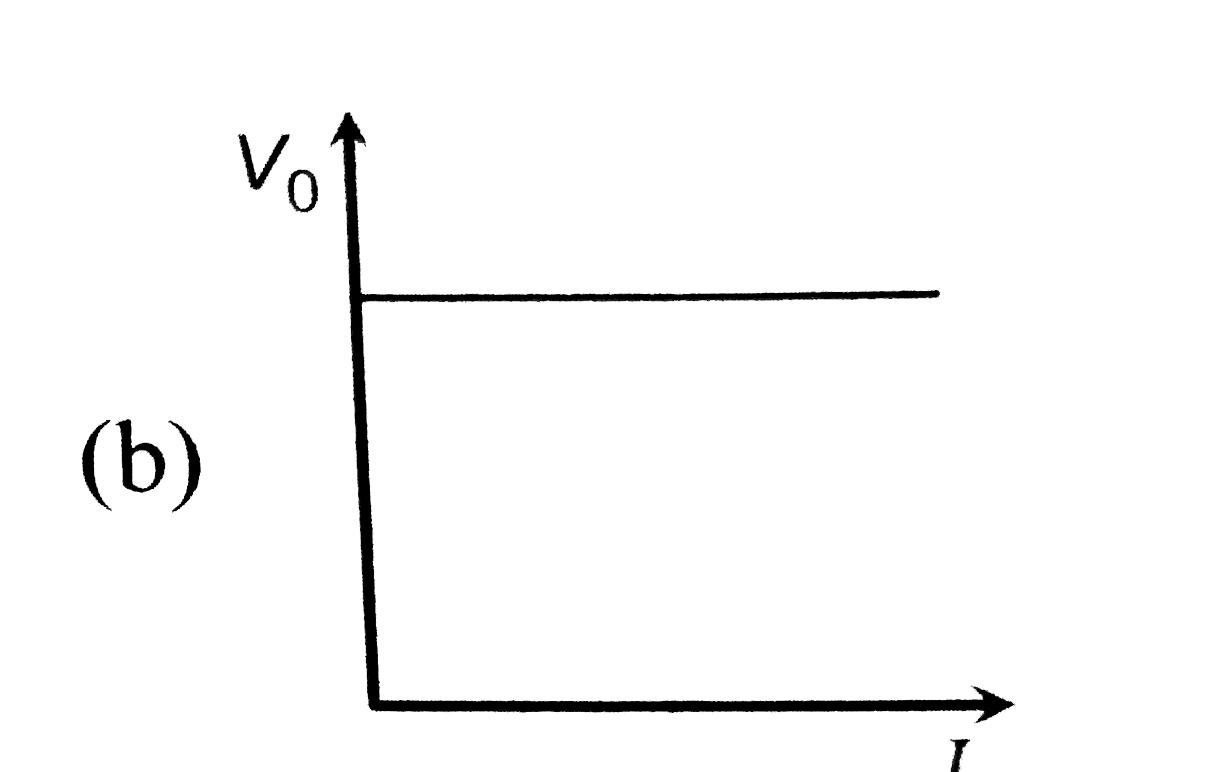 C
C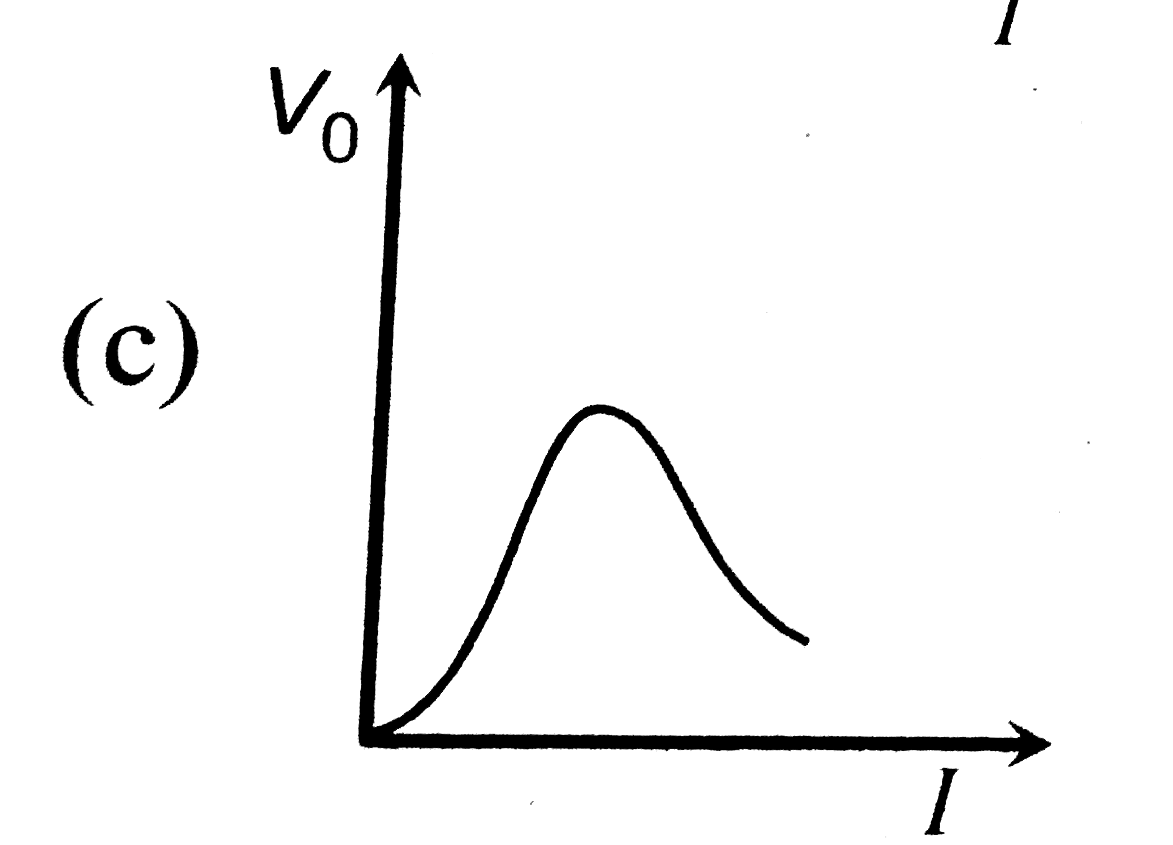 D
D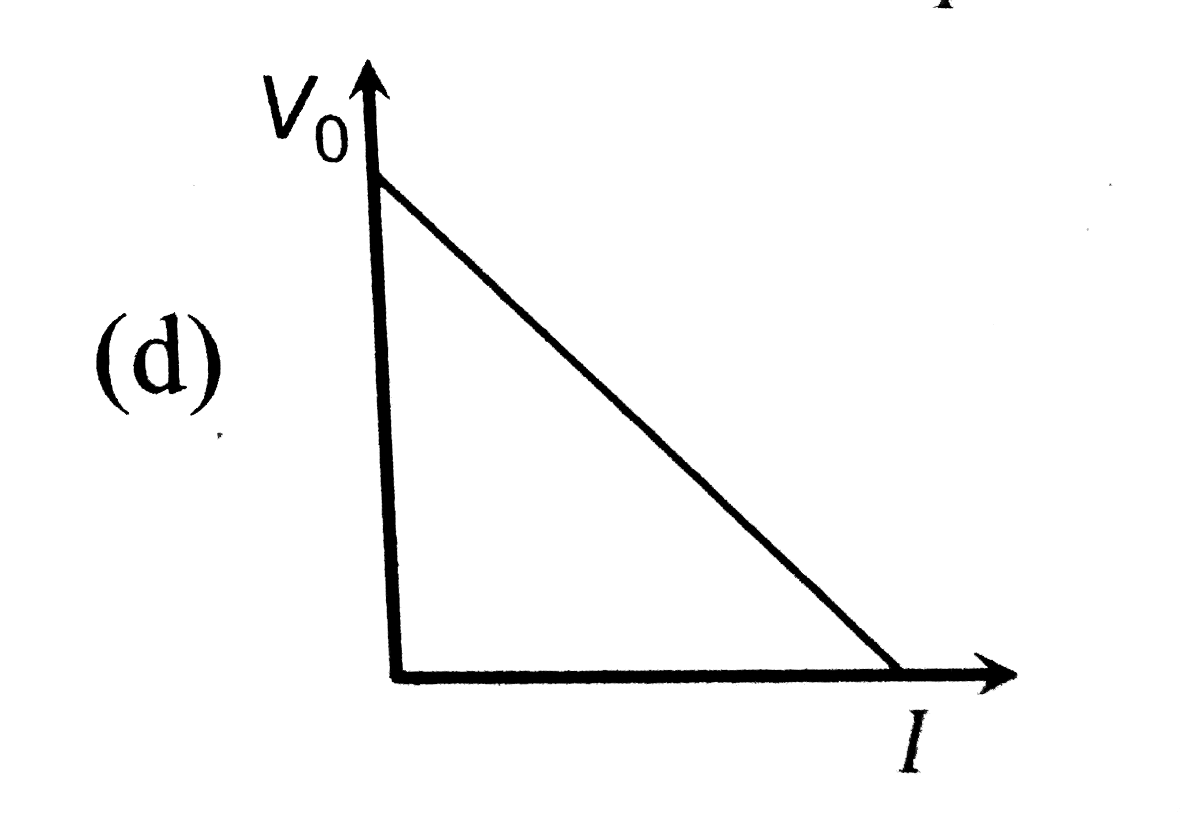
The figure shows the variation of stopping potential VQ with the frequency v of the incident radiations for two photosensitive metals P and
Which metal has smaller threshold wavelength ? Justify your answer.
View SolutionGraph between stopping potential and frequency of light as shown find the work function

View SolutionThe figure shows different graphs between stopping potential (V0) and frequency (v) for photosensitive surface of cesium , potassium , sodium and lithium. The plots are parallel. Correct ranking of the targets according to their work function greatest first will be

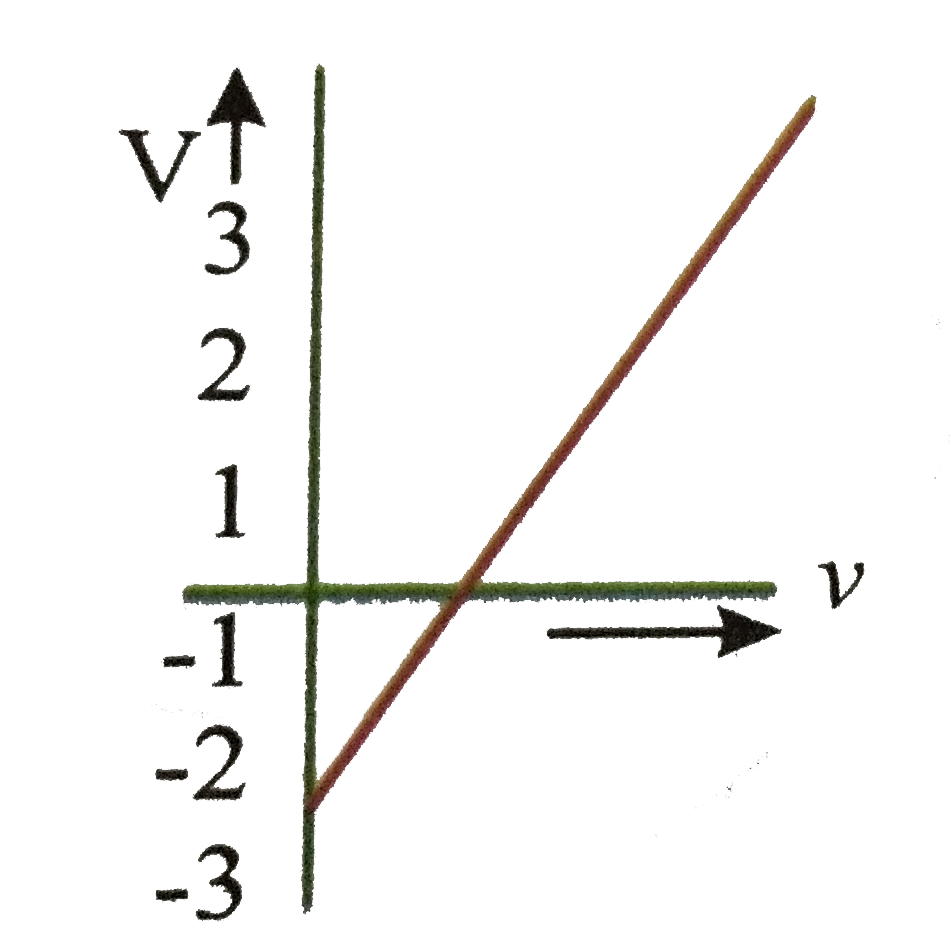
View SolutionFrom the graph shown, the value of work function if the stopping potential (V), and frequency of the incident light vare on y and x-axes respectively is
View SolutionFigure show the variation of the stopping potential (V0) with the frequency (v) of the incident radiations for two different photosensitive matererial M1 and M2 What are the values of work functions for M1 and M2 respectively
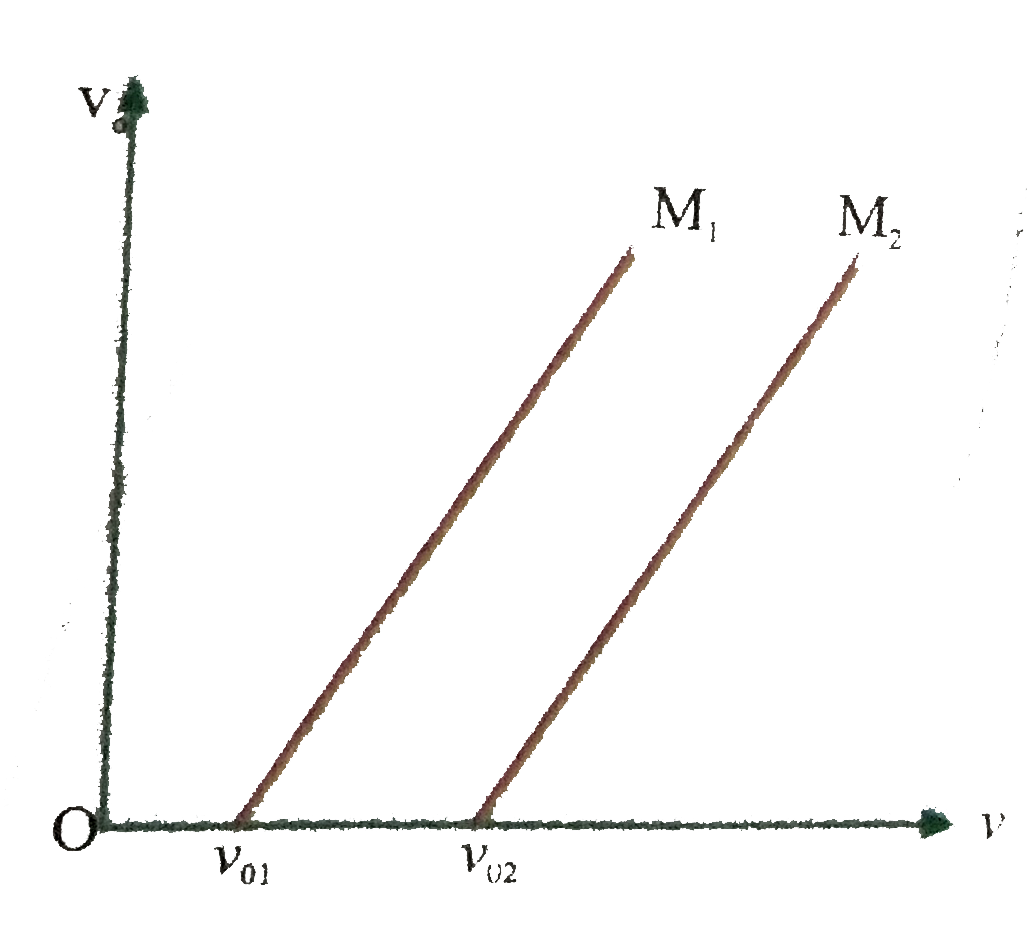
View Solution
