Which of the following does not vary with plate or grid voltages
g.
R
μ
Each of them varies
The correct Answer is:D
Step by step video, text & image solution for Which of the following does not vary with plate or grid voltages by Physics experts to help you in doubts & scoring excellent marks in Class 12 exams.
Updated on:21/07/2023Topper's Solved these Questions
- ELECTRONICSBOOK - ERRORLESS CHAPTER - ELECTRONICSEXERCISE - Digital Electronics
2 Videos
- ELECTRONICSBOOK - ERRORLESS CHAPTER - ELECTRONICSEXERCISE - Valve Electronics (Diode and Triode)
3 Videos
- ELECTRON, PHOTON, PHOTOELECTRIC EFFECT AND X-RAYSBOOK - ERRORLESS CHAPTER - ELECTRON, PHOTON, PHOTOELECTRIC EFFECT AND X-RAYSEXERCISE - Self Evaluation Test
3 Videos
- ELECTROSTATICS BOOK - ERRORLESS CHAPTER - ELECTROSTATICS EXERCISE - Ordinary Thinking Objective Questions (Electric Flux and Gauss.s Law)
28 Videos
Similar Questions
Knowledge Check
Which of the following represent voltage?
Aworkdonecurrent×timeBworkdone×chargeCworkdone×timecurrentDworkdone×chargetimeWhich of the following represents voltage ?
AWork doneCurrent×TimeBWork done × ChargeCWork done×TimeCurrentDWork done × Charge × TimeWhich of the following represents voltage?
AWork donecurrent×TimeBWork done×ChargeCWork done×TimeCurrentDWork done×ChargeTime
Which of the following represents voltage?
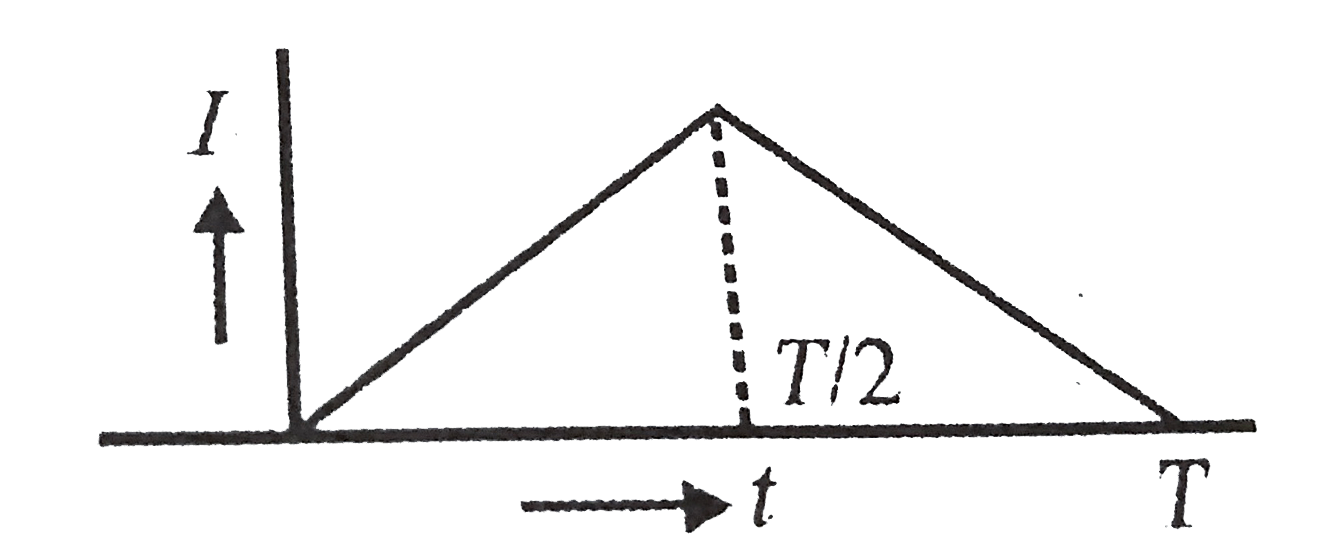
View SolutionThe current (I) in the inductance is varying with time according to the plot shown in figure
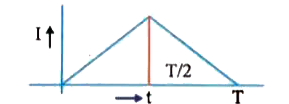
Which one of the following is the correct variation of voltage with time in the coil ?
View SolutionThe current (I) in the inductance is varying with time acroding to the plot shown in figure.
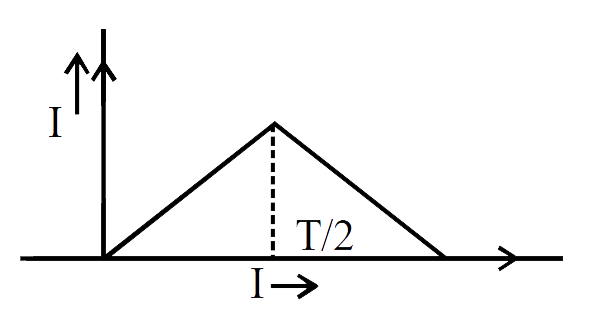
Which one of thhe following is the correct variation of voltage with time in the coil ?
View SolutionAn alternating current I in an inductance coil varies with time t according to the graph as shown: Which one of the following graph gives the variation of voltage with time?
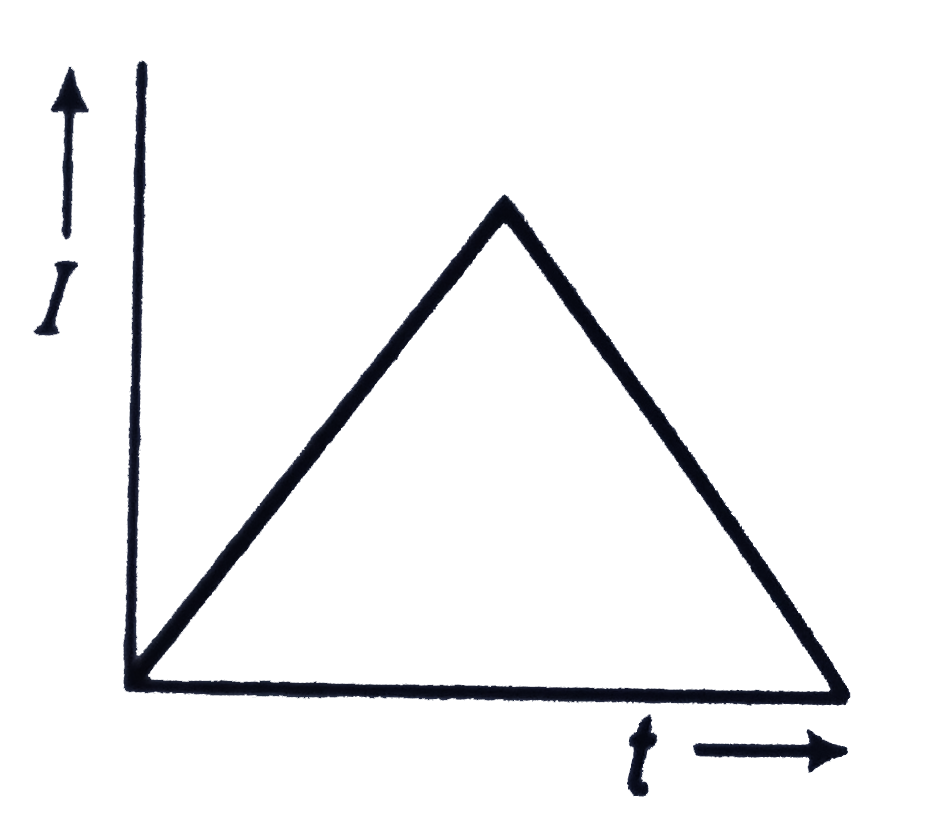
View SolutionThe current I in an inductance coil varies with time according to the graph given in the figure.
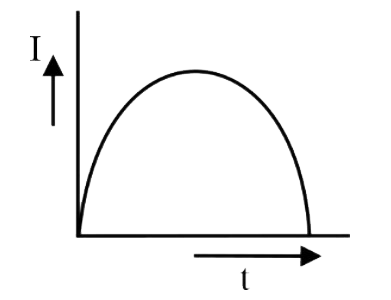
Which one of the following graphs gives the variation of voltage with time across the inductor?
View Solution

