Draw a graph representing the change in specific resistance with temperature.
Text Solution
Let a' be the coefficient of linear expansion and a be the temperature coefficient of resistance of the material of the conductor.
IF the resistivity of the material of the conductor at 0∘C and t∘C and ρ0 and ρ respectively then,
ρ=ρ0[1+(a+a')t]
or,ρ=ρ0(a+a')t+ρ0
IT is similar to the general equation of straight line i.e.,
y=mx+c
ρ−t plot is shown in the fig.1.101

|
Topper's Solved these Questions
- CURRENT ELECTRICITY BOOK - CHHAYA PUBLICATIONCHAPTER - CURRENT ELECTRICITY EXERCISE - EXAMINATION ARCHIVE WITH SOLUTIONS(WBJEE)
8 Videos
- CURRENT ELECTRICITY BOOK - CHHAYA PUBLICATIONCHAPTER - CURRENT ELECTRICITY EXERCISE - EXAMINATION ARCHIVE WITH SOLUTIONS(JEE MAIN)
4 Videos
- CURRENT ELECTRICITY BOOK - CHHAYA PUBLICATIONCHAPTER - CURRENT ELECTRICITY EXERCISE - ENTRANCE CORNER(INTEGER ANSWER TYPE)
5 Videos
- COMMUNICATION STSTEMBOOK - CHHAYA PUBLICATIONCHAPTER - COMMUNICATION STSTEMEXERCISE - CBSE SCANNER
28 Videos
- DIFFRACTION AND POLARISATION OF LIGHTBOOK - CHHAYA PUBLICATIONCHAPTER - DIFFRACTION AND POLARISATION OF LIGHTEXERCISE - CBSE SCANNER
27 Videos
Similar Questions
Knowledge Check
which of the following graph represents the variation of resistivity (ρ) with temperature (T) for copper?
A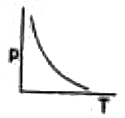 B
B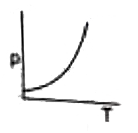 C
C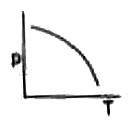 D
D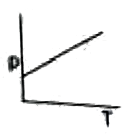
Which one of the following graphs represents variation of specific heat capacity of water with temperature?
A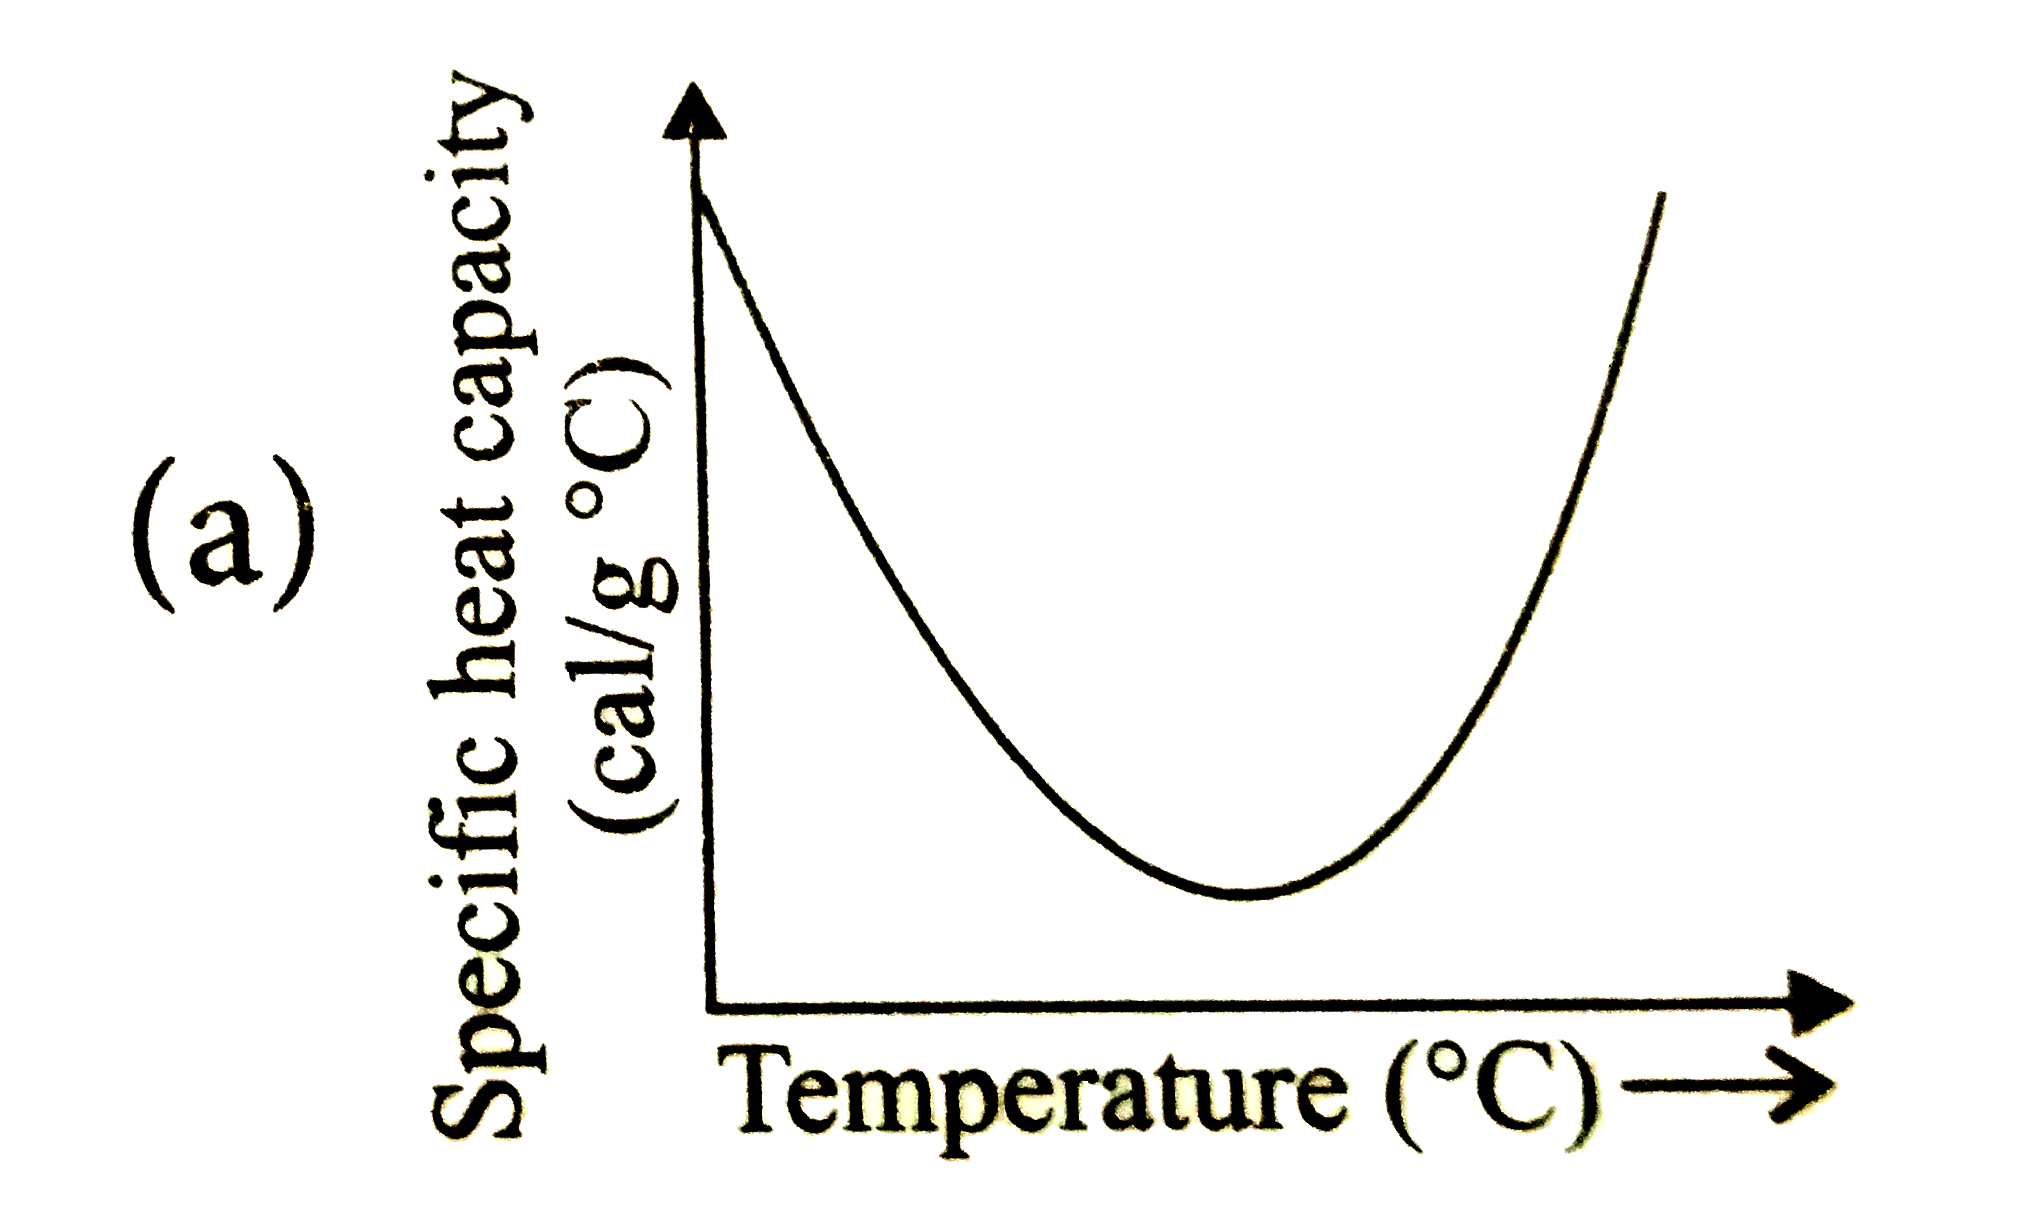 B
B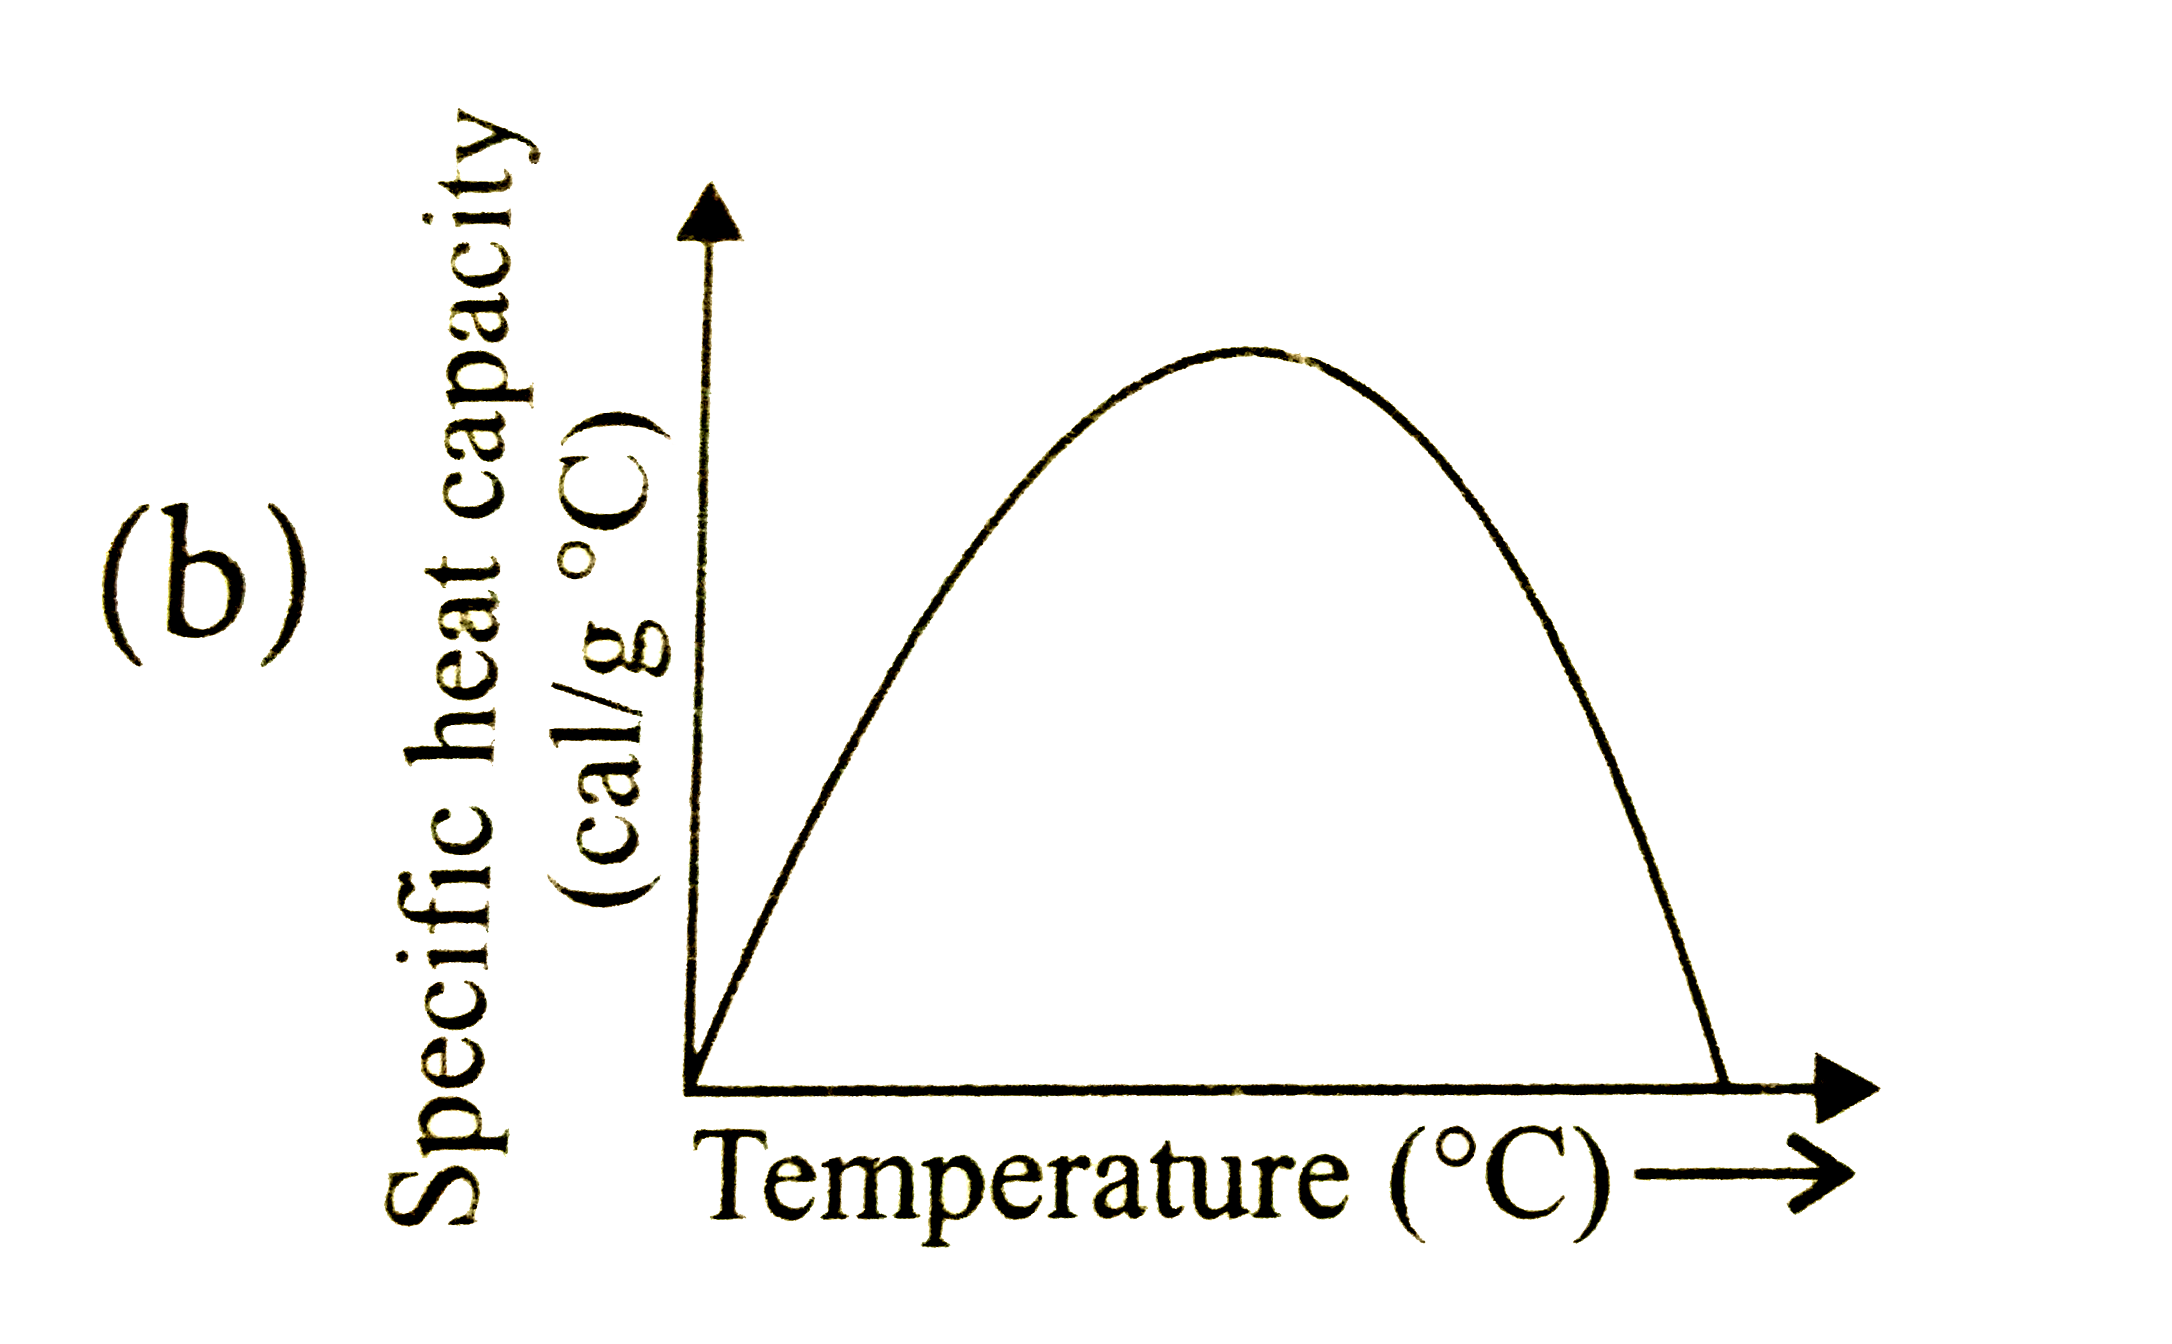 C
C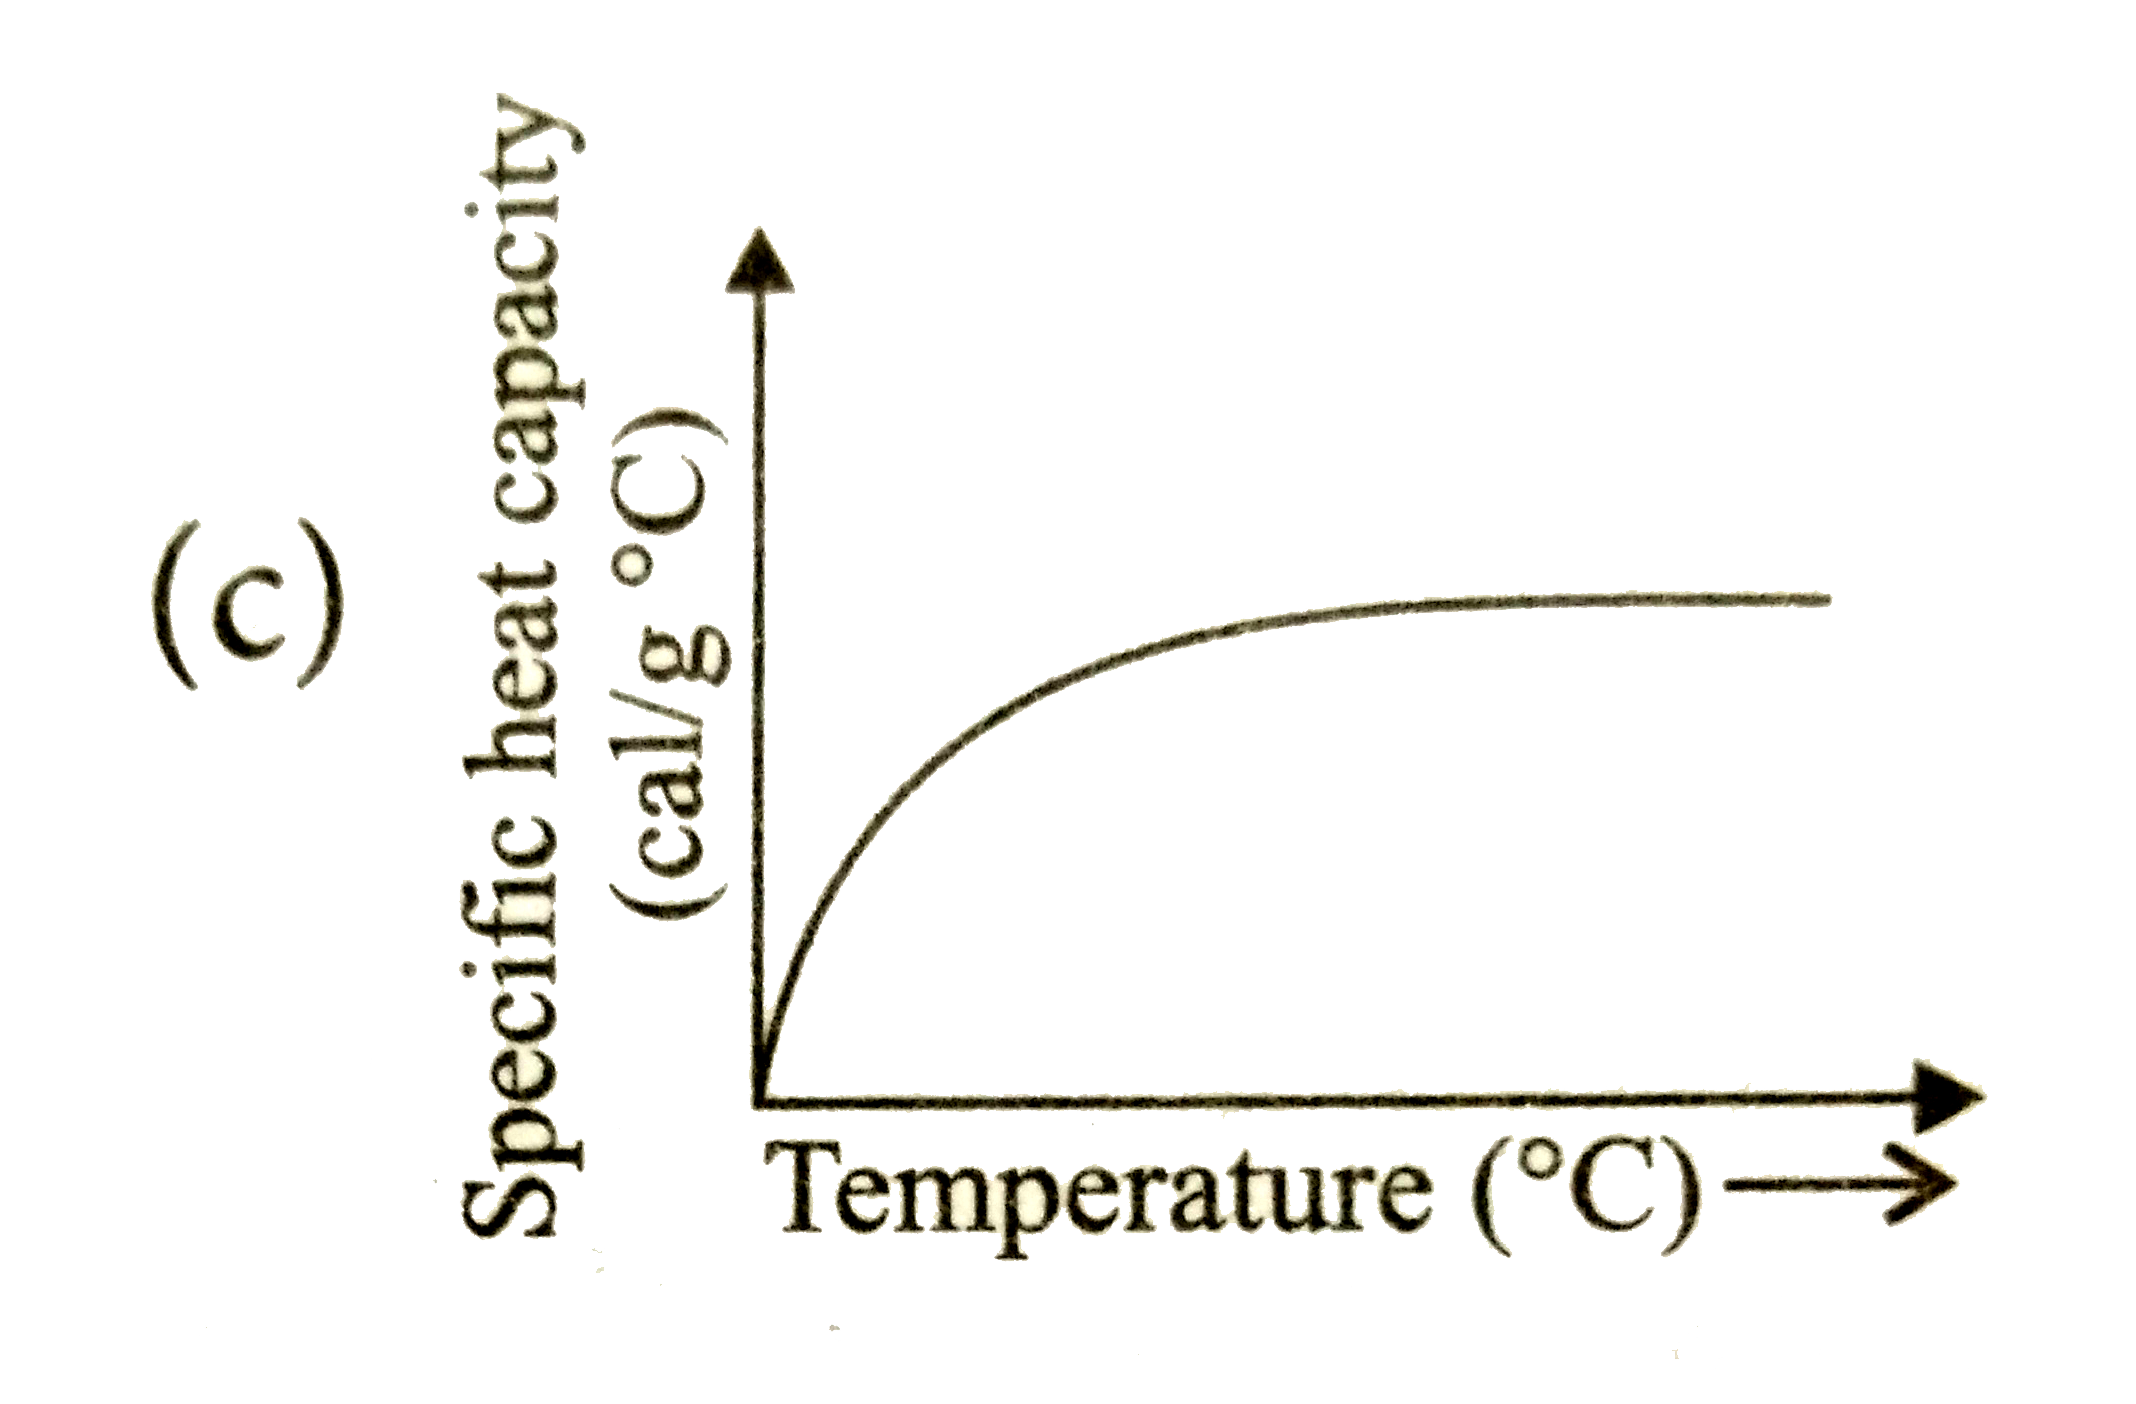 D
D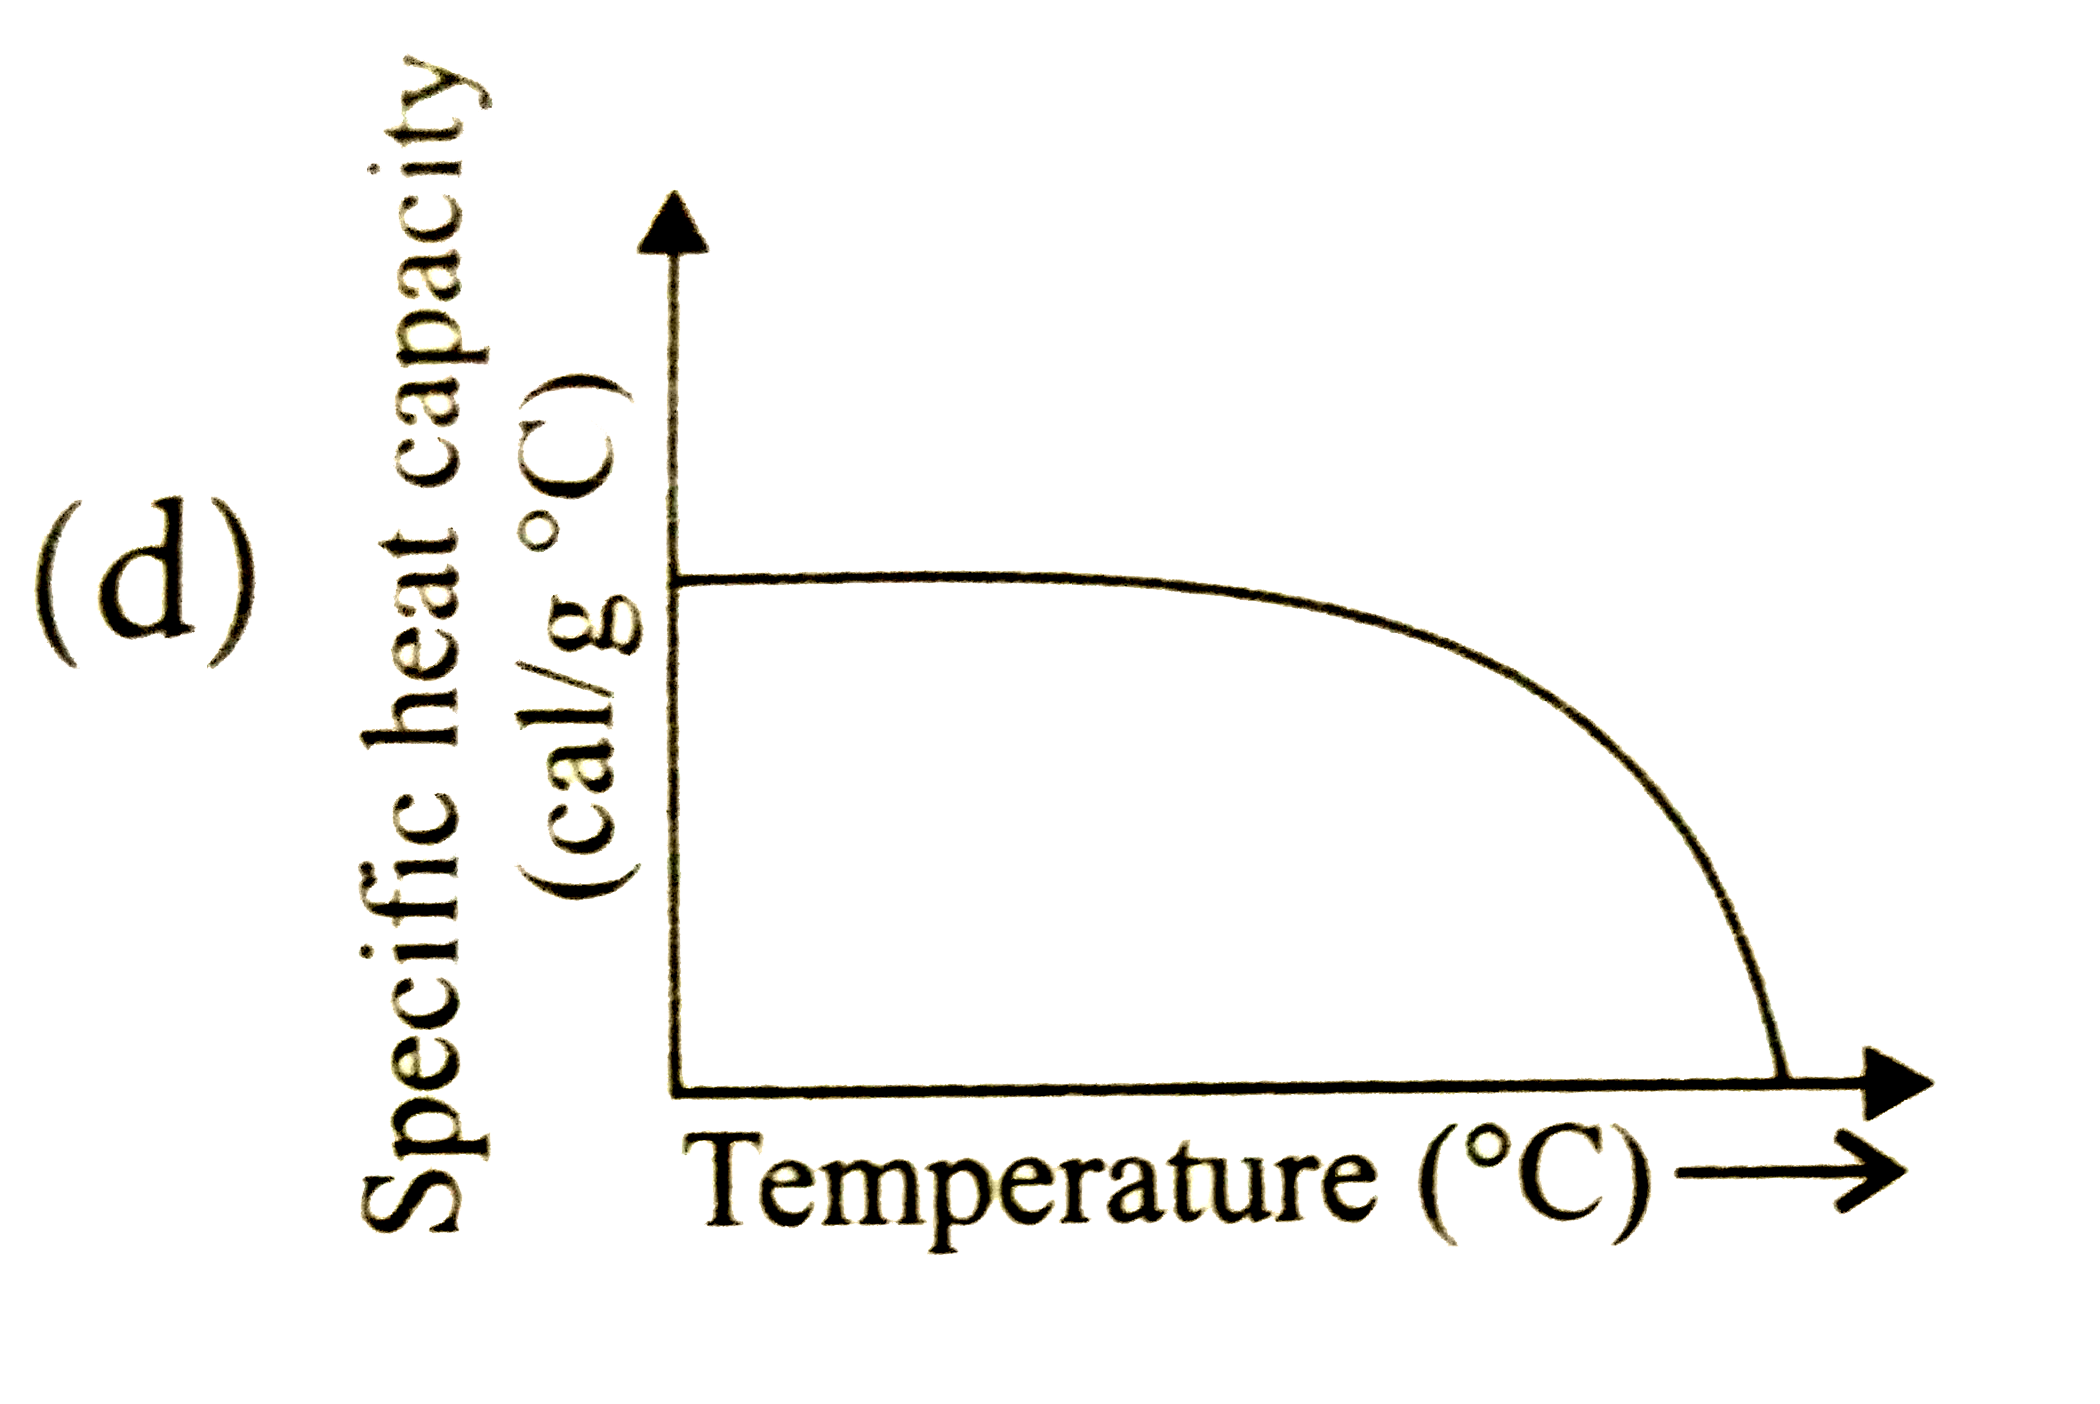
Which one of the following graphs represents variation of specific heat capacity of water with temperature?
A B
B C
C D
D
Draw a graph showing the variation of resistivity with temperature for nichrome. Which property of nichrome is used to make standard resistance coils?
View SolutionDefine the terms resistivity and conductivity and state their S. I. units. Draw a graph showing the variation of resistivity with temperature for a typical semiconductor.
View SolutionDraw labelled graphs to show how electrical resistance varies with temperature for :
(i) a metallic wire.
(ii) a piece of carbon
View SolutionDraw a graph showing variation of resistivity with temperature for nichrome. Which property of nichrome is used to make standard resistance coils ?
View SolutionBy increasing the temperature, the specific resistance of a conductor and a semiconductor
View Solution
