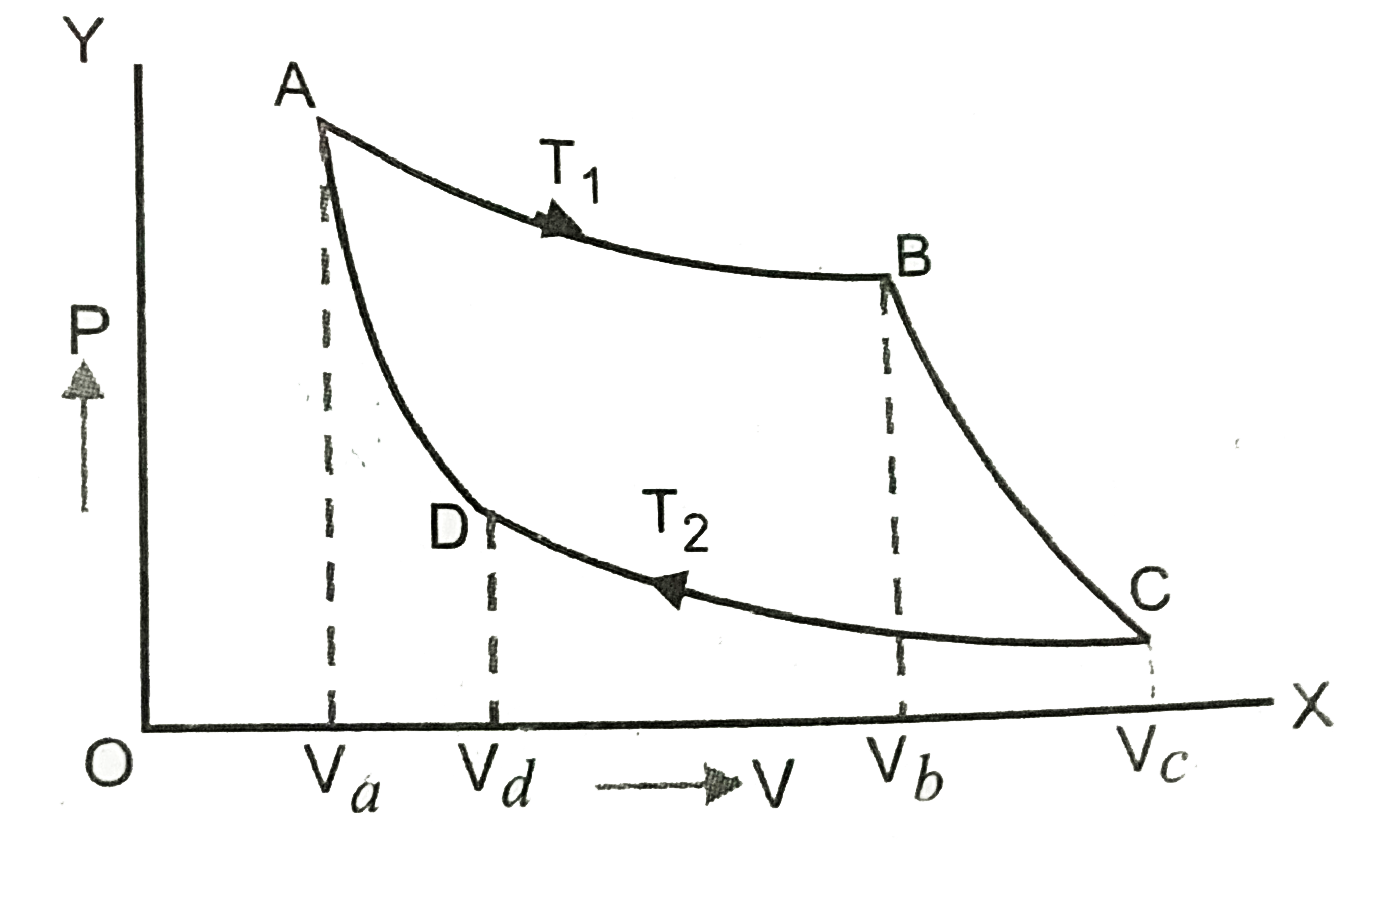
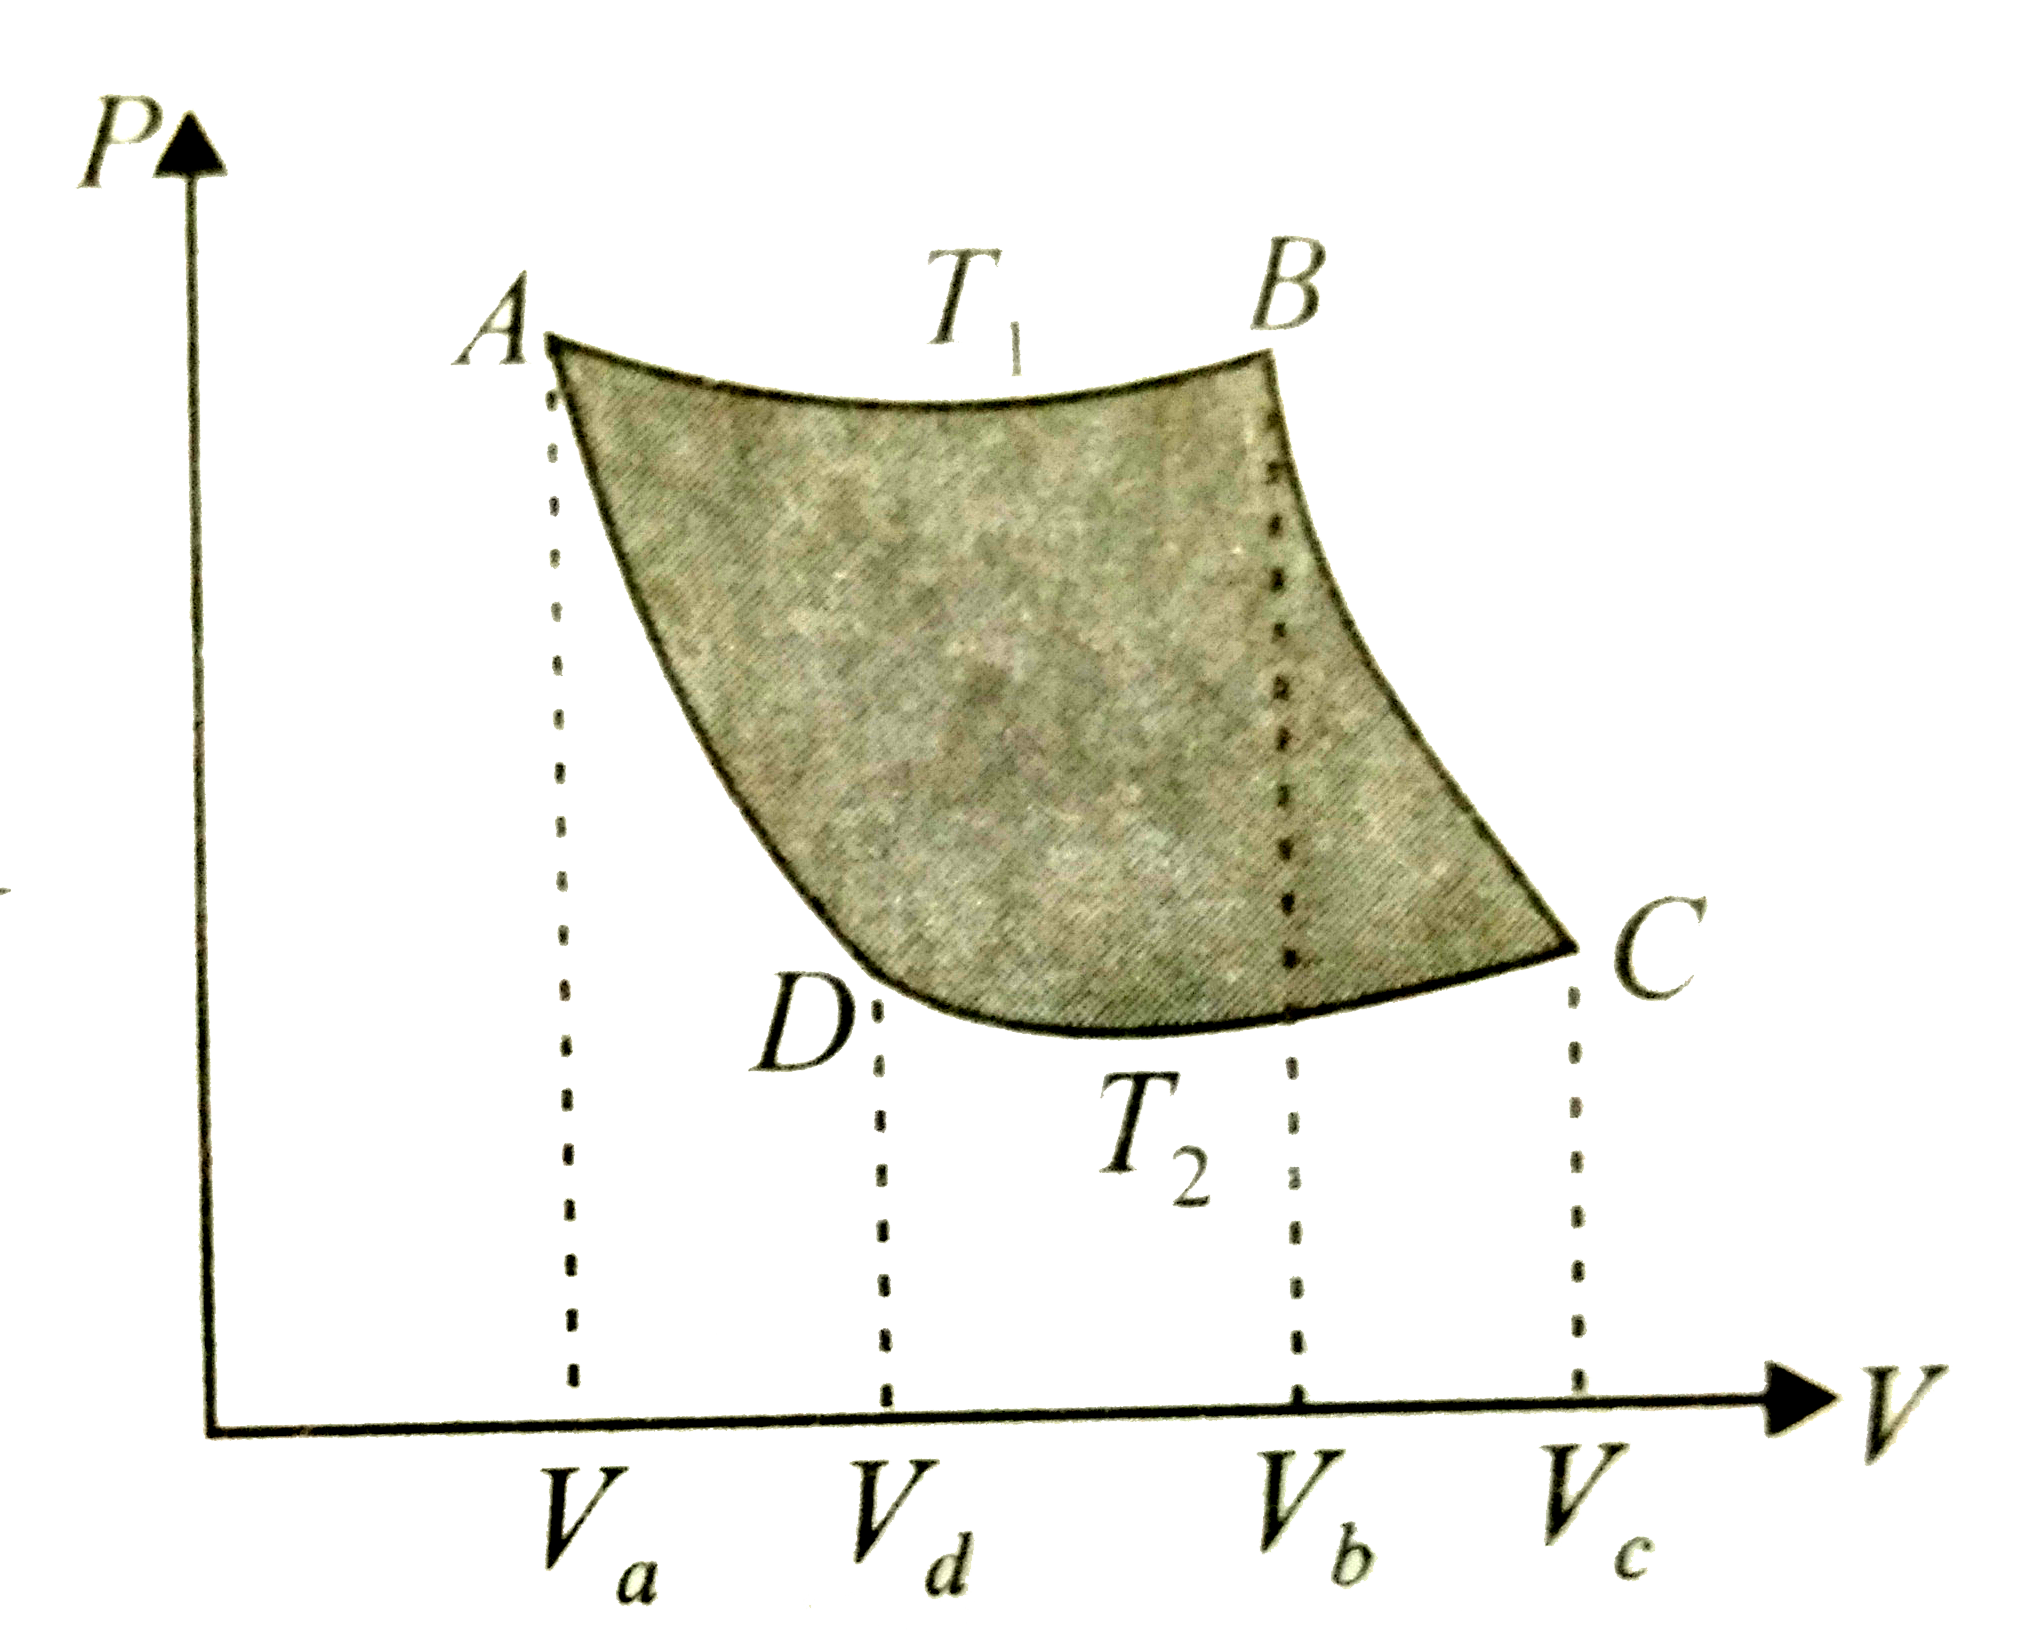
In the following P-V diagram two adiabatics cut two isothermals at temperature T1andT2 (fig). The value of VaVd will be
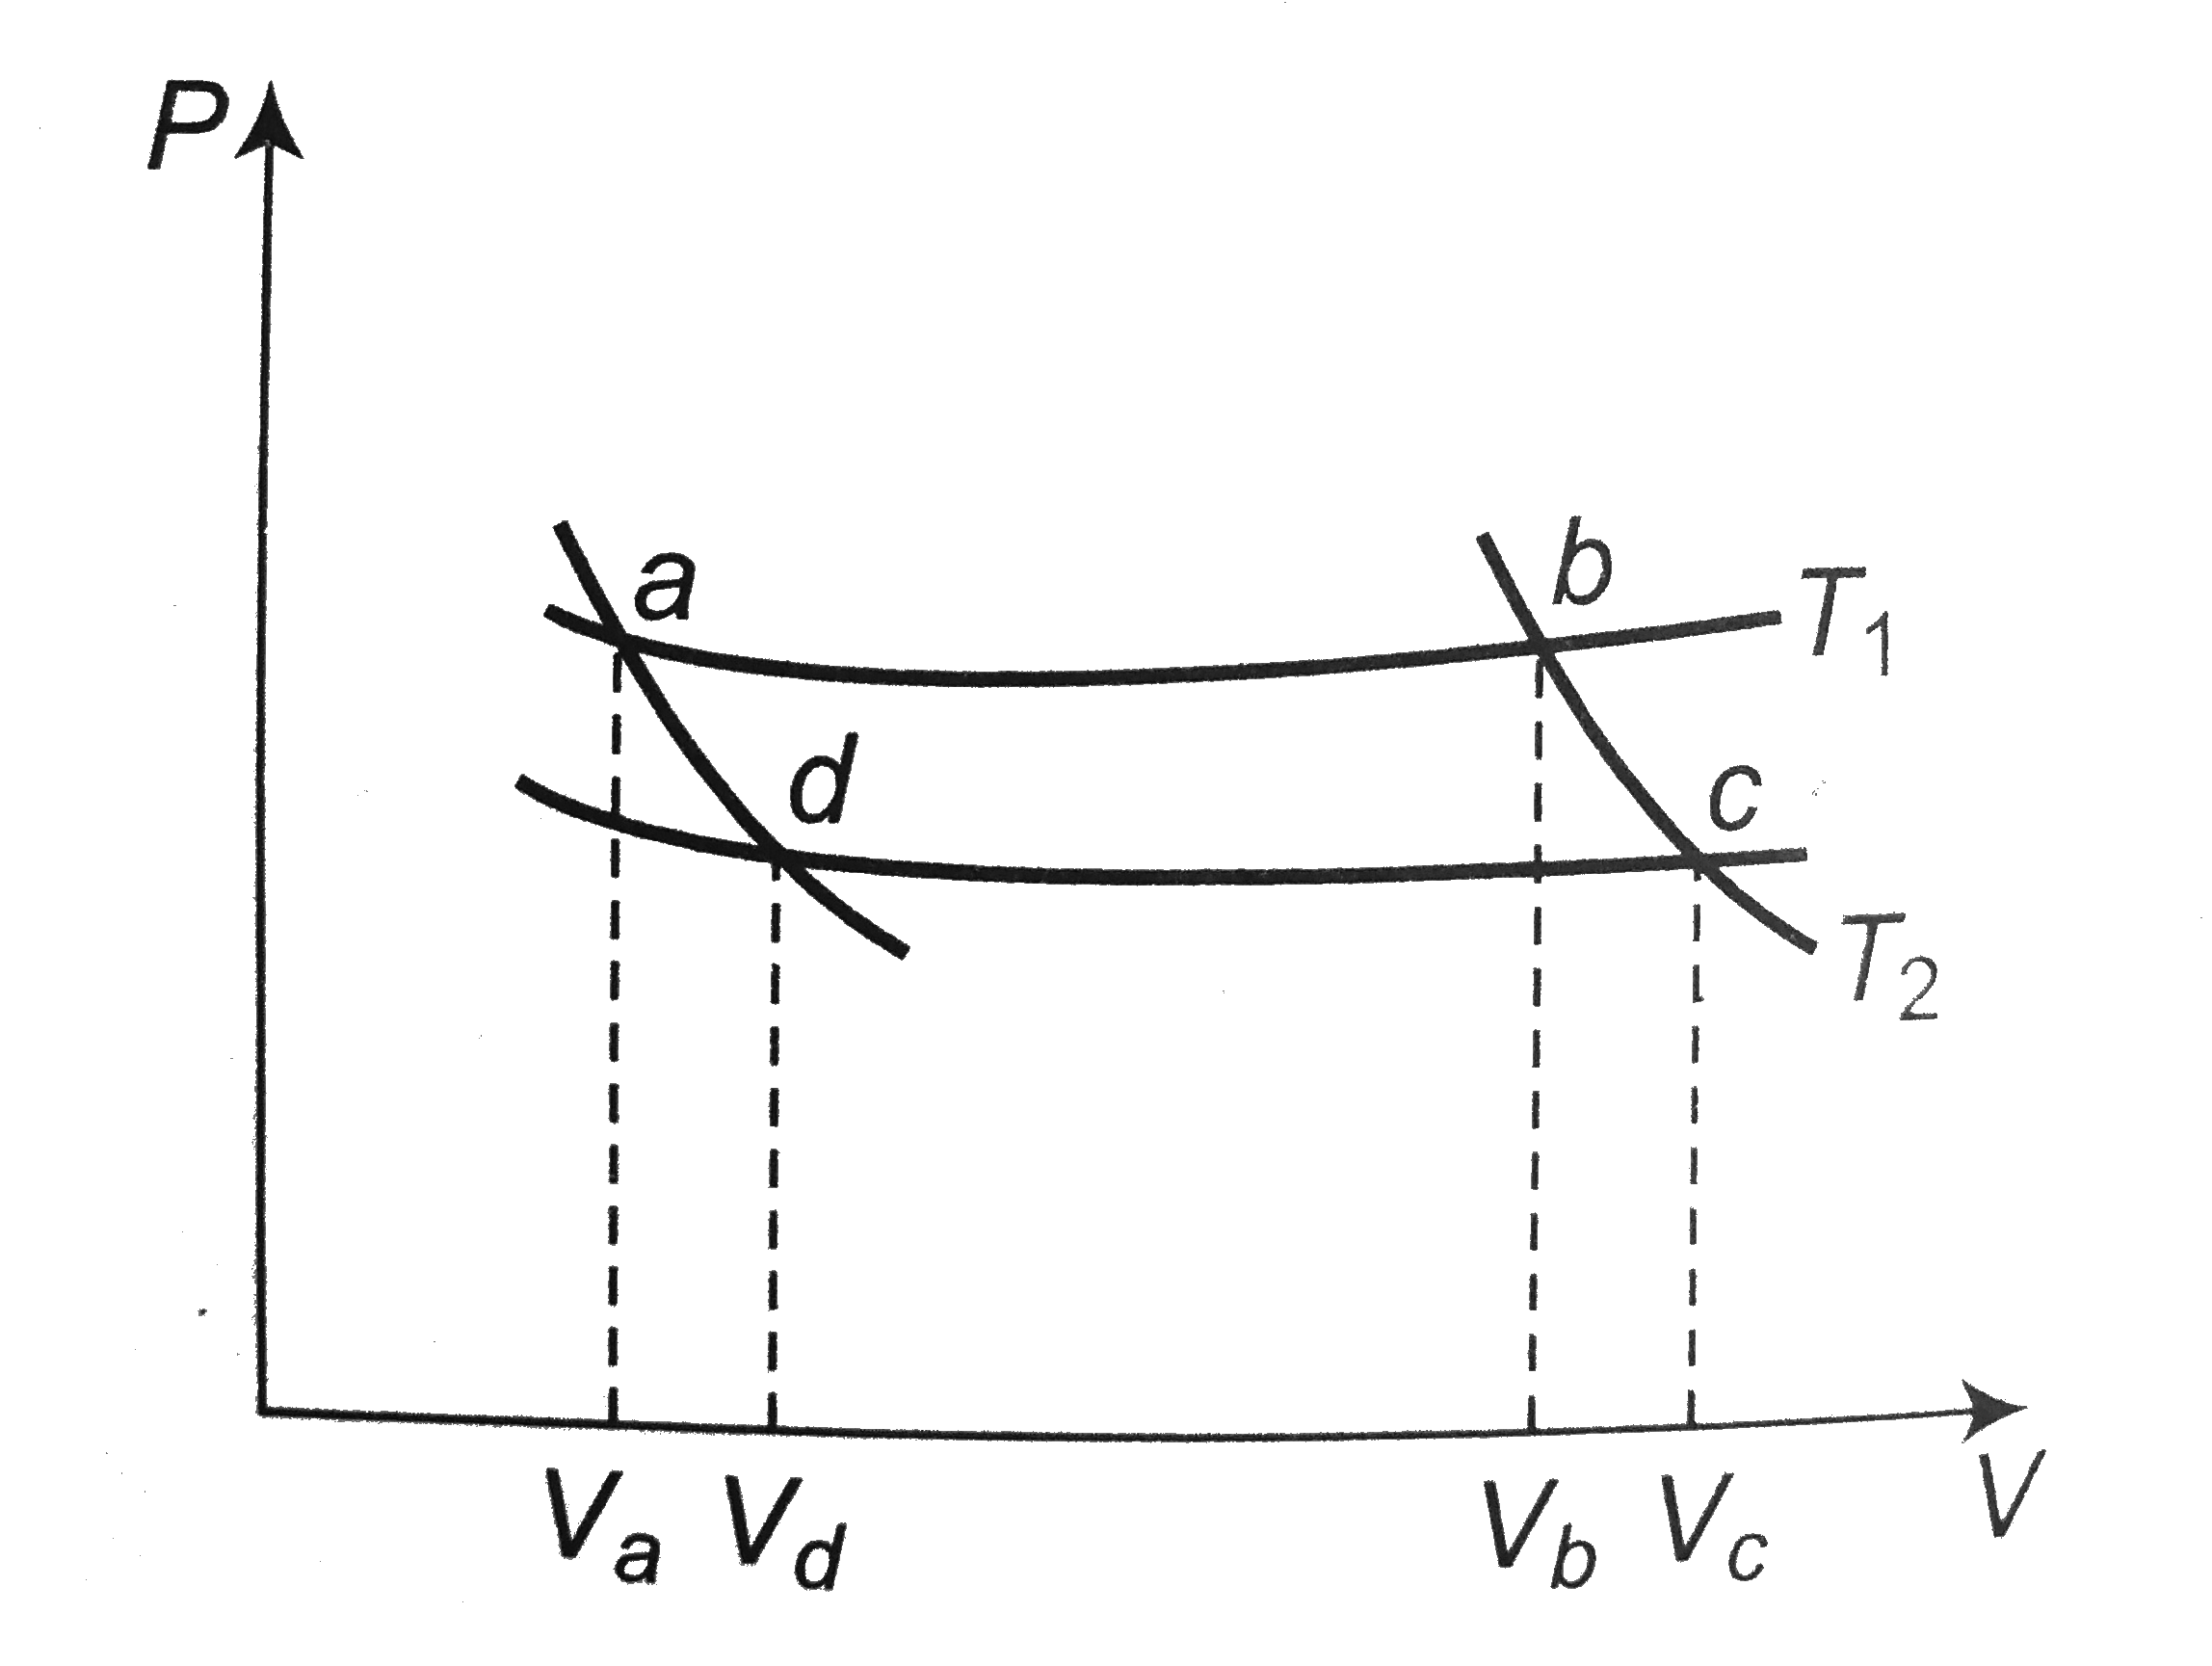
VbVc
VcVb
VdVa
VbVc
The correct Answer is:A
Step by step video, text & image solution for In the following P-V diagram two adiabatics cut two isothermals at temperature T_(1) and T_(2) (fig). The value of V_(a)/V_(d) will be by Physics experts to help you in doubts & scoring excellent marks in Class 11 exams.
Updated on:21/07/2023Topper's Solved these Questions
- THERMODYNAMICSBook:CENGAGE PHYSICSChapter:THERMODYNAMICSExercise:8
Explore 3 Videos
- THERMODYNAMICSBook:CENGAGE PHYSICSChapter:THERMODYNAMICSExercise:9
Explore 3 Videos
- THERMODYNAMICSBook:CENGAGE PHYSICSChapter:THERMODYNAMICSExercise:6
Explore 3 Videos
- SUPERPOSITION AND STANDING WAVESBook:CENGAGE PHYSICSChapter:SUPERPOSITION AND STANDING WAVESExercise:Comprehension Type
Explore 5 Videos
- TRANSMISSION OF HEATBook:CENGAGE PHYSICSChapter:TRANSMISSION OF HEATExercise:Single correct
Explore 9 Videos
Similar Questions
Knowledge Check
In the following P–V diagram of an ideal gas, two adiabates cut two isotherms at T1 and T2 The value of VB/VC is :
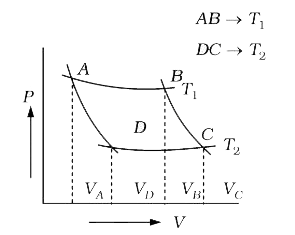 A=VA/VDB<VA/VDC>VA/VDDcannot say
In the following P-V diagram of an ideal gas, two adiabates cut two isotherms at T1=300KandT2=200K. The value of VA=2 unit, VB=8 unit, VC=16 unit. Find the value of VD .
 A4 unitB<4 unitC>5 unitD5 unit
Two different adiabatic parts for the same gas intersect two isothermals at T1andT2 shown in P-V diagram . Then the ratio of VaVb will be
 AVcVdBVdVcCγVdVcD1γVdVc
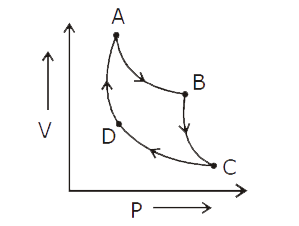
In the P - V diagram, the point B and C correspond to temperatures T1andT2 respectively. State relationship between T1andT2.
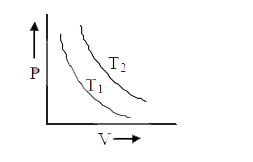
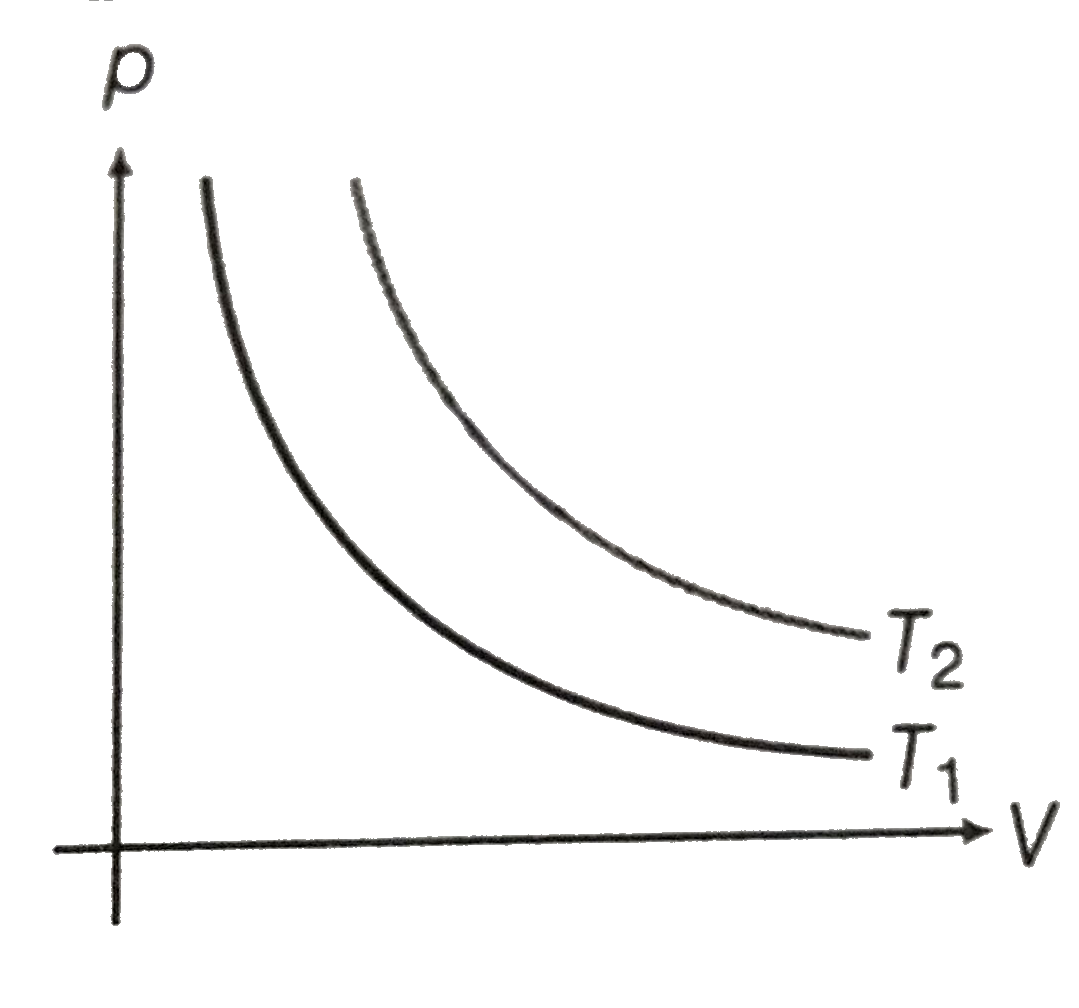
View SolutionThe p−V diagrams of same mass of a gas are drawn at two different temperatues T1 and T2 Explain whether T1>T2> or T2>T1.
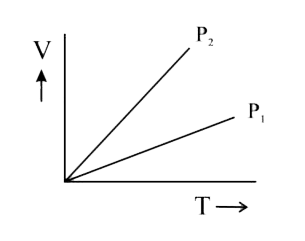
View SolutionIn V-T diagram shown in fig., what is the relation between P1andP2 ?
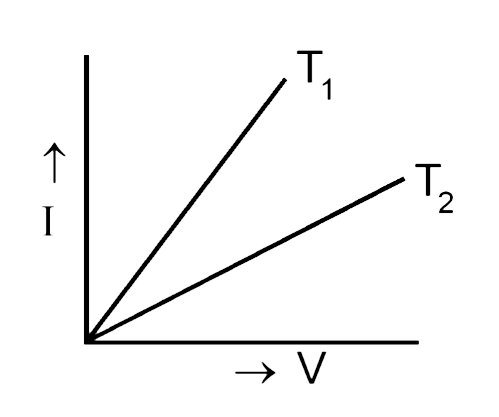
View SolutionThe voltage V and current I v graphs for a conductor at two different temperatures T1andT2 are shown in the figure. The relation between T1andT2 is

View SolutionThe current (I) and voltage (V) graphs for a given metallic wire at two different temperature (T1) and (T2) are shown in fig. It is concluded that
View Solution
