The graph of the equation y=x3+5x+1
Does not intersect the x-axis
intersects the x-axis at one and only one point
intersects the x-axis at exactly three points
intersects the x-axis at more than three points.
The correct Answer is:B
To determine how many times the graph of the equation y=x3+5x+1 intersects the x-axis, we need to find the values of x for which y=0. This means we need to solve the equation:
x3+5x+1=0
Step 1: Evaluate the function at specific points
Let's evaluate the function at a few points to understand its behavior:
1. At x=−1:
y=(−1)3+5(−1)+1=−1−5+1=−5
2. At x=0:
y=03+5(0)+1=1
From these evaluations, we see that:
- At x=−1, y=−5 (negative)
- At x=0, y=1 (positive)
Step 2: Analyze the sign change
Since the function changes from negative to positive between x=−1 and x=0, by the Intermediate Value Theorem, there must be at least one root in the interval (−1,0).
Step 3: Evaluate the function at more points
To check if there are more roots, let's evaluate the function at other points:
3. At x=1:
y=13+5(1)+1=1+5+1=7
4. At x=−2:
y=(−2)3+5(−2)+1=−8−10+1=−17
5. At x=−3:
y=(−3)3+5(−3)+1=−27−15+1=−41
Step 4: Analyze the behavior of the function
From the evaluations:
- At x=−2, y=−17 (negative)
- At x=−3, y=−41 (negative)
- At x=1, y=7 (positive)
The function is negative for x<−1 and becomes positive after x=0. Since the function is a cubic polynomial, it will continue to increase without bound as x increases.
Step 5: Conclusion
The function y=x3+5x+1 has:
- One root in the interval (−1,0)
- No other roots for x>0 since the function is increasing and positive.
Thus, the graph of the equation intersects the x-axis at exactly one point.
Final Answer:
The graph intersects the x-axis at one and only one point.
---
y=(−1)3+5(−1)+1=−1−5+1=−5
y=03+5(0)+1=1
- At x=−1, y=−5 (negative)
- At x=0, y=1 (positive)
y=13+5(1)+1=1+5+1=7
y=(−2)3+5(−2)+1=−8−10+1=−17
y=(−3)3+5(−3)+1=−27−15+1=−41
- At x=−2, y=−17 (negative)
- At x=−3, y=−41 (negative)
- At x=1, y=7 (positive)
- One root in the interval (−1,0)
- No other roots for x>0 since the function is increasing and positive.
The graph intersects the x-axis at one and only one point.
Topper's Solved these Questions
Similar Questions
Knowledge Check
- Question 1 - Select One
If the graph of the equation y=5x+3 is shifted down 4 units, what is the x-intercept of the new line?
A−1B15C1D54 - Question 2 - Select One
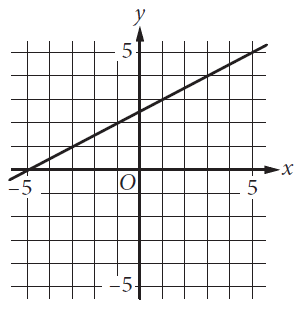
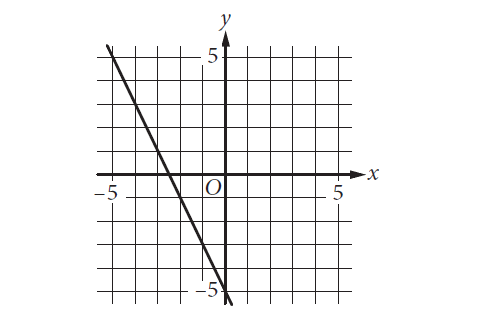
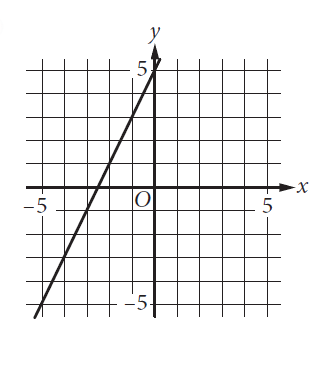
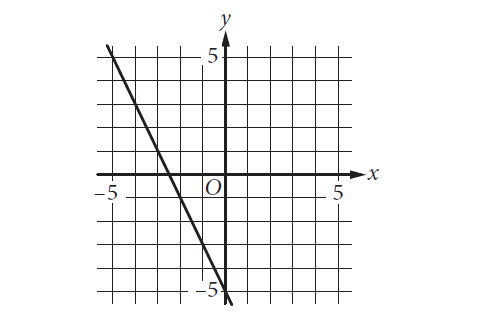
Which of the following is the graph of the equation y = 2x − 5 in the xy-plane?
A B
B C
C D
D
- Question 3 - Select One
IF (a,-3) is on the graph of the equation x-4y=14 in the standed (x,y) coordinate plane , then a= ?
A−174B−2C2D17
Draw the graph of the equation 3x+2y−5=0. Use this graph to find:
(i) x1 the value of x, when y=7
(ii) y1 the value of y, when x=3View SolutionDraw the graph of the equation
2x−3y−5=0
Find the graph find
(i) x1 the value of x, when y=7
(ii) x2,the value of x, when y=-5View SolutionDraw the graphs of the equations 5x−y=5 and 3x−y=3 . Determine the co-ordinates of the vertices of the triangle formed by these lines and y-axis. Calculate the area of the triangle so formed.
View SolutionDraw the graph of the equation x+2y =4, use graph to find :
(a) X1, the value of x when y=4(b)Y1 the value of y when x= -2View Solution(i) Draw a graph of y=x2−4x+3 for −2≤x≤5.
(ii) Use the graph to solve the equation x2−4x+3=0.View Solution

