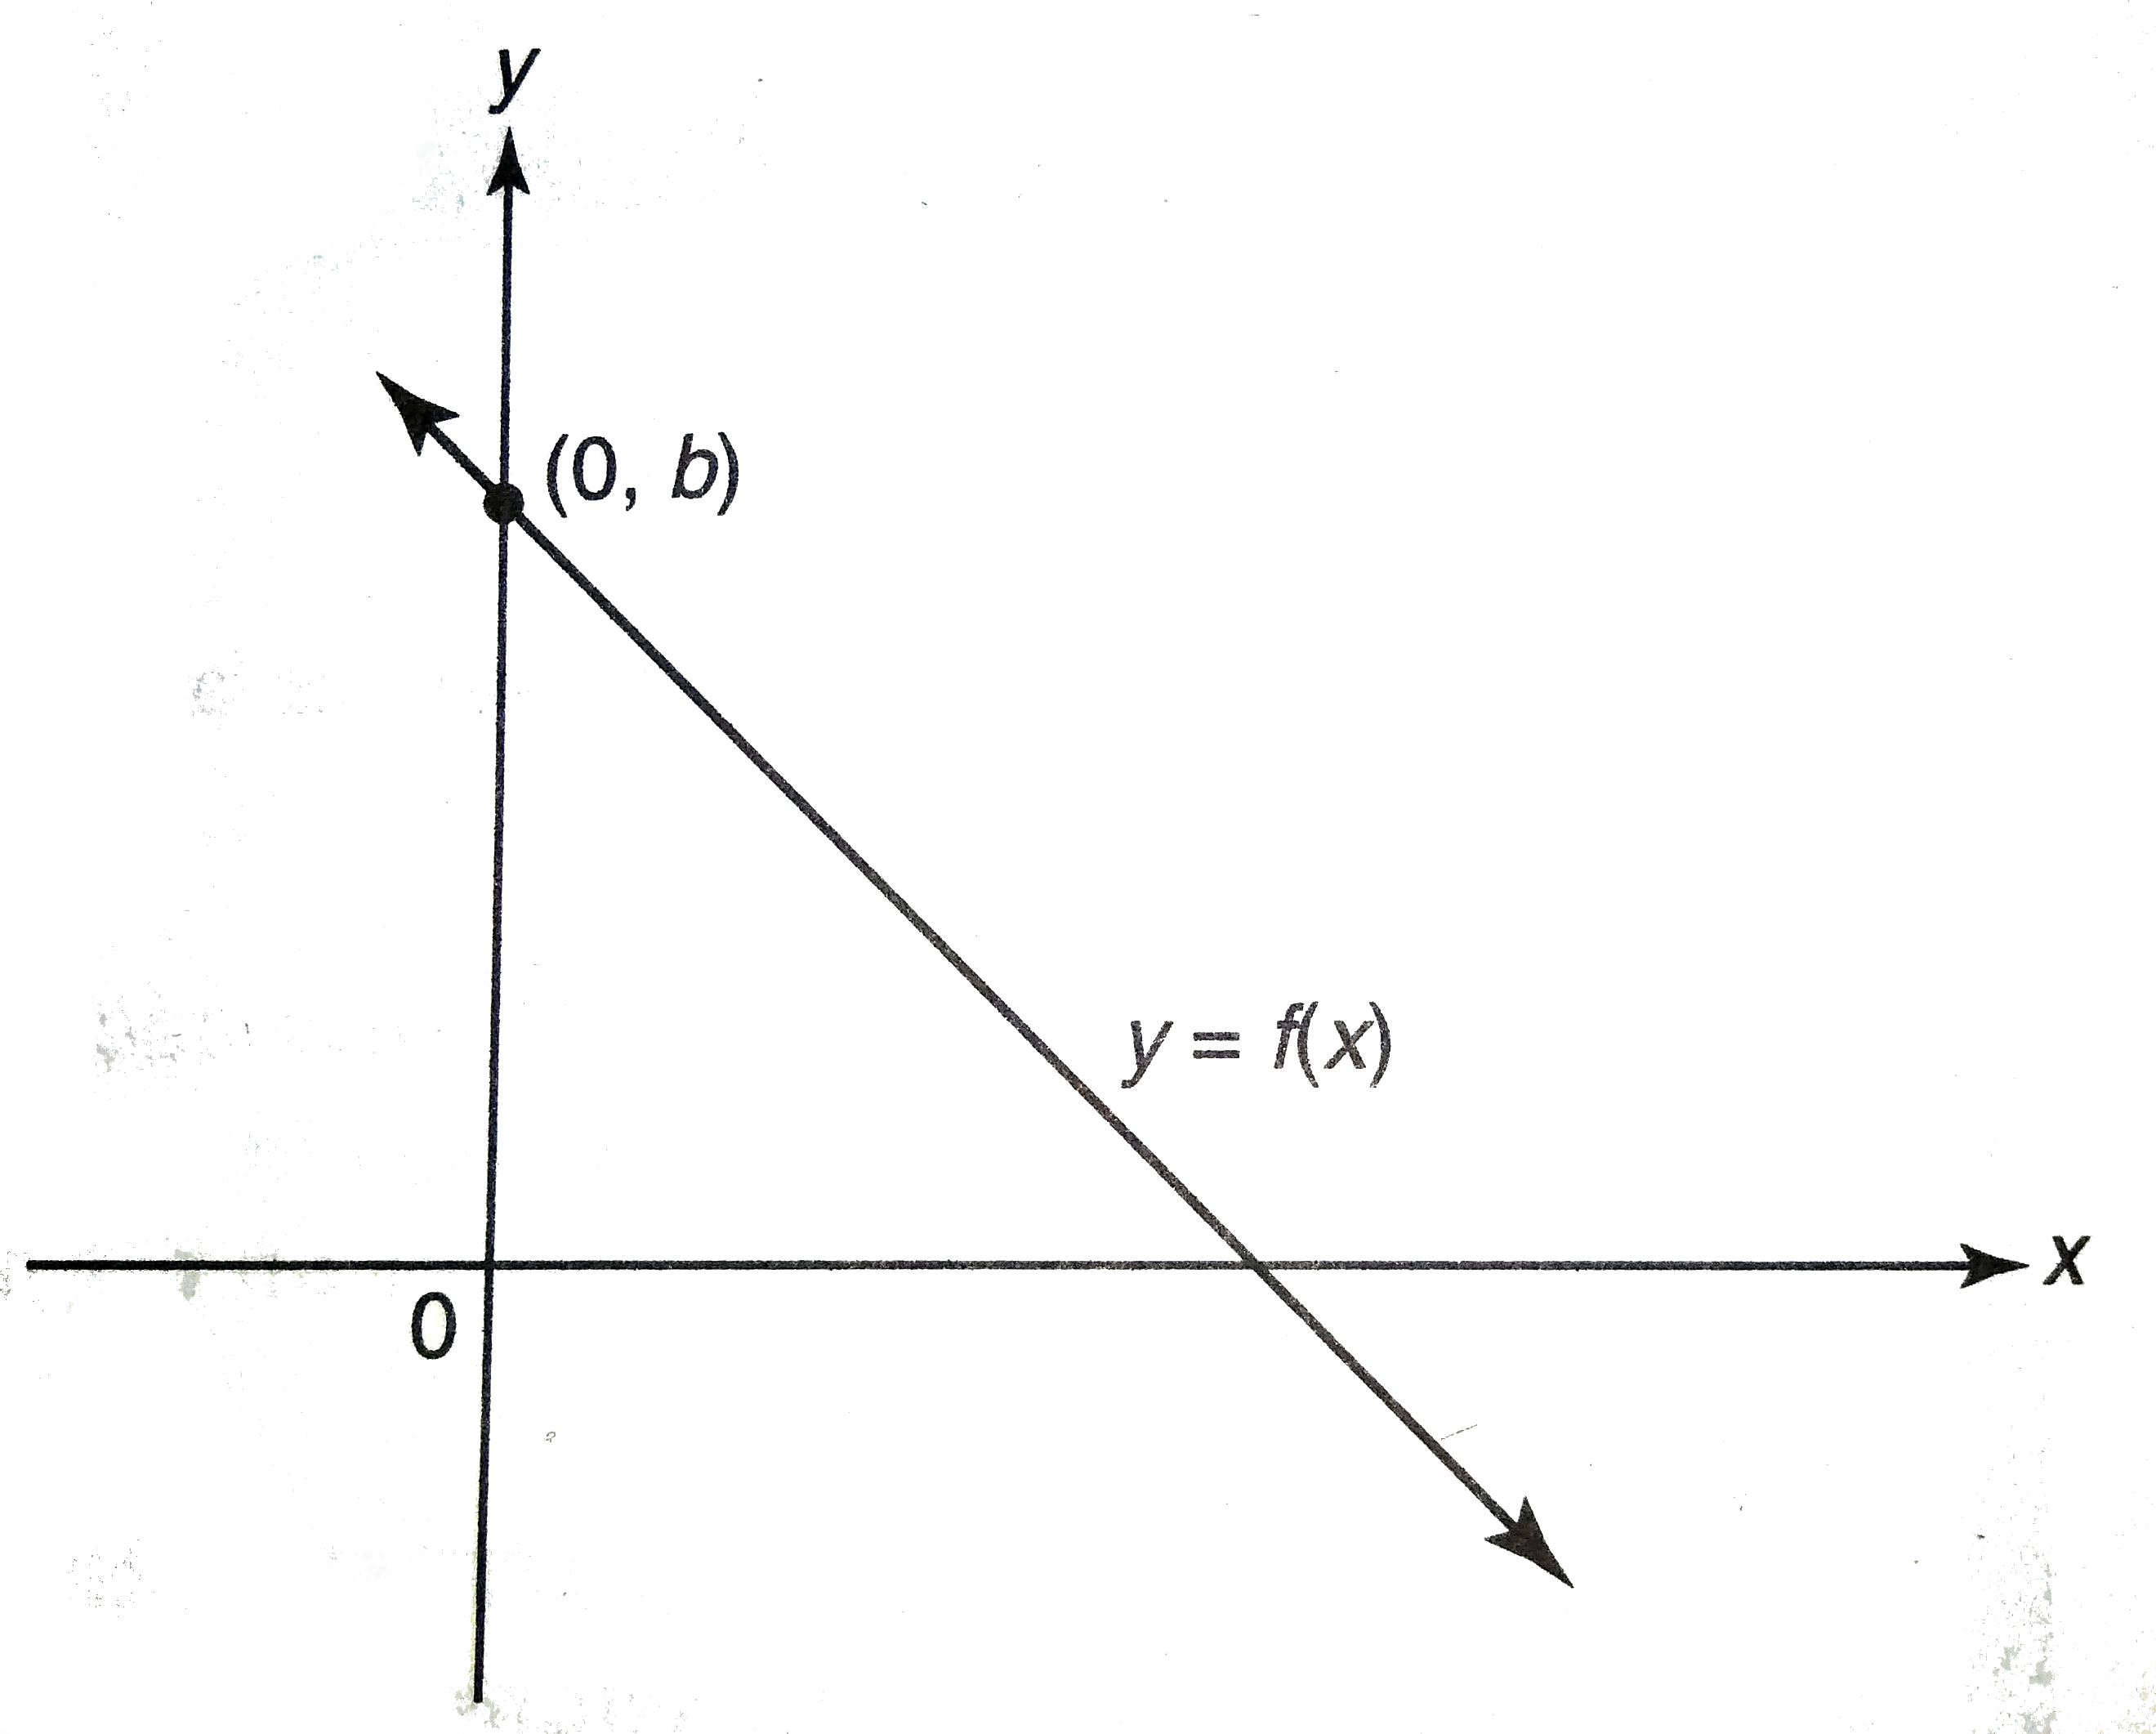
The figure above shows the graph of the linear function, y=f(x). If slope of the line is -2 and f(3)=4, what is the value of b?
8
9
10
11
The correct Answer is:C
Step by step video, text & image solution for The figure above shows the graph of the linear function, y=f(x). If slope of the line is -2 and f(3)=4, what is the value of b? by Maths experts to help you in doubts & scoring excellent marks in Class 12 exams.
Updated on:21/07/2023Topper's Solved these Questions
Similar Questions
Knowledge Check

The table above shows some values of the linear function f. Which of the following defines f ?Af(n)=n-3Bf(n) = 2n-4Cf(n) = 3n-5Df(n) = 4n-6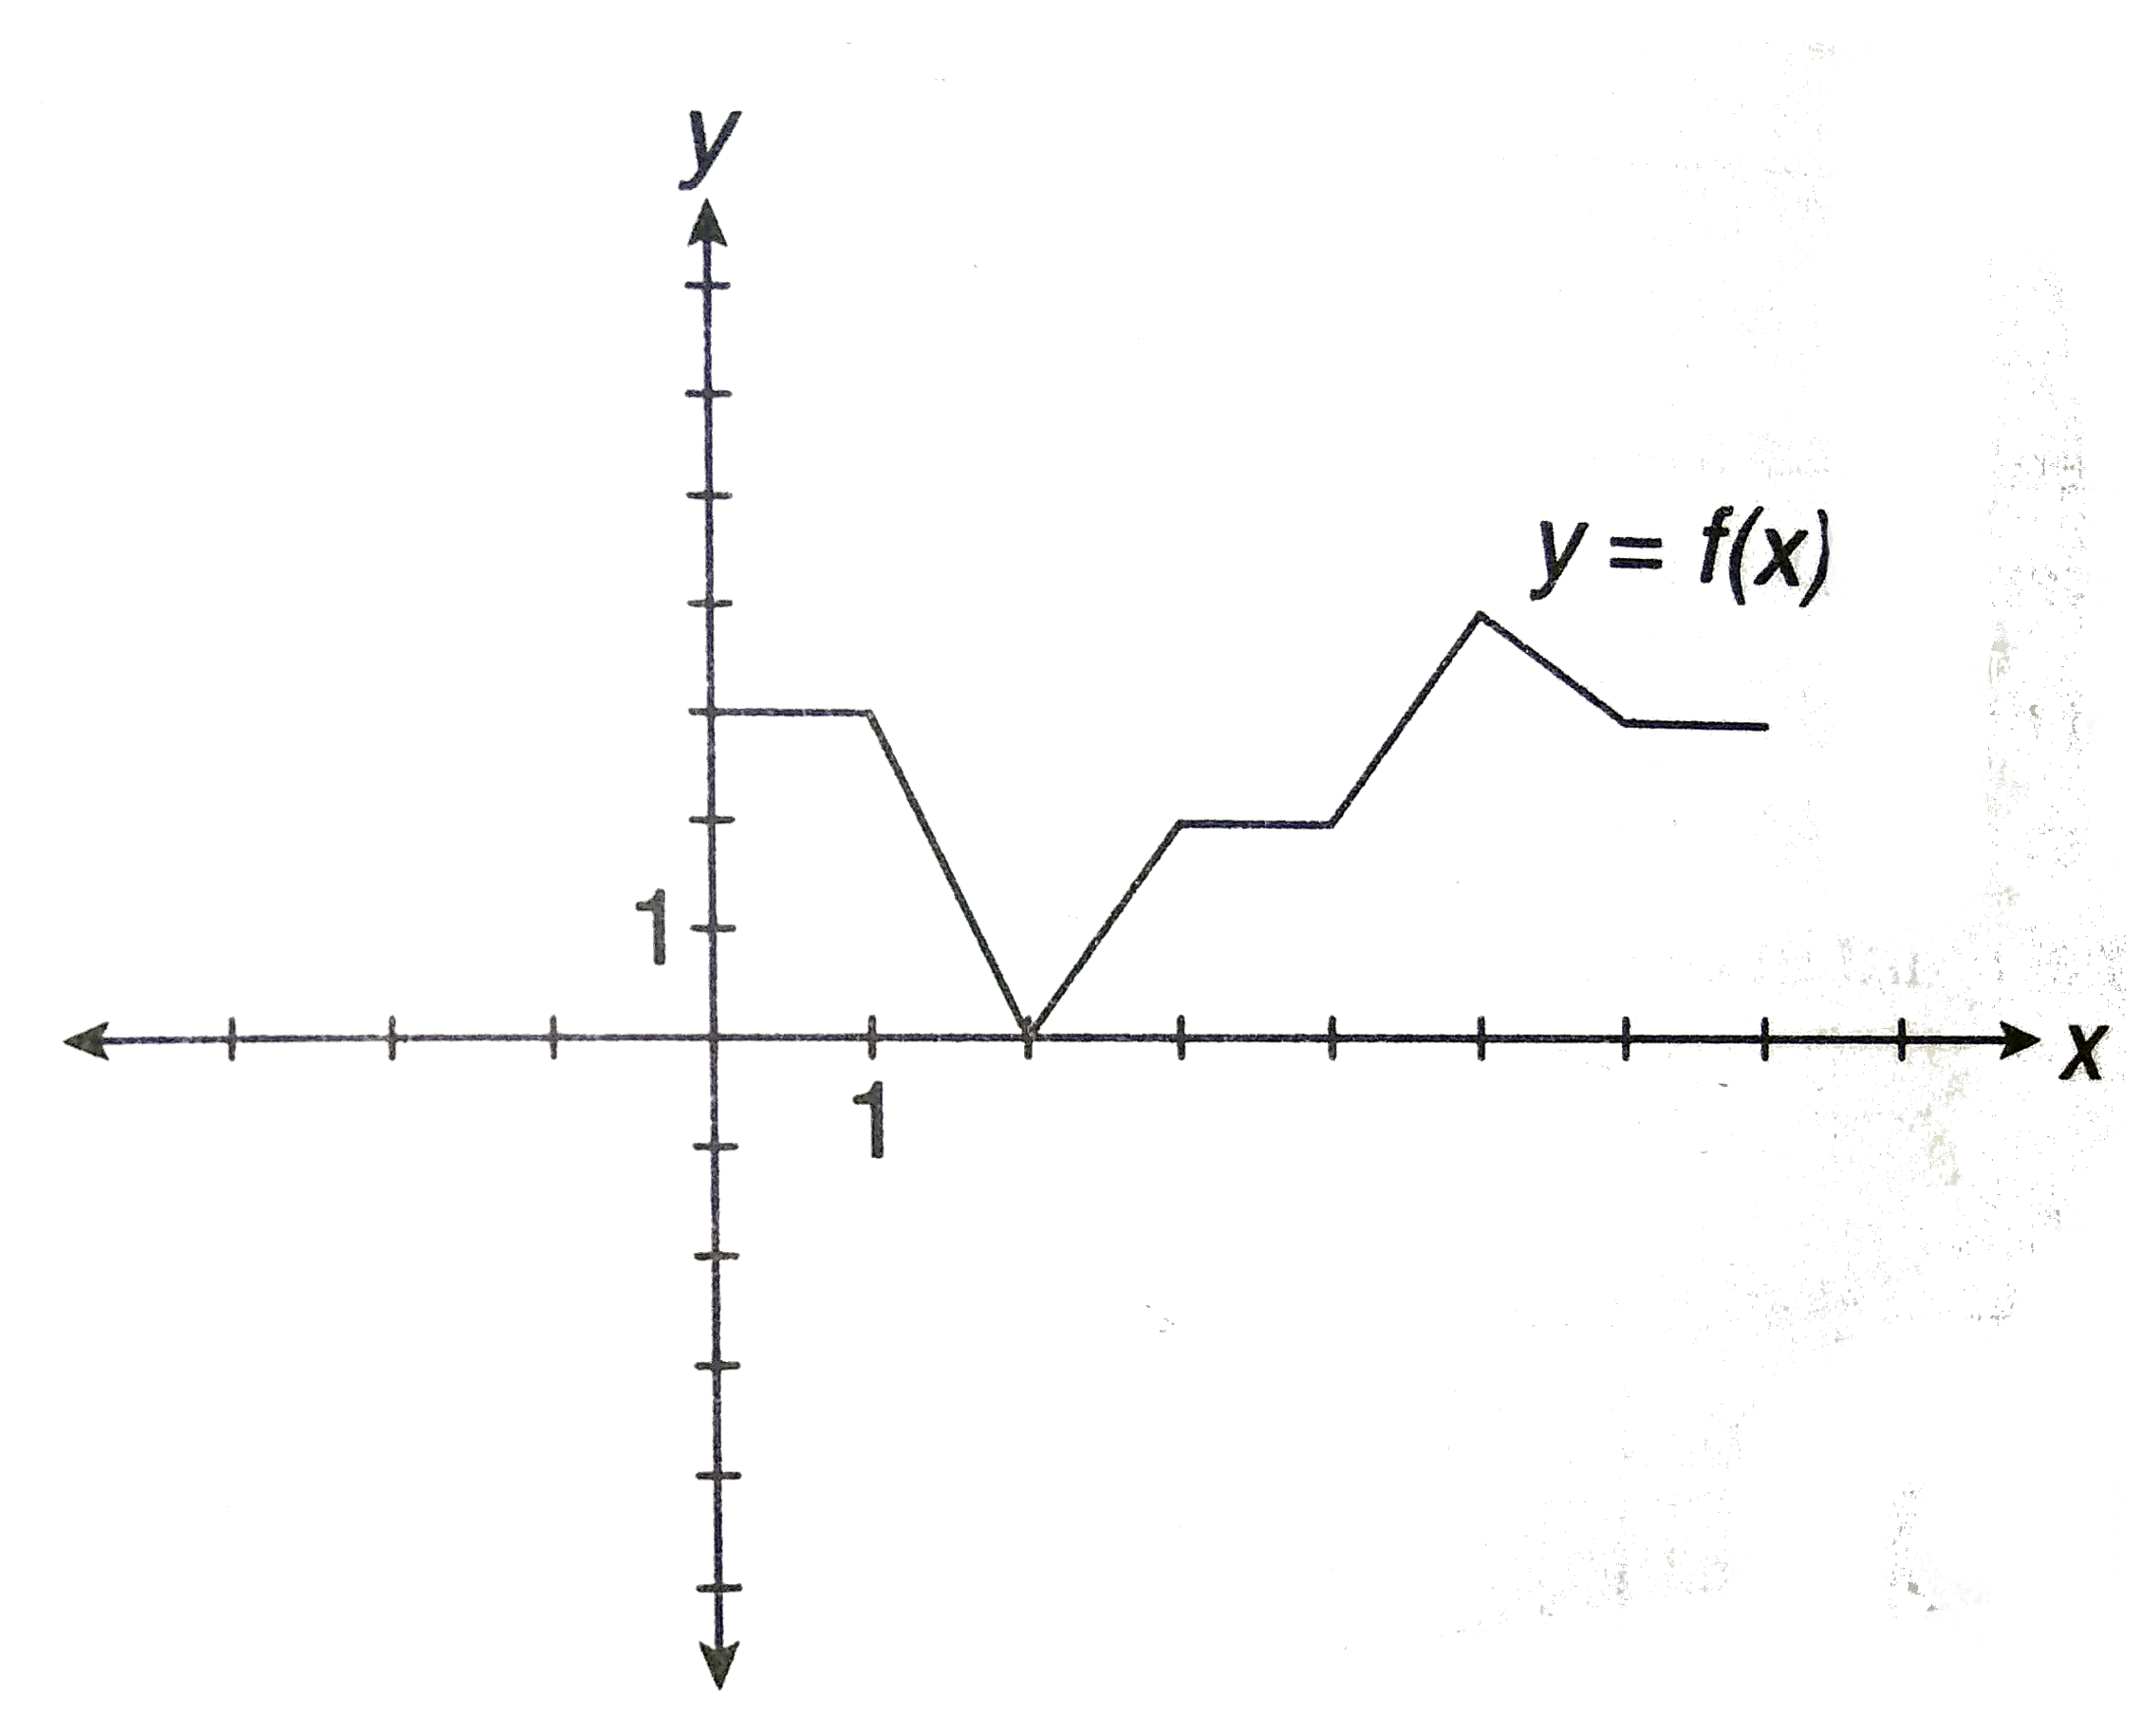
The figure above shows part of the graph of function f. If f(x+6)=f(x) for all values of x, what is the value of f(23)?A0B2C3D4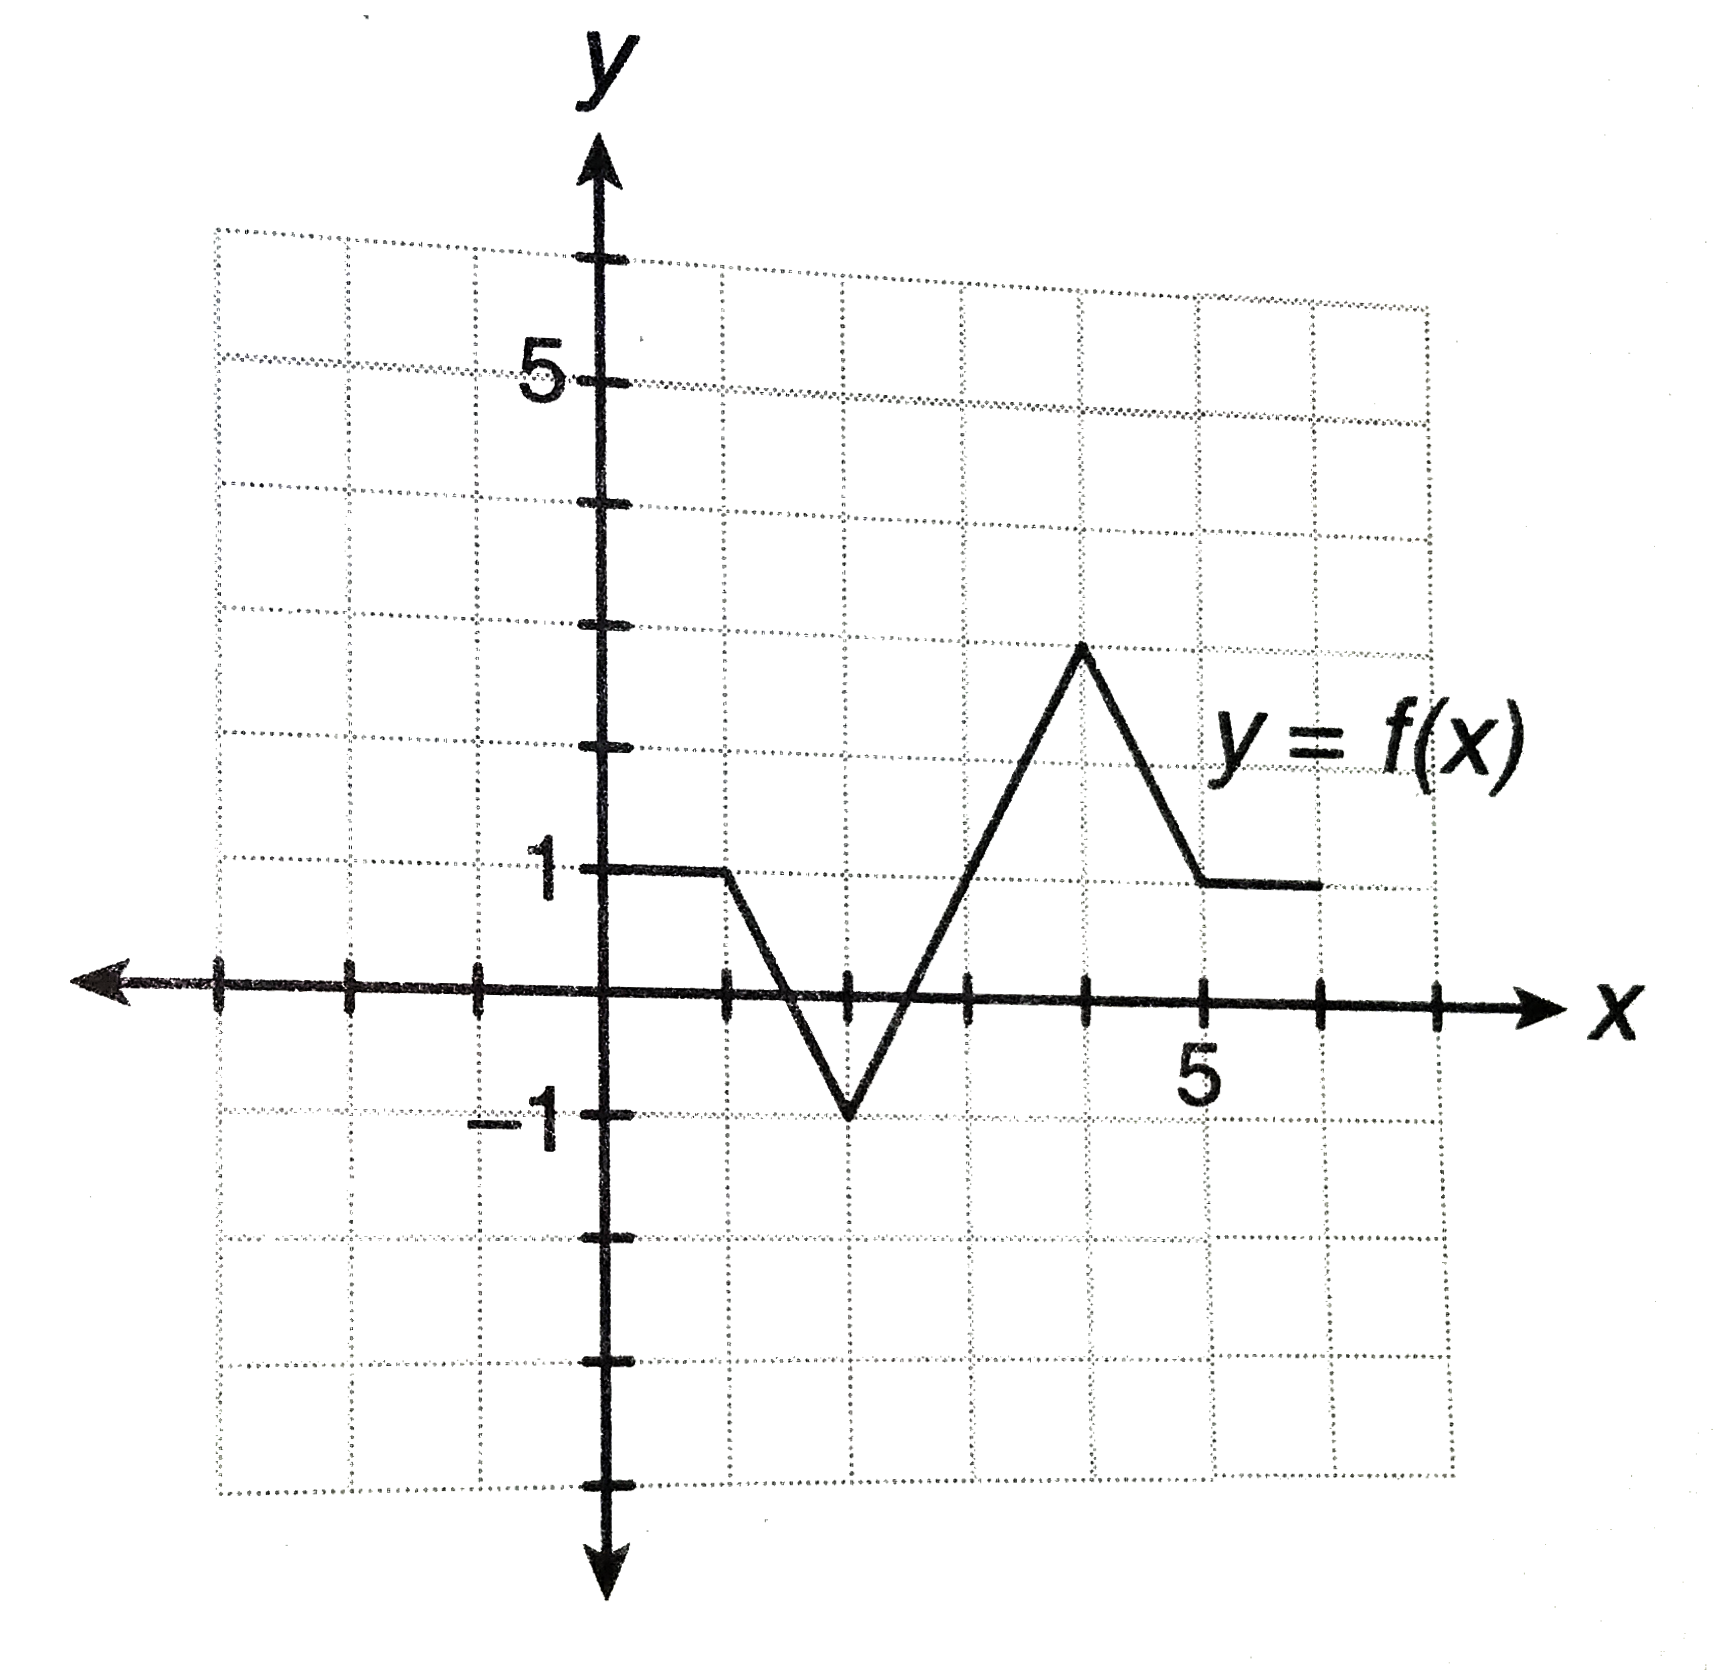
The figure above shows part of the graph of function f. If f(x−5)=f(x) for all values of x, what is the value of f(19)?A−1B0C1D3
If the graph of the function y = f(x) is symmetrical about the line x = 2, then
View Solution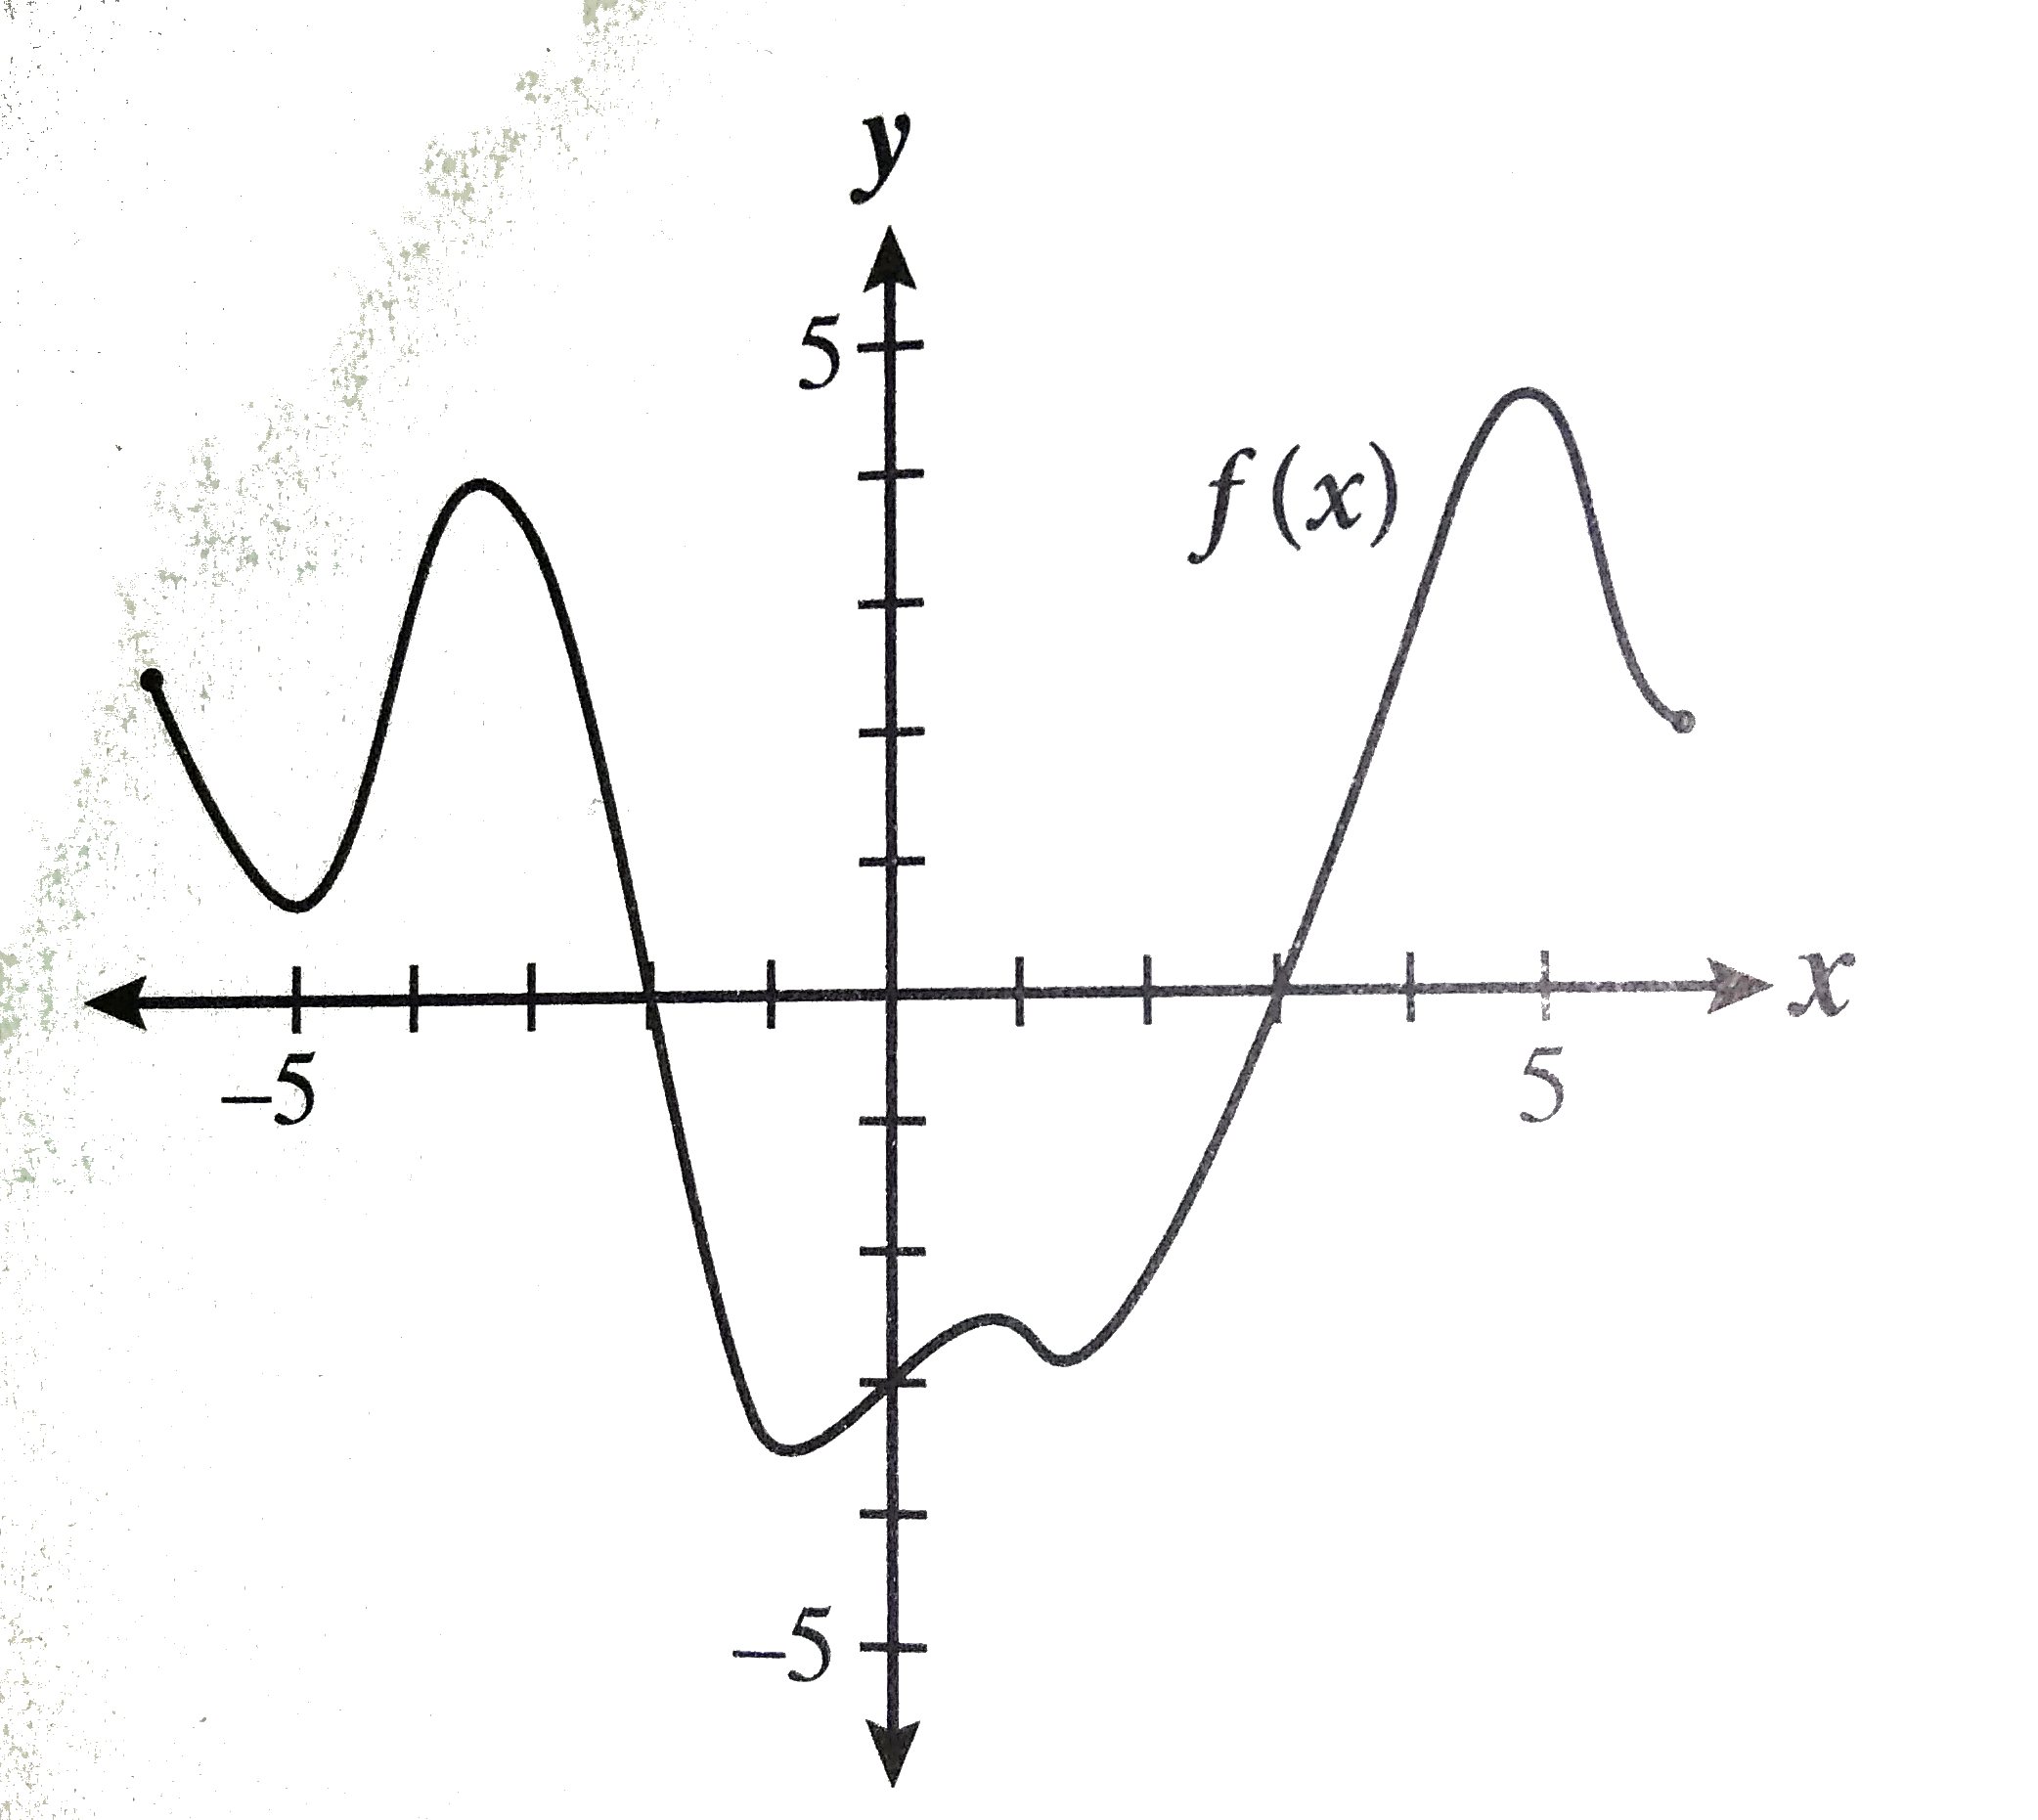
The figure above shows the graph of f(x). For which value(s) of x does f(x) equal 0?
View Solution
The table above shows a few values of the linear function f. which of the following equations defines f?
View SolutionIf f is a linear function and f(−2)=11,f(5)=−2,andf(x)=4.3, what is the value of x?
View Solution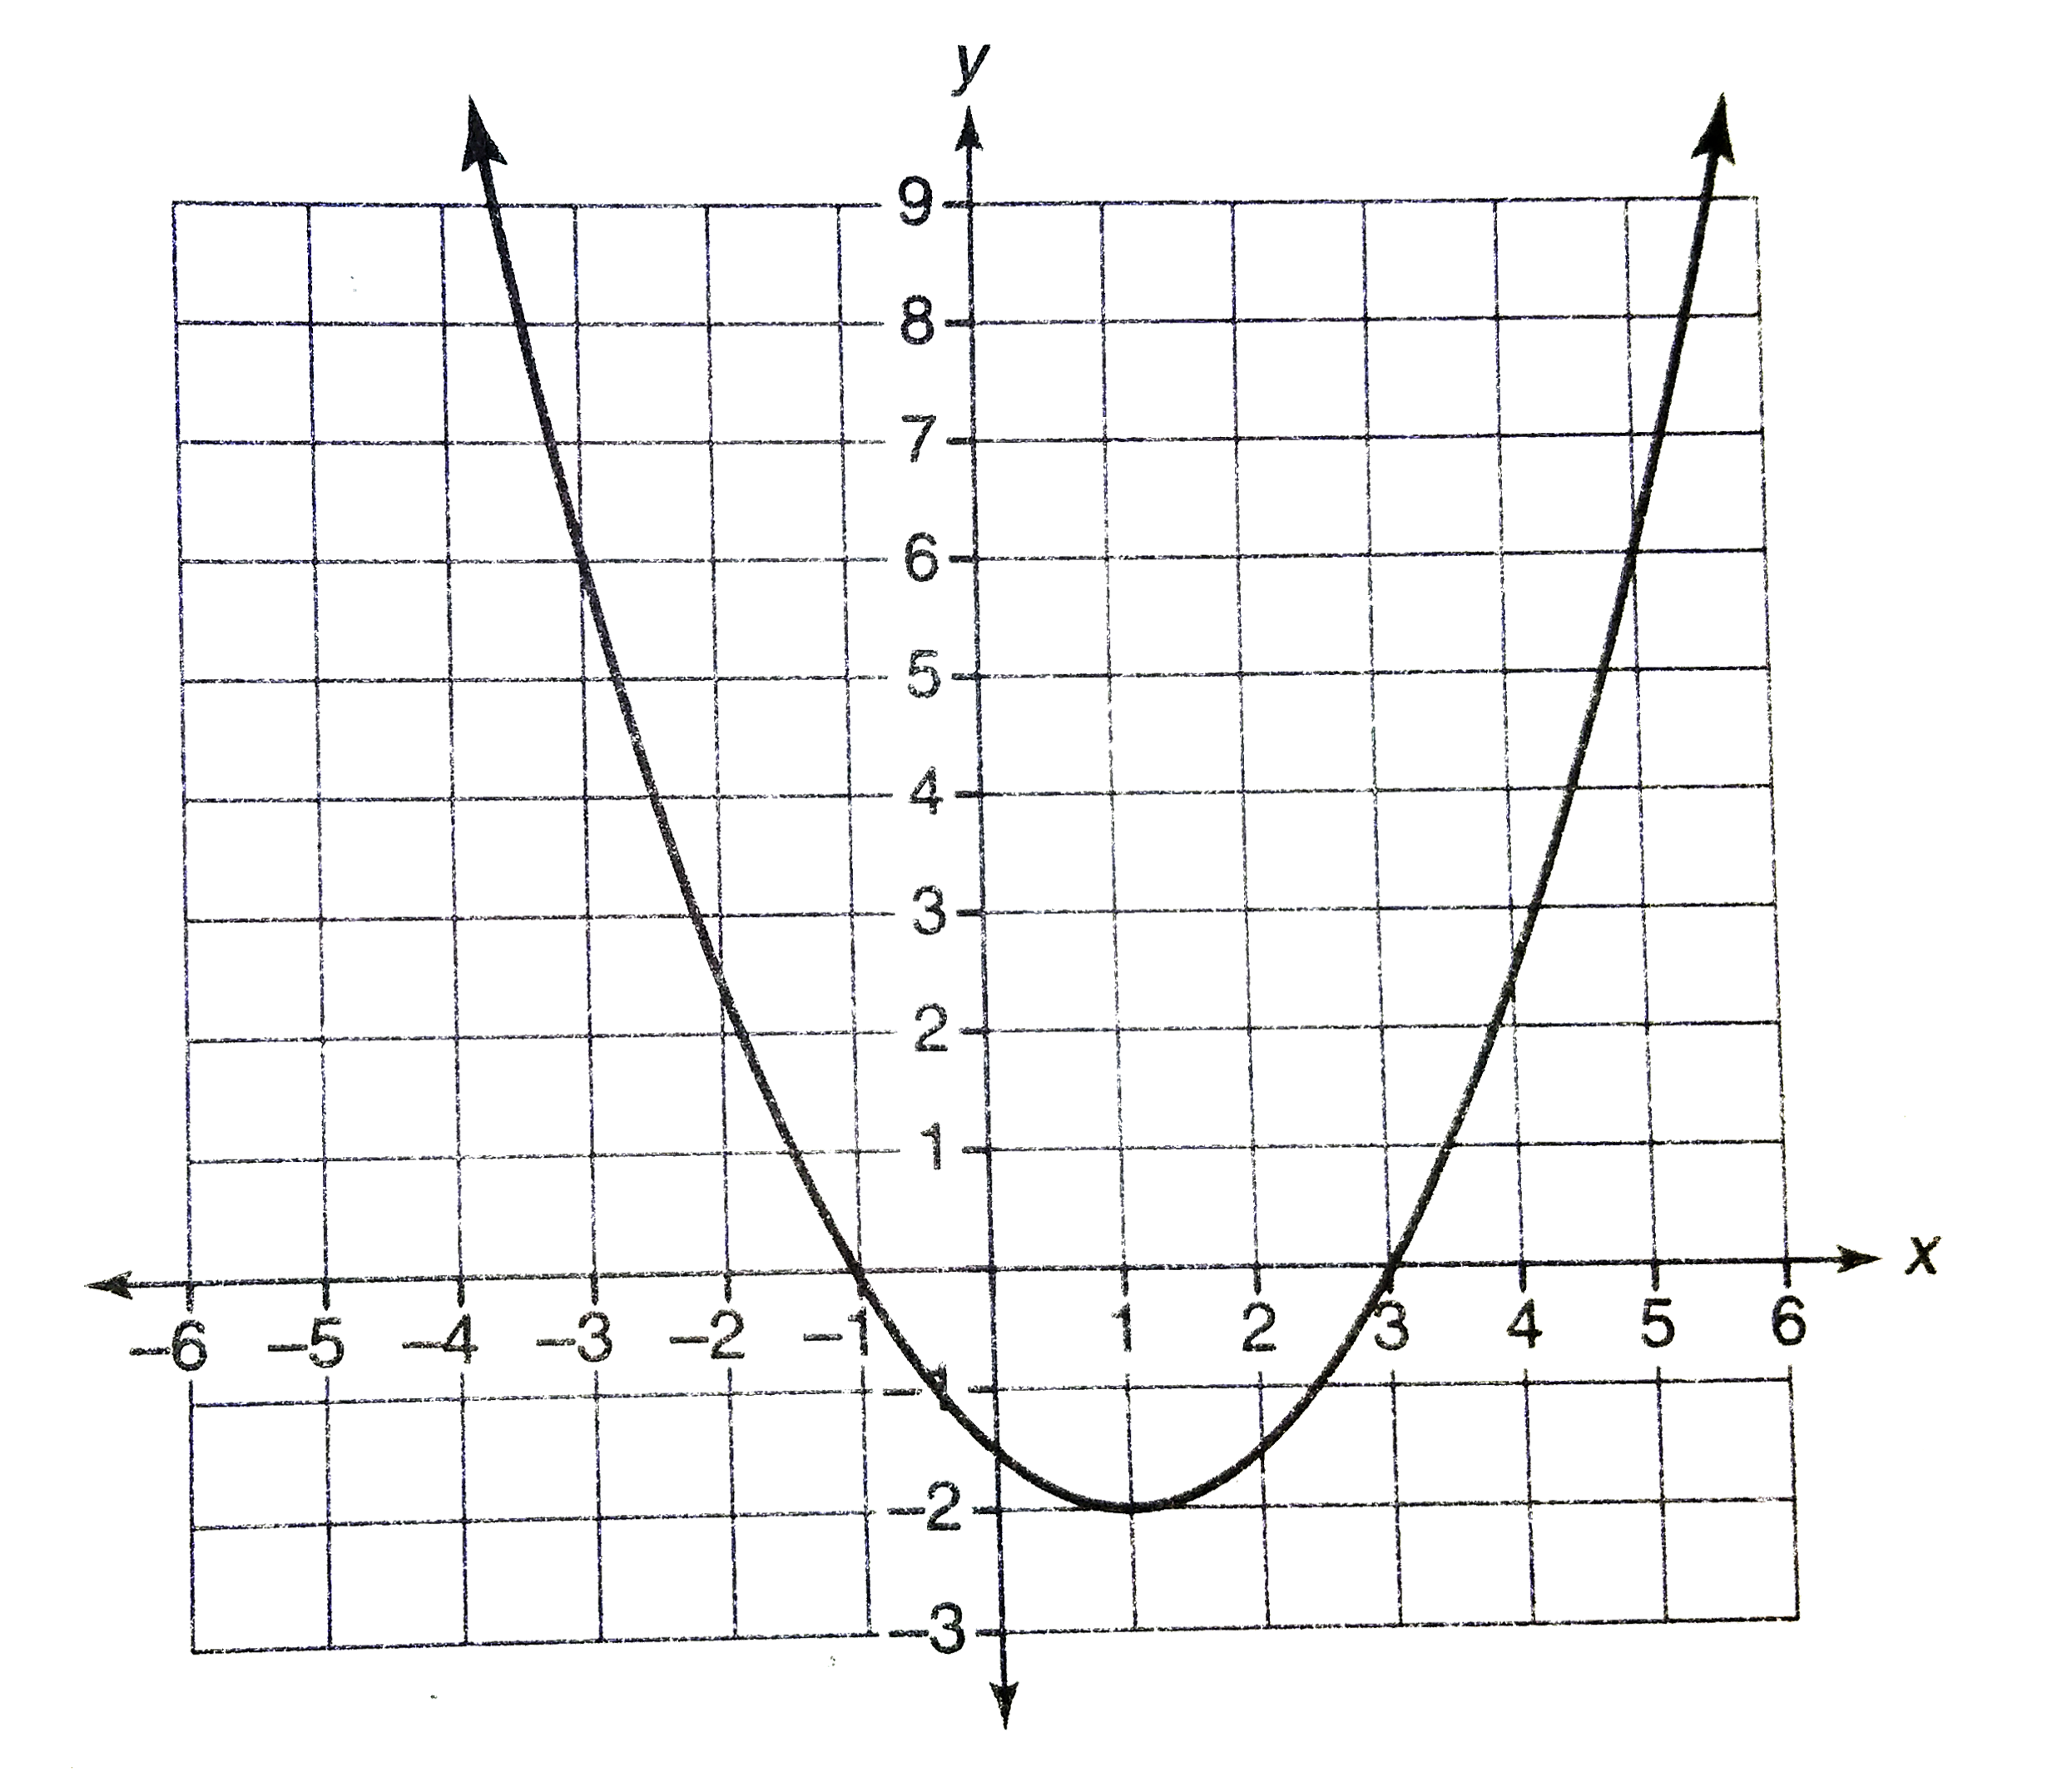
The figure above shows the graph of the quadratic function f with a minimum point at (1,−2). If f(5)=f(c), then which of the following could be the values of c?
View Solution
