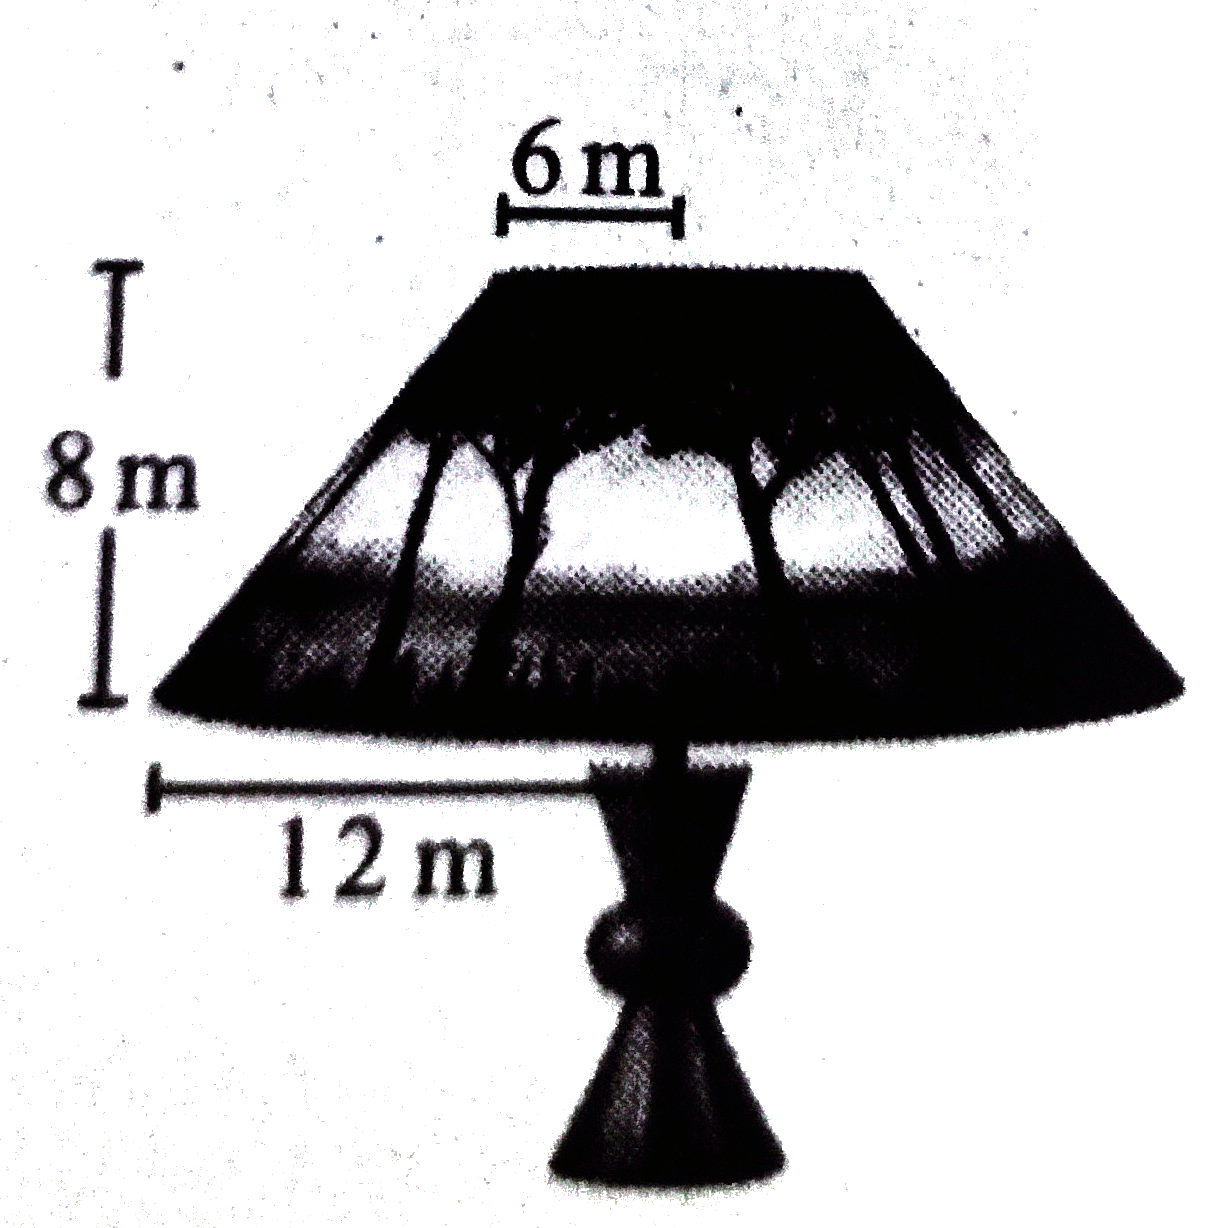
The frustum shaped outer portion of the table lamp has to be painted including the top part. Find the total cost of painting the lamp if the cost of painting 1 sq. cm is Rs. 2.
 Solution in Tamil
Step by step video & image solution for The frustum shaped outer portion of the table lamp has to be painted including the top part. Find the total cost of painting the lamp if the cost of painting 1 sq. cm is Rs. 2. by Maths experts to help you in doubts & scoring excellent marks in Class 10 exams.
Updated on:21/07/2023Topper's Solved these Questions
- MENSURATIONBOOK - SURA PUBLICATIONCHAPTER - MENSURATIONEXERCISE - Exercise 7.2
10 Videos
- MENSURATIONBOOK - SURA PUBLICATIONCHAPTER - MENSURATIONEXERCISE - Exercise 7.3
8 Videos
- GOVT. MODEL QUESTION PAPER-2019-20BOOK - SURA PUBLICATIONCHAPTER - GOVT. MODEL QUESTION PAPER-2019-20EXERCISE - Part-IV
6 Videos
- NUMBER AND SEQUENCESBOOK - SURA PUBLICATIONCHAPTER - NUMBER AND SEQUENCESEXERCISE - Unit test
12 Videos
Similar Questions
A 14 m deep well with inner diameter 10 m is dug and the earth taken out is evenly spread all around the well to form an embankment of width 5 m. Find the height of the embankment.
View SolutionA vessel is in the form of a hemispherical bowl mounted by a hollow cylinder. The diameter is 14 cm and the height of the vessel is 13 cm. Find the capacity of the vessel.
View SolutionFind two consecutive positive integers, sum of whose squares is 365.
View SolutionUsing Euclid's division lemma, if the cube of any positive integers is divided by 9 then the possible remainders are ___.
View SolutionDetermine the point of symmetry of a regular hexagon.
View SolutionMatch the following Column A to Column B

View SolutionMatch the following Column A to Column B

View SolutionMatch the following Column A to Column B

View SolutionFind the area of figure given below.

View SolutionFind the area of the figure given below.

View SolutionThe area of the shaded part in the figure given below is ______.

View SolutionThe inequation represented by the graph given below is :
View SolutionThe inequation that best describes the graph given below is _________
View SolutionThe inequation that best describes the following graph is _________
View SolutionIn Fig, find the value of x.
ltimg src="https://d10lpgp6xz60nq.cloudfront.net/physics_images/PS_MATH_IX_C12_S01_032_Q01.png" width="80%"gt
View Solution
