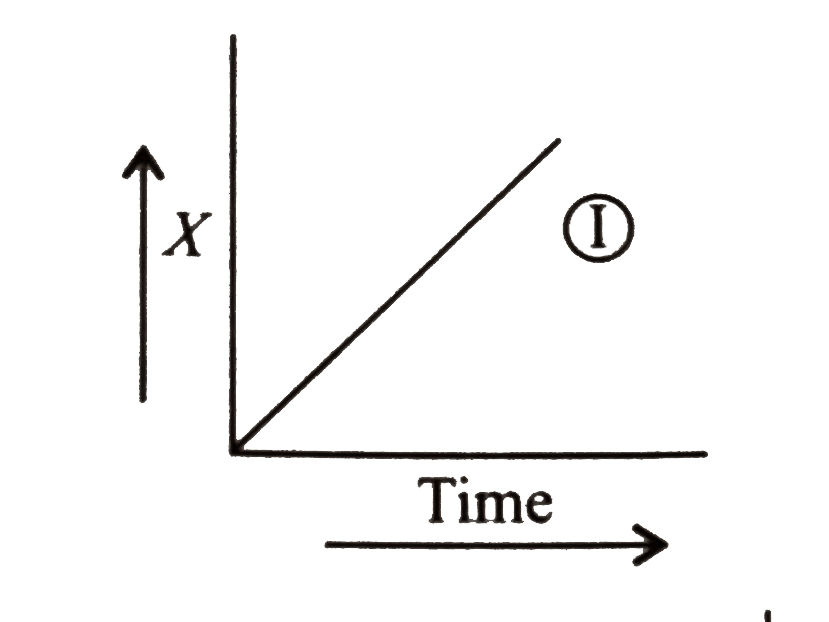
For the reactionA→B, for which graph between half life (t1/2)and∈itialconcentration(a)oftherectantisgivenbelow<br><imga≤ocr_imageload∈g=lazysrc=https://d10lpgp6xz60nq.cloudfront.net/physics_images/NRA_PHY_CHM_JMA_C07_E01_022_Q01.pngwh=80%mx-autosty≤=background:white;><br>Hencegraphbetween-(d[A])/(dt) and time will be:
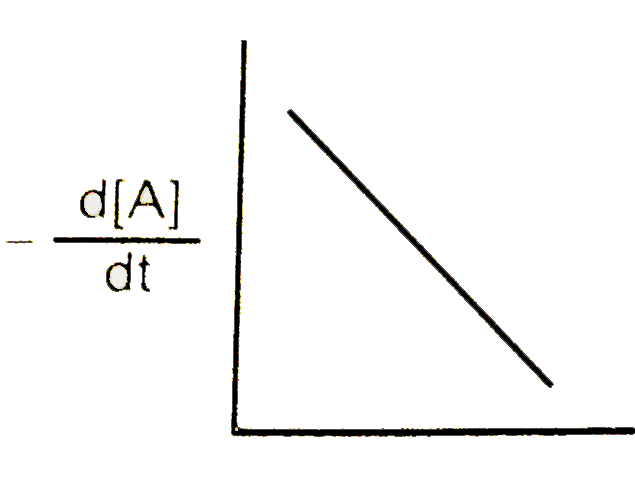
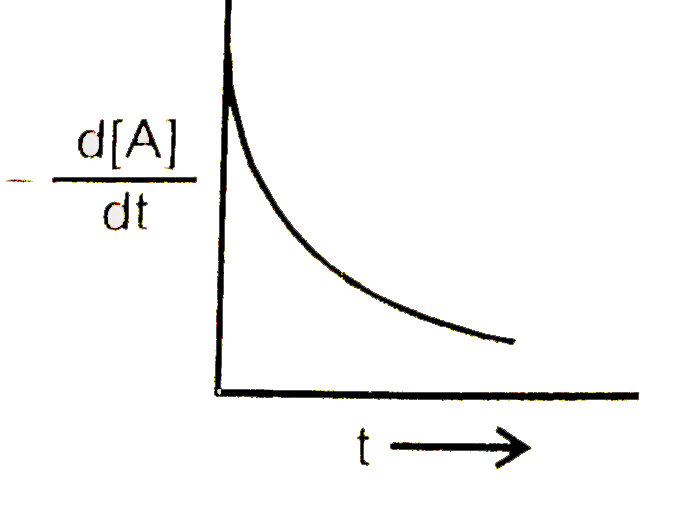
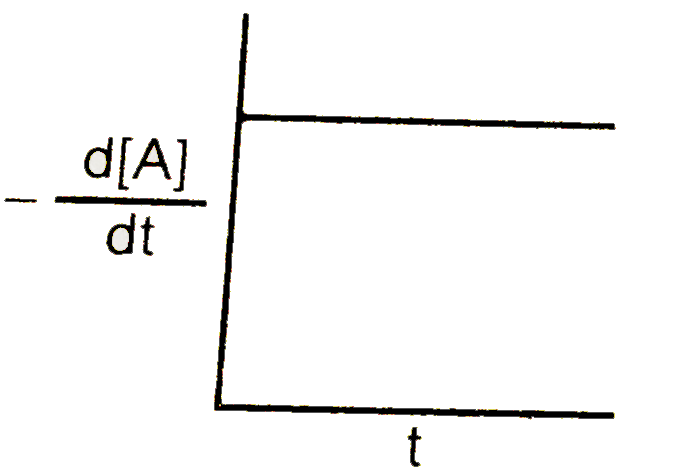
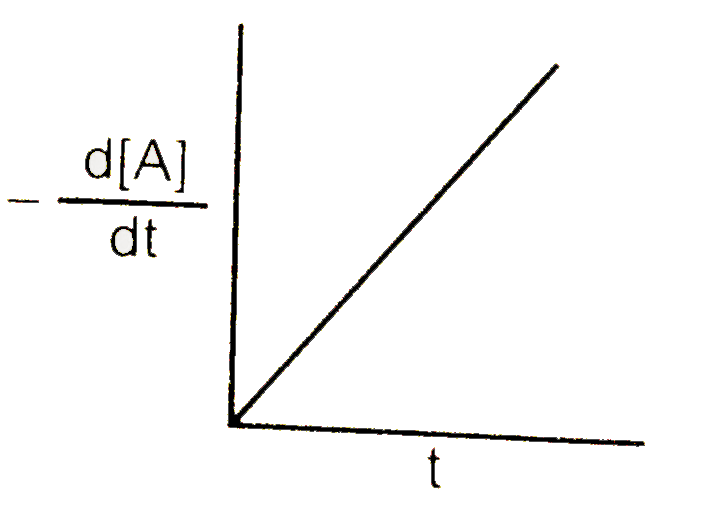
The correct Answer is:C
Step by step video, text & image solution for For the reactionAtoB, for which graph between half life (t_(1//2)) and initial concentration (a) of the rectant is given below Hence graph between -(d[A])/(dt) and time will be: by Chemistry experts to help you in doubts & scoring excellent marks in Class 12 exams.
Topper's Solved these Questions
- BOOK - NARENDRA AWASTHICHAPTER - CHEMICAL KINETIC & NUCLEAR CHEMISTRYEXERCISE - Level 1 (Q.3 To Q.32)2videos
CHEMICAL KINETIC & NUCLEAR CHEMISTRY
- BOOK - NARENDRA AWASTHICHAPTER - CHEMICAL KINETIC & NUCLEAR CHEMISTRYEXERCISE - Level 1 (Q.33 To Q.62)3videos
CHEMICAL KINETIC & NUCLEAR CHEMISTRY
- BOOK - NARENDRA AWASTHICHAPTER - SURFACE CHEMISTRYEXERCISE - Level 3 - Assertion - Reason Type Questions1videos
SURFACE CHEMISTRY
Similar Questions
Knowledge Check
- Question 1 - Select One
The relationship between half life and initial concentration is given by
Aan−1B1an−1Ca−nD1a - Question 2 - Select One
The graph of t1/2 versus initial concentration 'a' is for
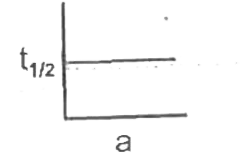 AFirst orderBSecond orderCZero orderDCan't predict
 - Question 3 - Select One
The graph between concentration (X) of the Product and time of the reaction A→B is of the type 1. Hence, graph between −d[A]dt and time will be of the type:
 A
A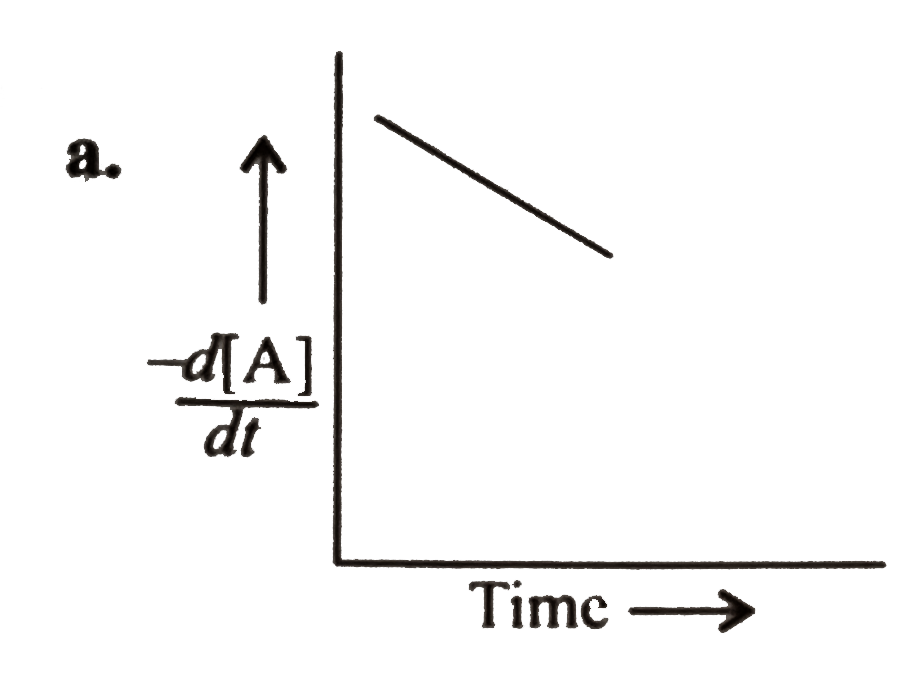 B
B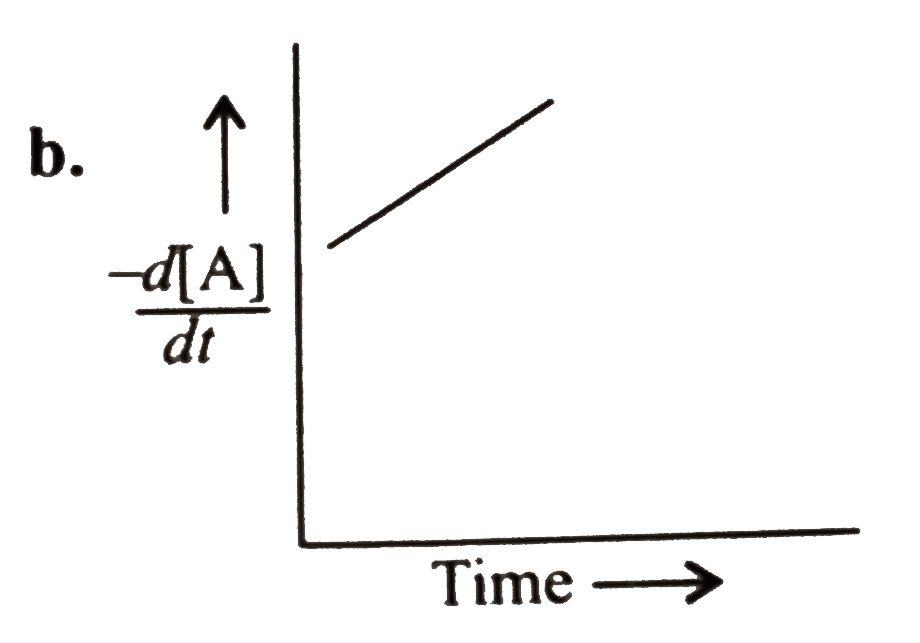 C
C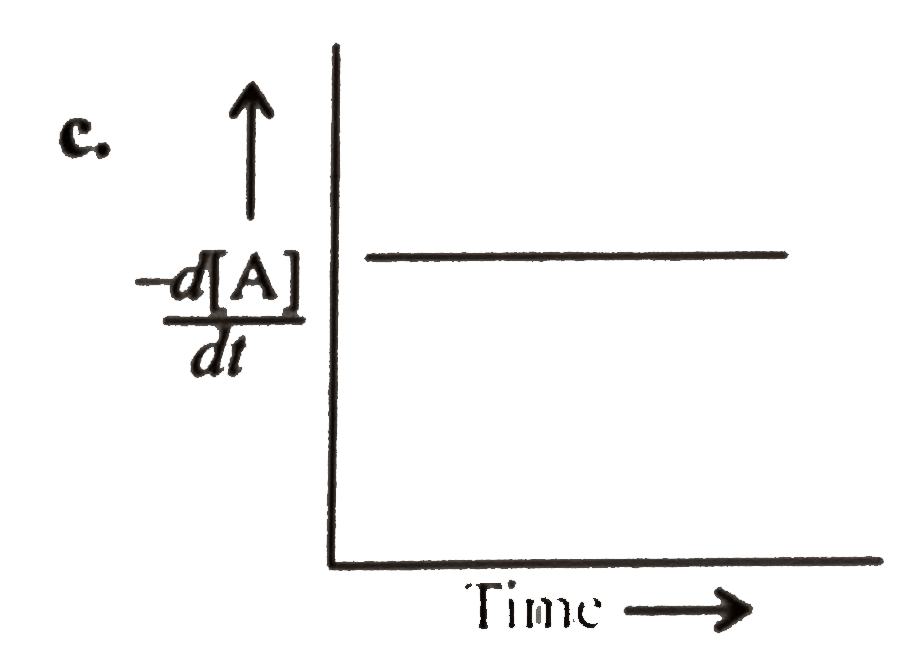 D
D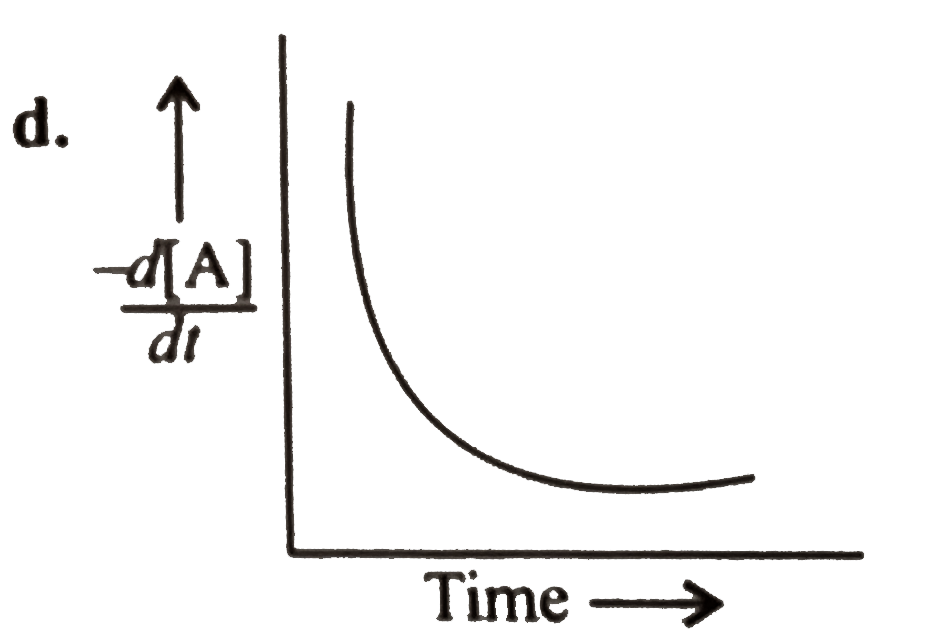
For the reaction R→P, half-life (t1/2) is observed to be independent of initial concentrtion of the reactants. What is the order of the reaction?
View SolutionIn a first order reaction , on plotting a graph between t1/2 and concentration of reactant
View SolutionFor a reaction following nth order kinetics, the half life (t1/2) would depend upon the initial concentration (a) as:
View SolutionFor a reaction following nth order kinetics, the half life (t1/2) would depend upon the initial concentration (a) as:
View SolutionWhich of the following graphs formed plotted between t1/2 and initial concentration (a) represents a zero order reaction ?
View Solution

