The current in a 4.0 mH inductor vaires in time as shown in the figure. The corresponding graph of the self induced emf across the inductor over the time interval t=0 to t=12.0 ms is


The correct Answer is:A
Topper's Solved these Questions
- INDUCTANCEBook:CENGAGE PHYSICSChapter:INDUCTANCEExercise:Multiple Correct Answer
Explore 3 Videos
- INDUCTANCEBook:CENGAGE PHYSICSChapter:INDUCTANCEExercise:Comprehension Type
Explore 9 Videos
- INDUCTANCEBook:CENGAGE PHYSICSChapter:INDUCTANCEExercise:Subective Type
Explore 2 Videos
- HEATING EFFECT OF CURRENTBook:CENGAGE PHYSICSChapter:HEATING EFFECT OF CURRENTExercise:Thermal Power in Resistance Connected in Circuit
Explore 28 Videos
- KINETIC THEORYBook:CENGAGE PHYSICSChapter:KINETIC THEORYExercise:Question Bank
Explore 31 Videos
Similar Questions
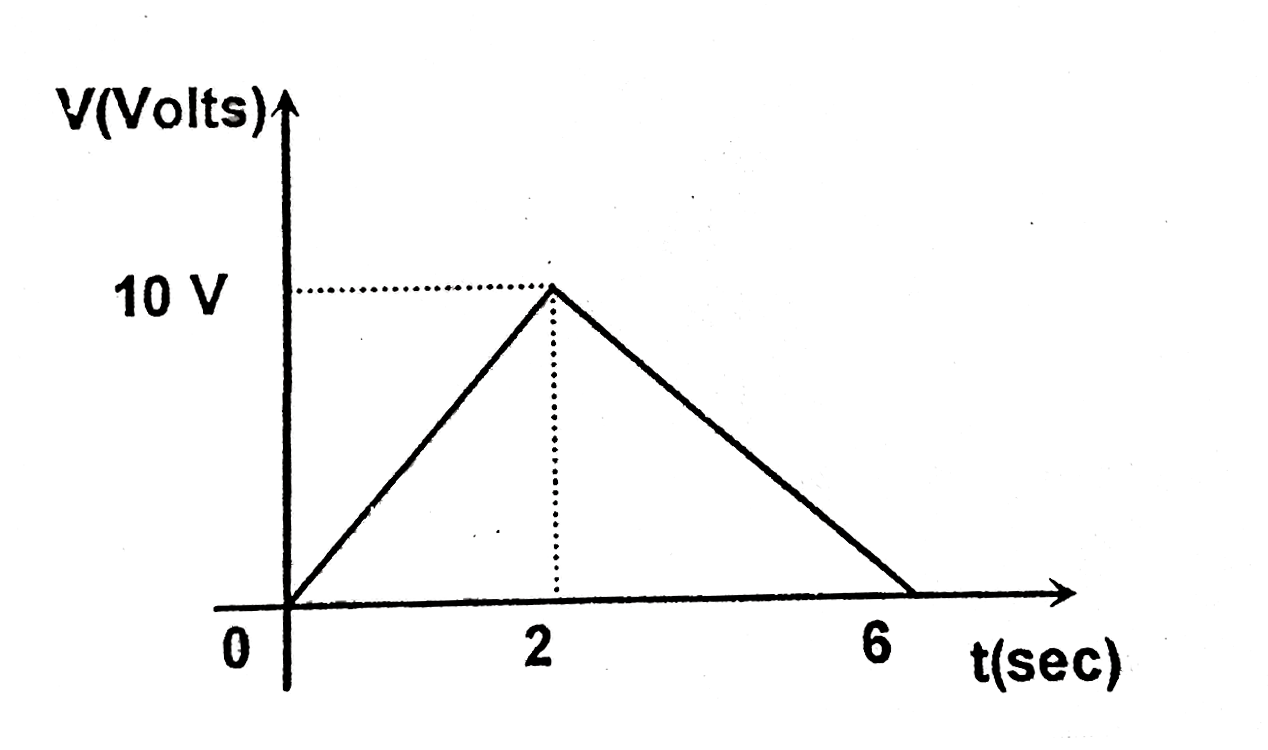
The potential difference across a 10H inductor as a function of time is shown in the figure. At t=0 current is zero. Then
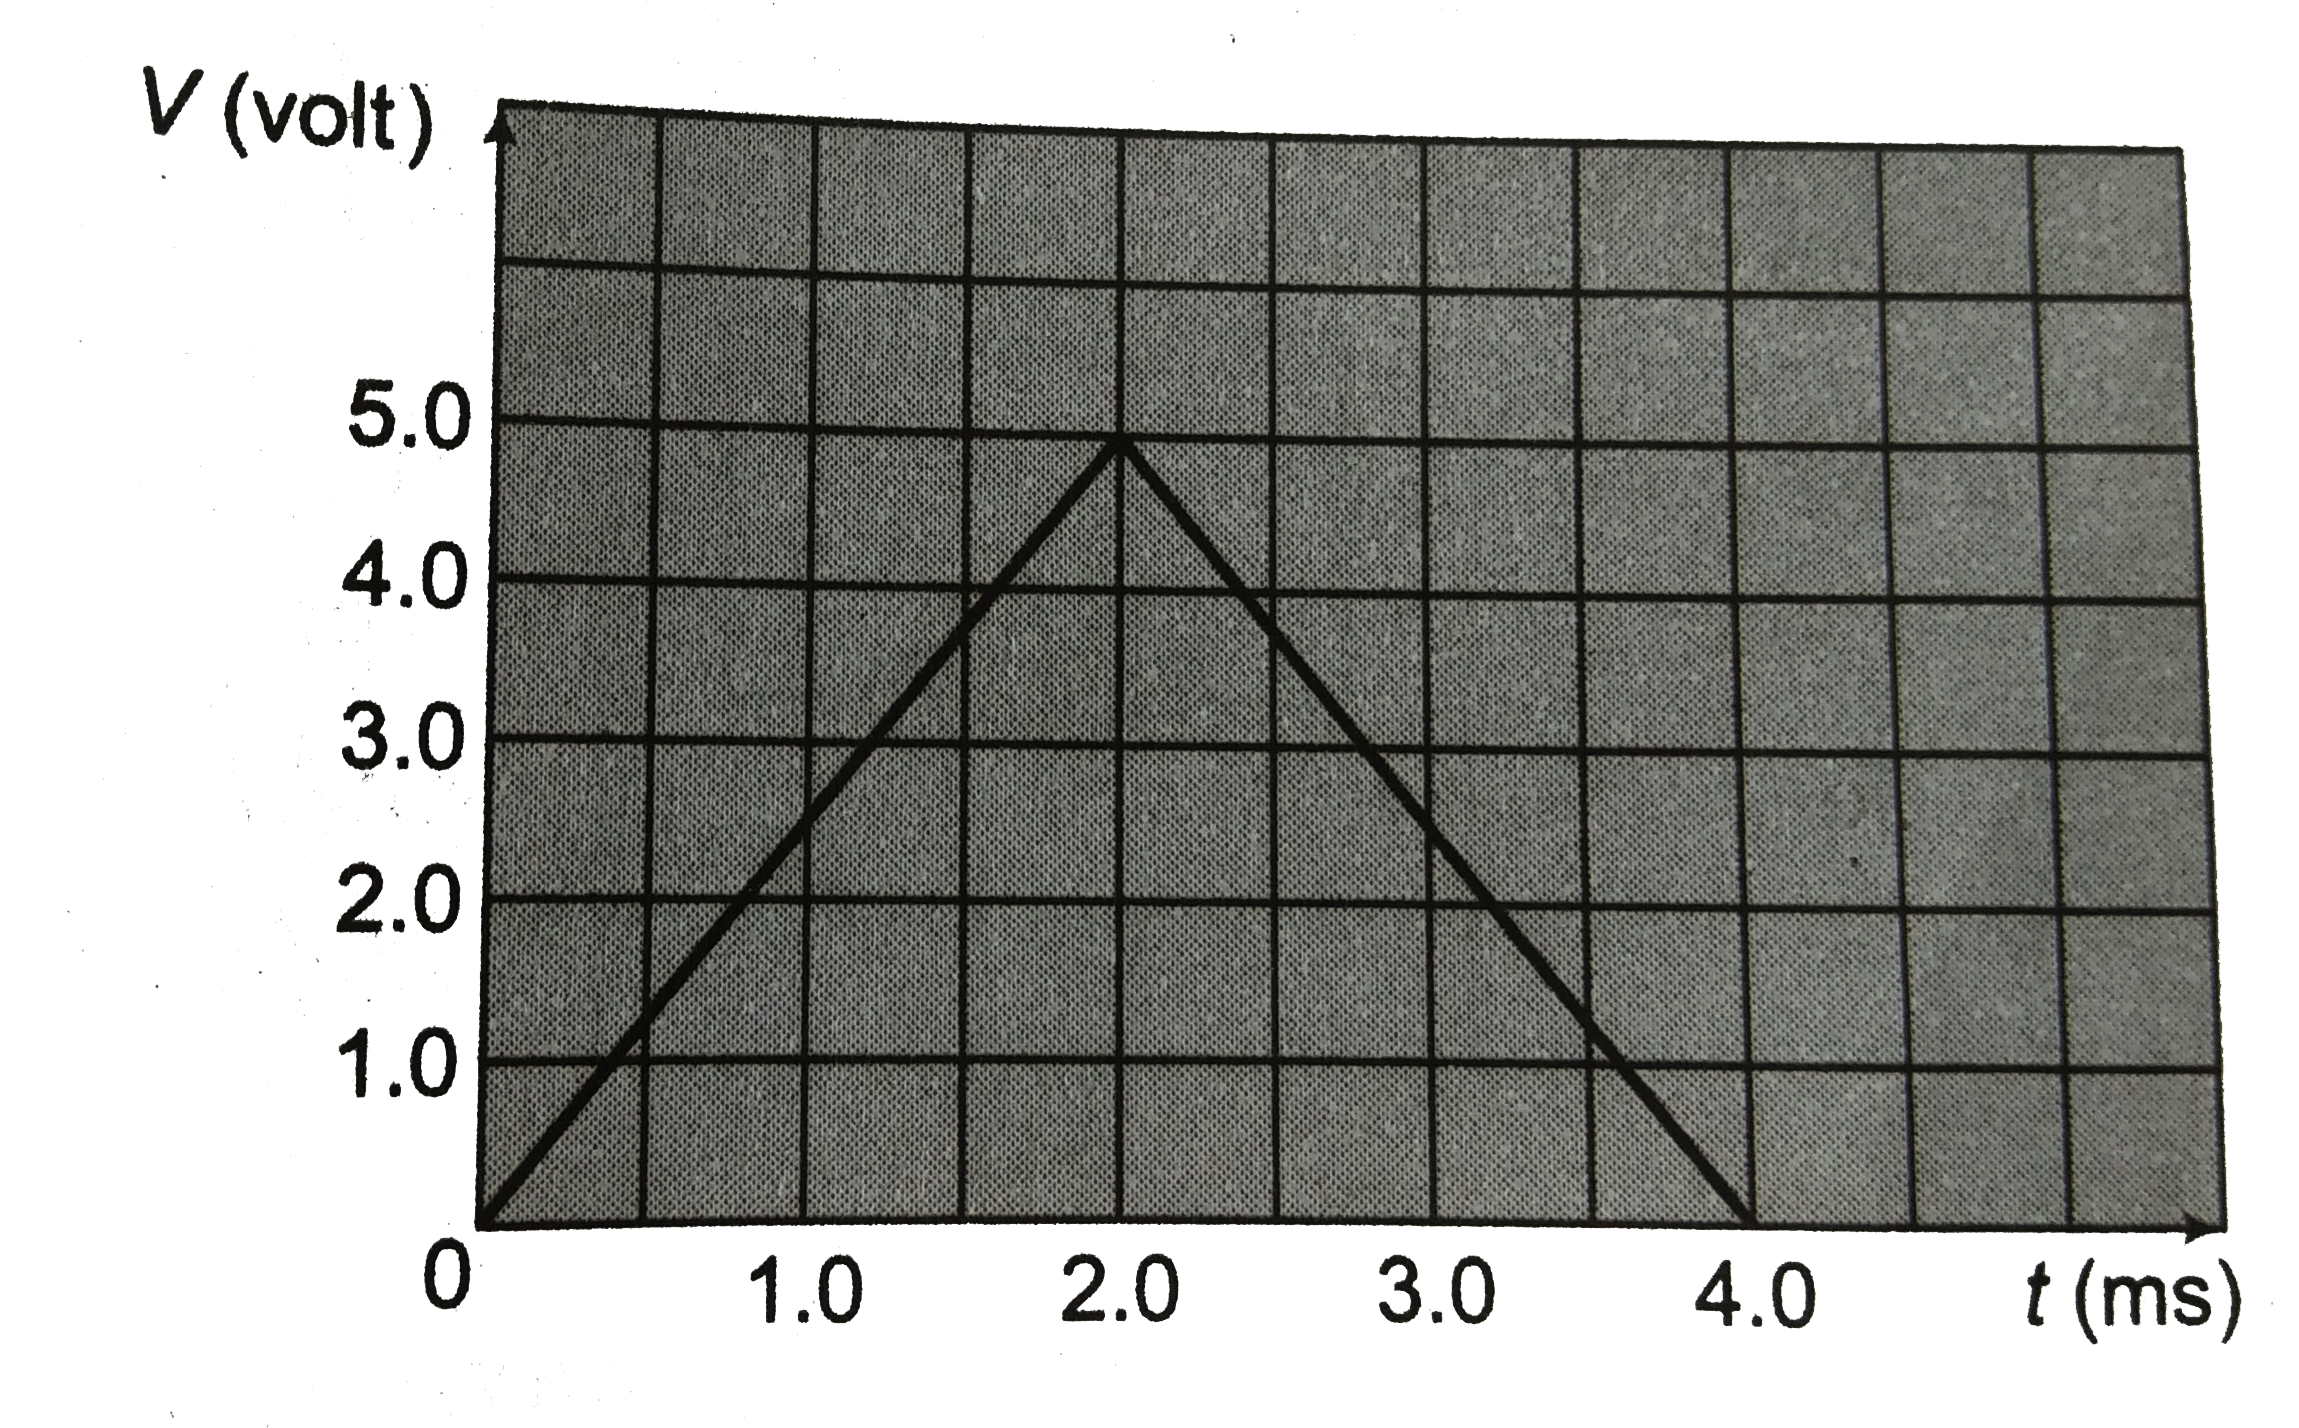
View SolutionThe potential difference across a 150mH inductor as a function of time is shown in figure. Assume that the initial value of the current in the inductor is zero. What is the current when t=2.0ms? and t=4.0ms ?
View Solution
Knowledge Check
The current in a 90mH inductor changes with time as i=1.0t2, where I is in amperes and t is in seconds.
Athe magnitude of the induced emf at t=4.0s is 180 mVBthe emf zero at time t=3.0sCthe magnitude of the induced emf at t=4.0s is 360 mVDthe emf zero at time t=4.0sThe potential difference across a 10H inductor as a function of time is shown in the figure. At t=0 current is zero. Then
 AThe current in the inductor at t=6 is 3 ampBThe current in the inductor at t=1 sec is 1/4 ampCThe current in the inductor at t=4 is 5/2 amp.DThe variation of current versus time parabola.
The potential difference a 2H inductor as a function of time is shown in figure. At time t=0, current is zero
Current versus time graph across the inductor will beA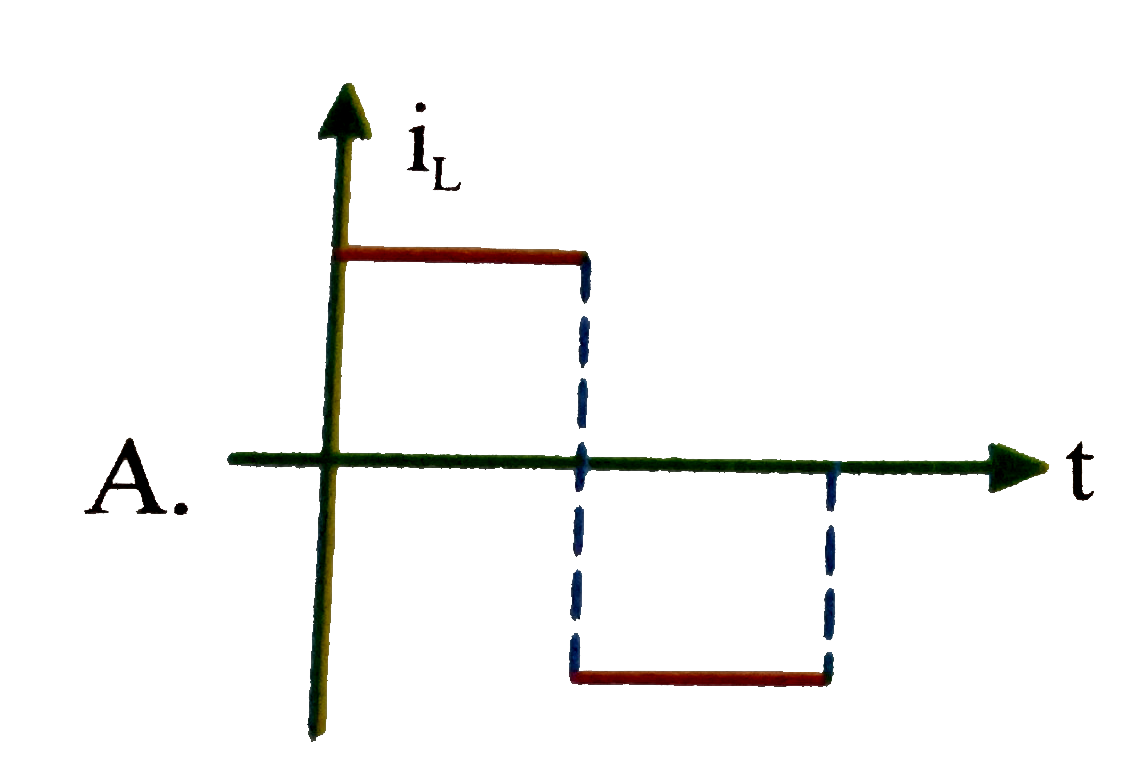 B
B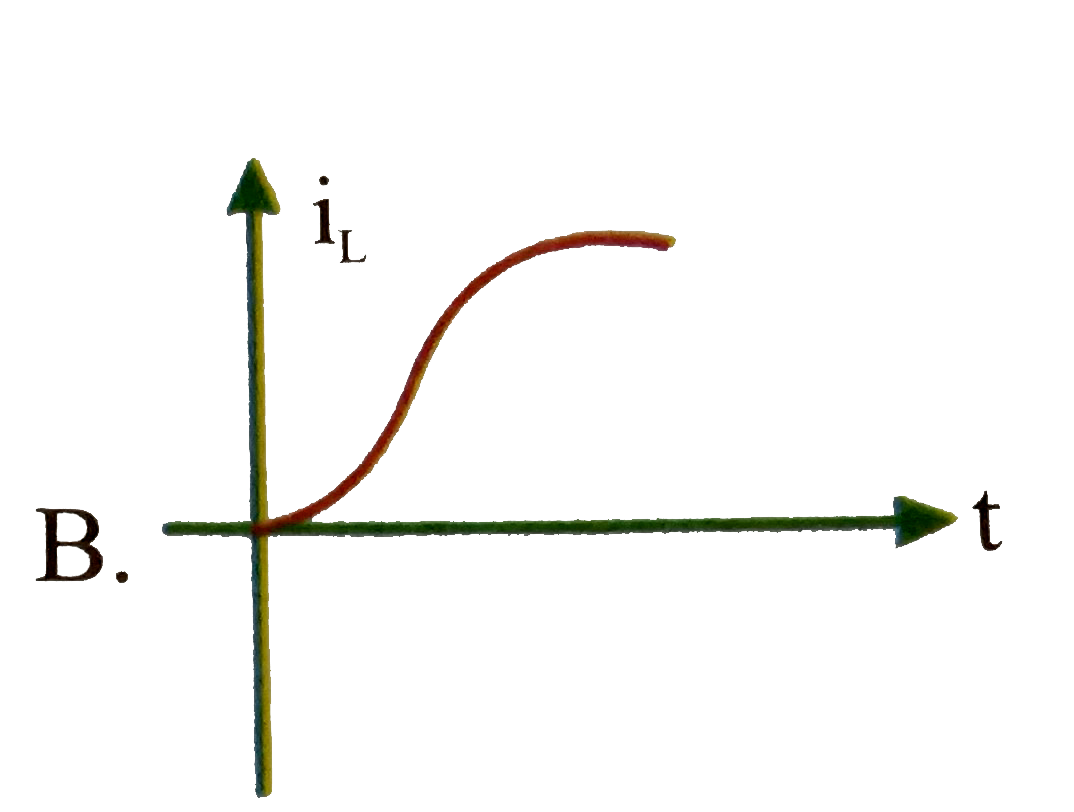 C
C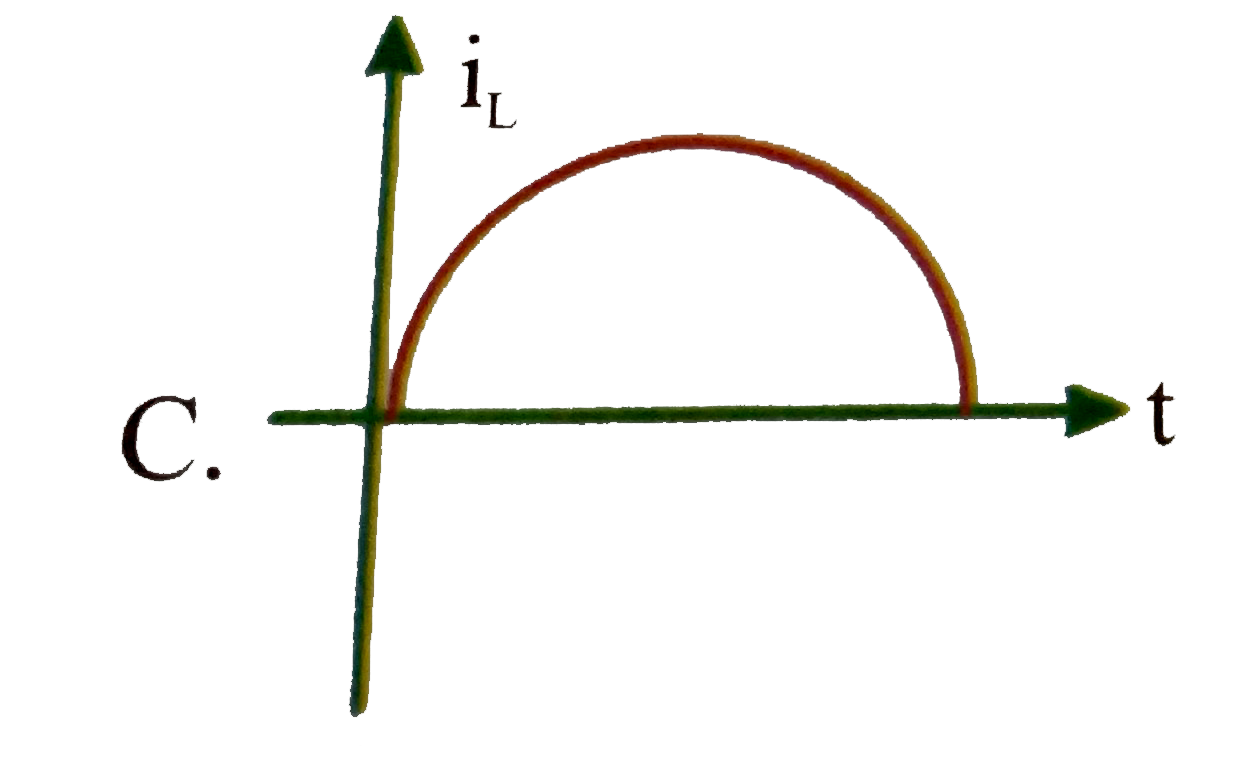 D
D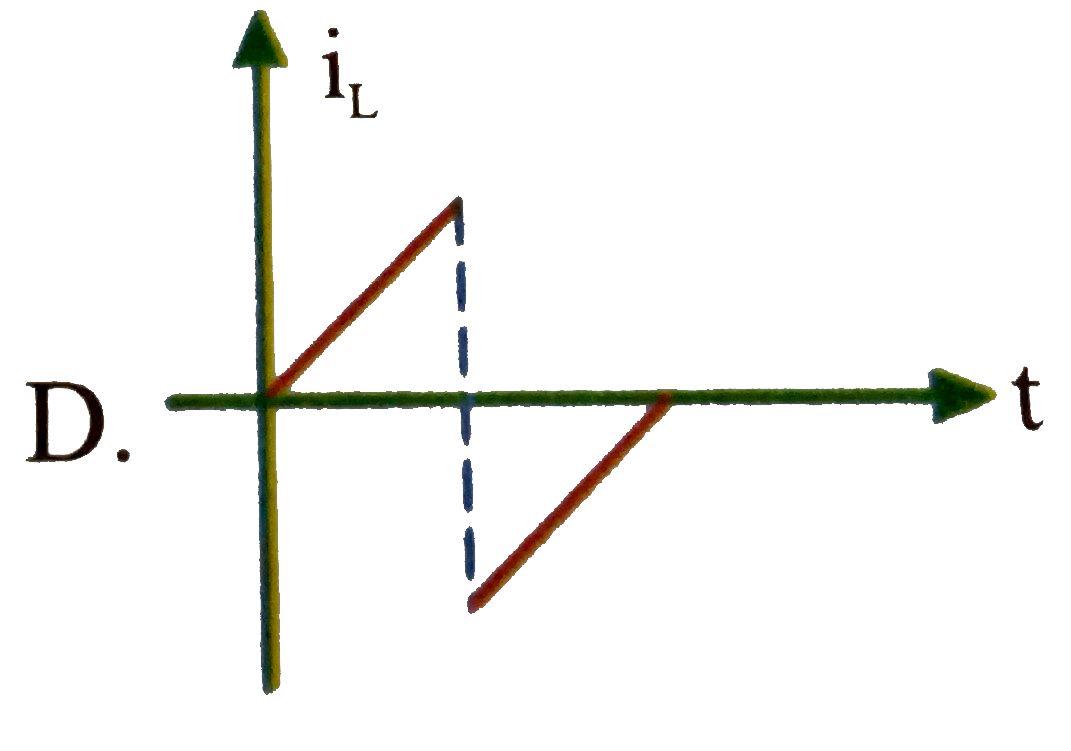
The potential difference across a 150mH inductor as a function of time is shown in figure. Assume that the initial value of the current in the inductor is zero. What is the current when t=2.0ms? and t=4.0ms ?

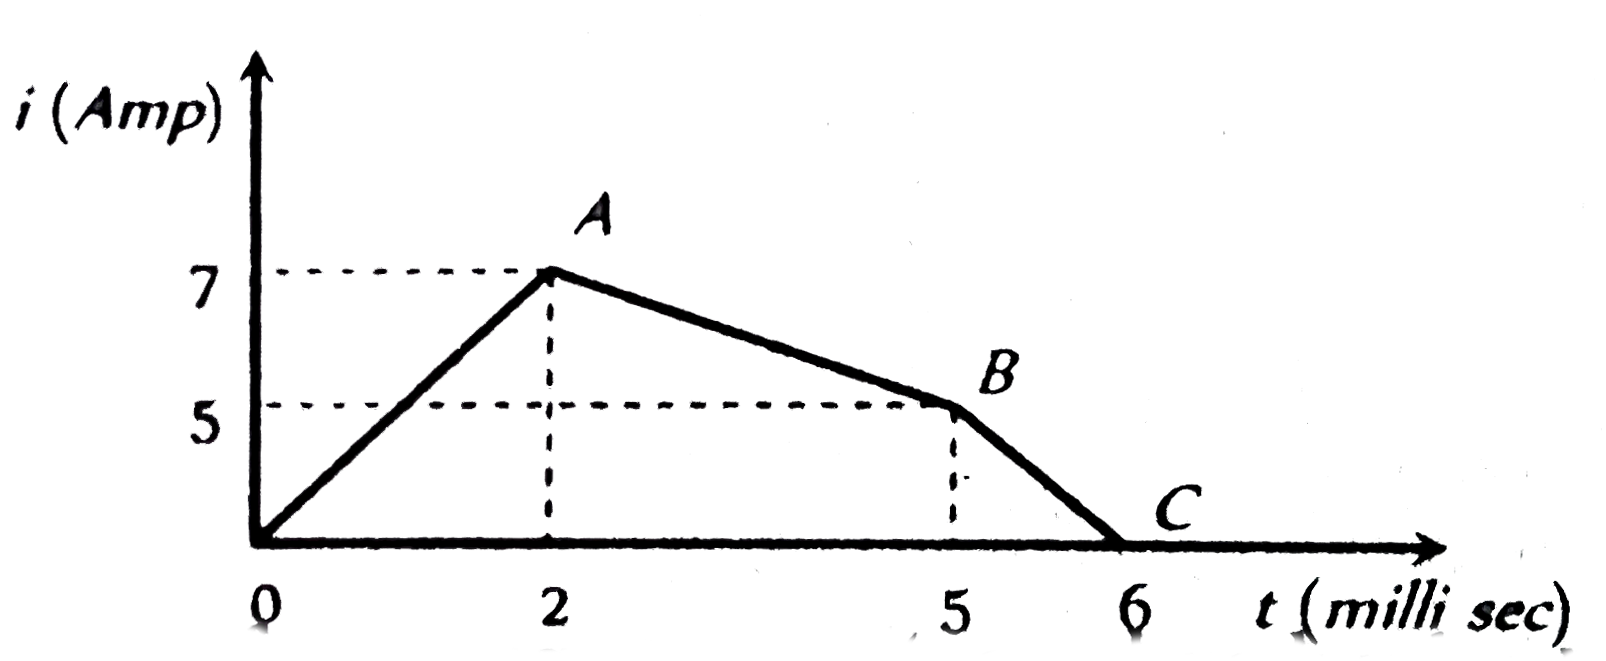
View SolutionThe current through a 4.6 H inductor is shown in the following graph. The induced emf during the time interval t = 5 milli - sec to 6 milli - sec will be
View SolutionThe current in a 90mH inductor changes with time as i=1.0t2−6t, where I is in amperes and t is in seconds.
View SolutionThe potentiak difference across a 2H inductor as a function of time is shown in the figure. At time t=0, current is zero.
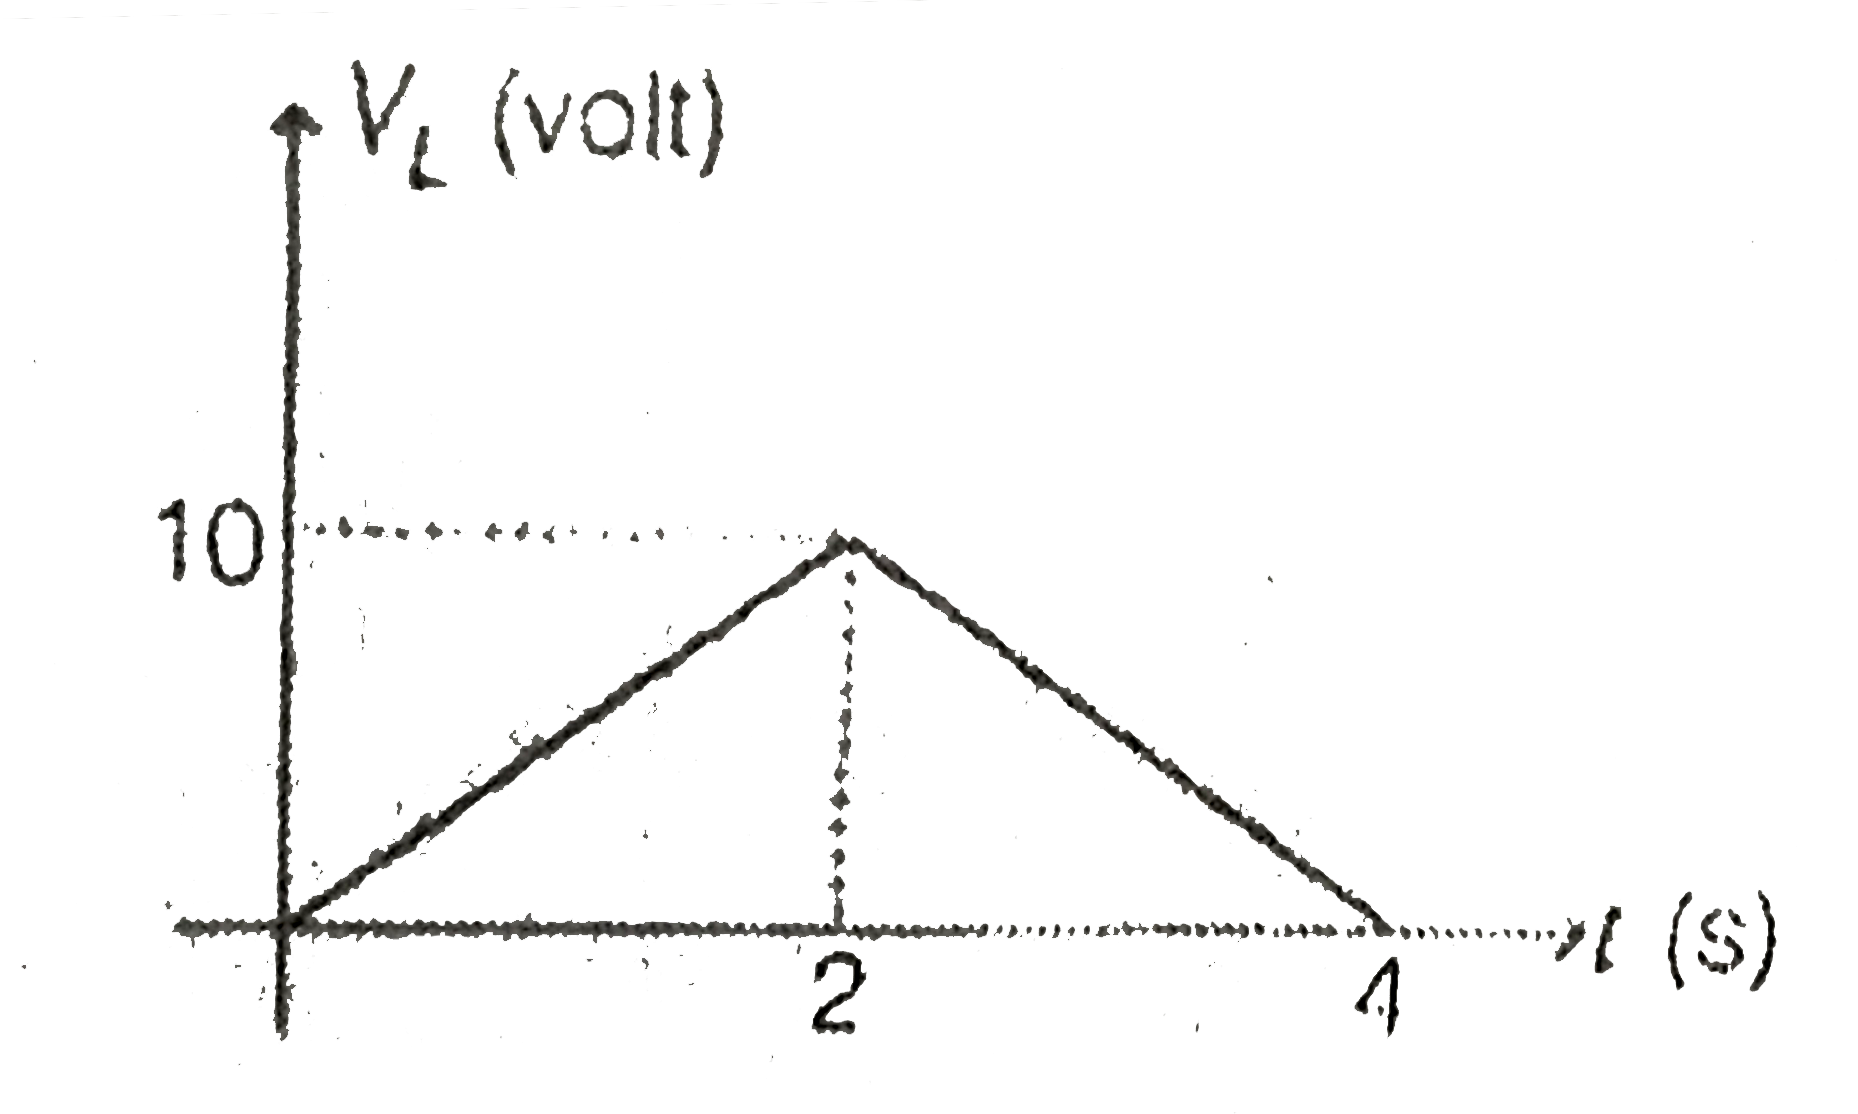
Current versus time graph across the inductor will be
View SolutionThe current through a 4.6 H inductor is shown in the following graph. The induced emf during the time interval t = 5 milli - sec to 6 milli - sec will be

View Solution
