The figure shows a graph between and , where is the area enclosed by the orbit in a hydrogen like atom. The correct curve is

4
3
2
1
The correct Answer is:A
Step by step video, text & image solution for The figure shows a graph between 1n |(A_(n))/(A_(1))| and 1n|n|, where A_(n) is the area enclosed by the n^(th) orbit in a hydrogen like atom. The correct curve is by Physics experts to help you in doubts & scoring excellent marks in Class 12 exams.
Topper's Solved these Questions
- BOOK - CENGAGE PHYSICSCHAPTER - ATOMIC PHYSICSEXERCISE - dpp 4.215videos
ATOMIC PHYSICS
- BOOK - CENGAGE PHYSICSCHAPTER - ATOMIC PHYSICSEXERCISE - ddp.4.315videos
ATOMIC PHYSICS
- BOOK - CENGAGE PHYSICSCHAPTER - ATOMIC PHYSICSEXERCISE - Linked comprehension type6videos
ATOMIC PHYSICS
- BOOK - CENGAGE PHYSICSCHAPTER - ALTERNATING CURRENTEXERCISE - QUESTION BANK65videos
ALTERNATING CURRENT
- BOOK - CENGAGE PHYSICSCHAPTER - ATOMSEXERCISE - QUESTION BANK40videos
ATOMS
Similar Questions
Find a1anda9 if an is given by an=n2n+1
View SolutionLet A1,A2,A3, ........ be squares such that for each n≥1, the length of the side of An equals the length of diagonal of An+1. If the length of A1 is 12 cm, then the smallest value of n for which area of An is less than one, is ______.
View Solution
Knowledge Check
- Question 1 - Select One or More
Let An be the area enclosed by the nth orbit in a hydrogen atom. The graph of ln(An/At) against In (n)
Awill pass through the originBwill have certain point lying on a straight line with slope 4Cwill be a monotonically increasing nonlinear curveDwill be a circle - Question 2 - Select One
In hydrogen atom, the area enclosed by nth orbit is An. The graph between log (AnA1) log will be
A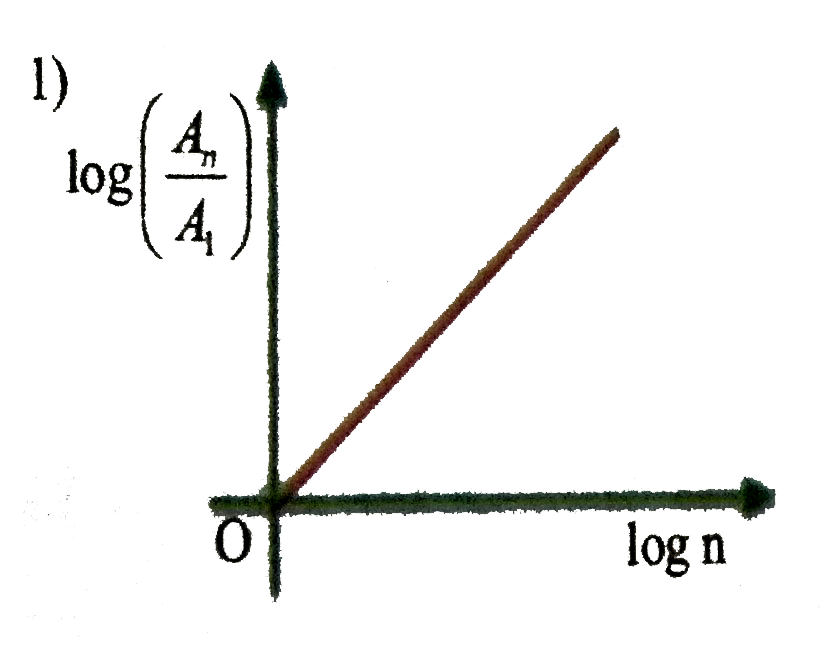 B
B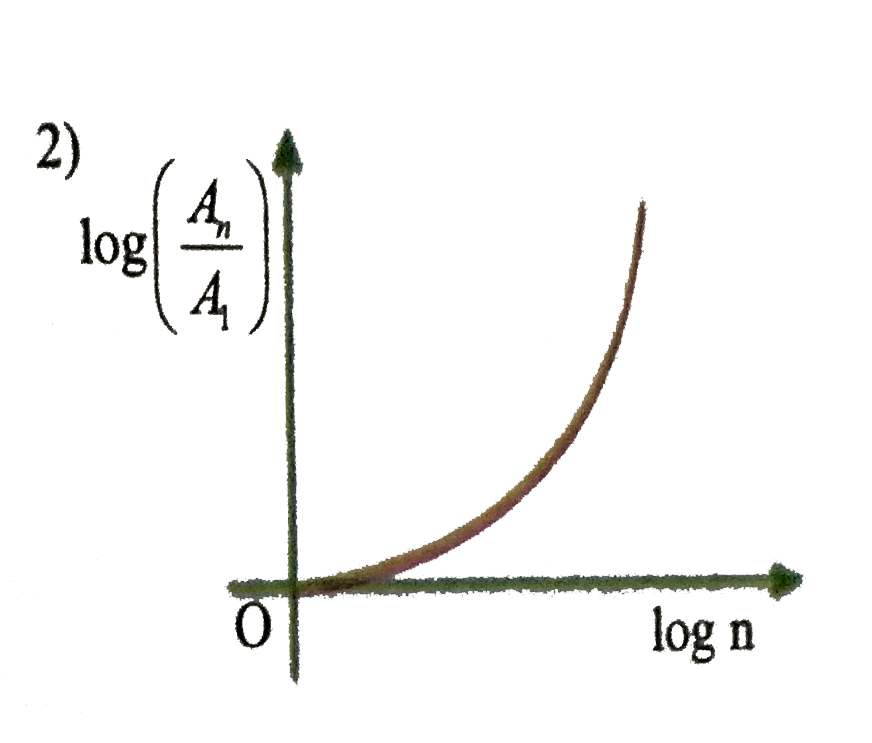 C
C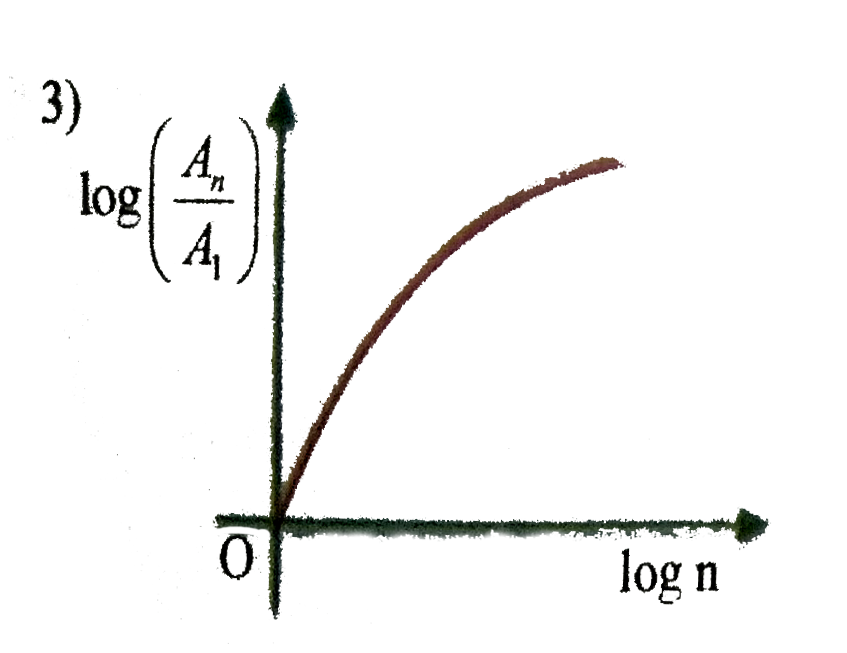 D
D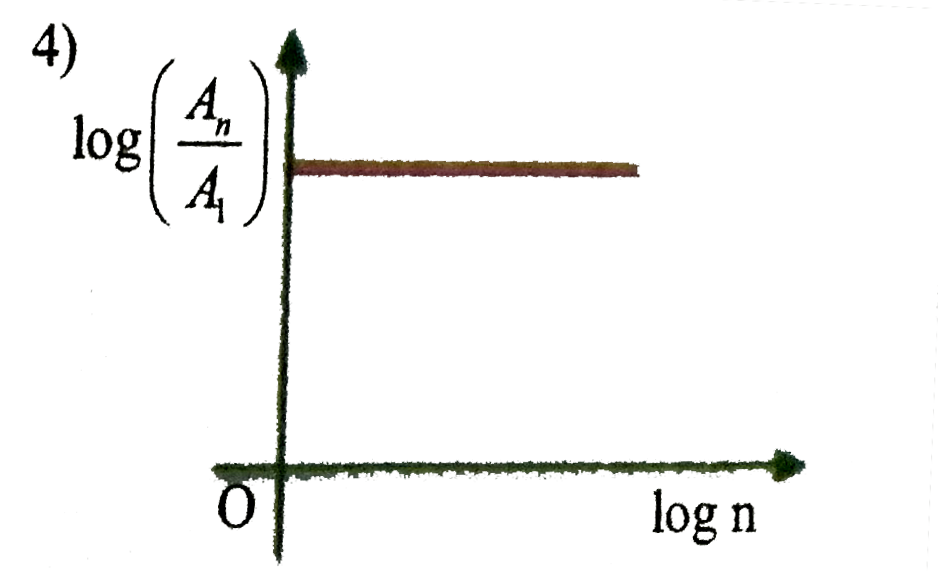
- Question 3 - Select One or More
If, in a hydrogen atom, radius of nth Bohr orbit is rn frequency of revolution of electron in nth orbit is fn and area enclosed by the nth orbit is An , then which of the pollowing graphs are correct?
A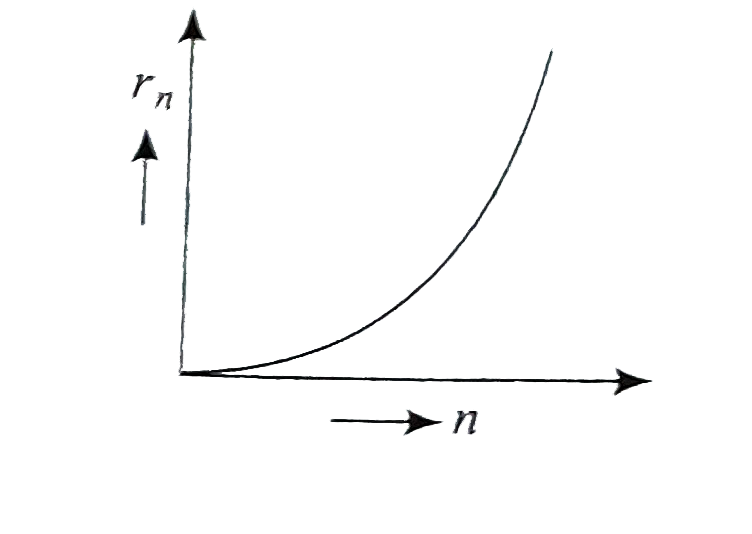 B
B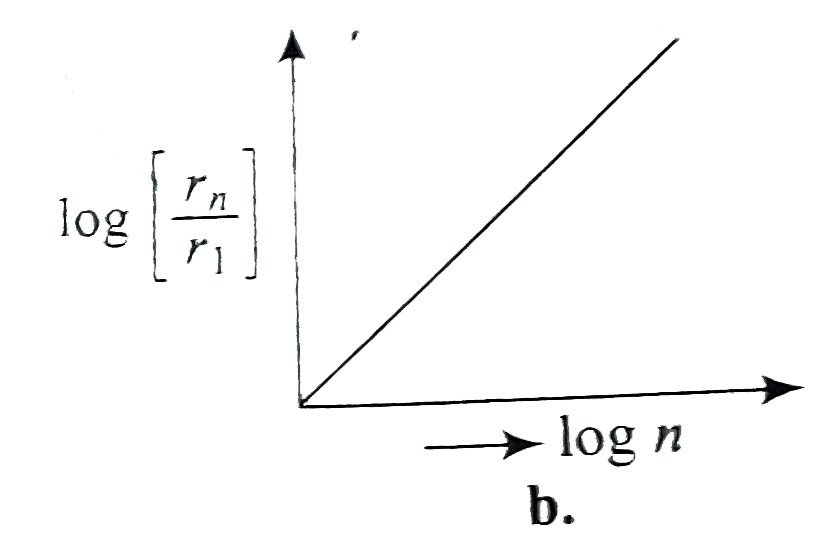 C
C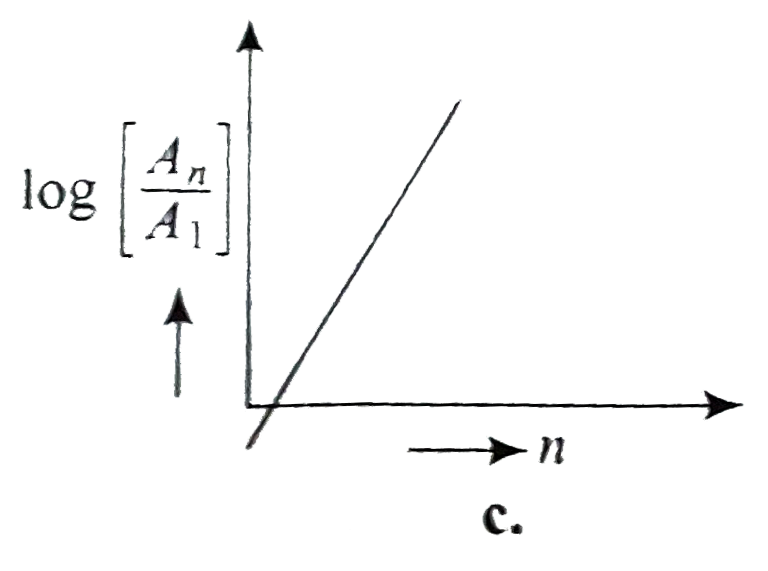 D
D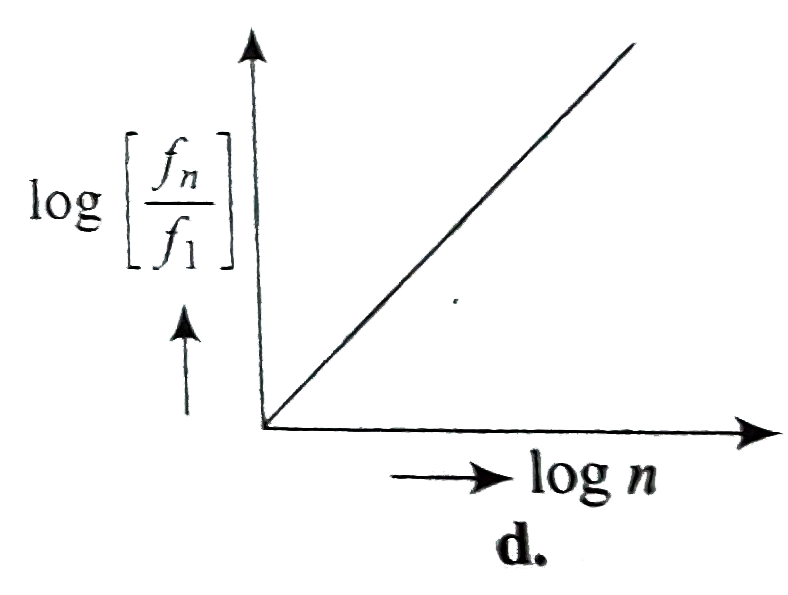
A sequence is defined as follows :
a1=3,an=2an−1+1, where n>1. Where n>1. Find an+1an for n = 1, 2, 3.View SolutionIf an+1=11−an for n≥1 and a3=a1. then find the value of (a2001)2001.
View SolutionIf a1=1,an+1=1n+1an,a≥1, then prove by induction that an+1=1(n+1)!n∈N.
View SolutionLet A1,A2,A3,…..,An be squares such that for each n≥1 the length of a side of An equals the length of a diagonal of An+1. If the side of A1 be 20 units then the smallest value of 'n' for wheich area of An is less than 1.
View SolutionFor a H-like species if area A1 is of ground state orbit and area An is of nth orbit, then, the plot of AnA1 us n2 looks like:
View Solution

