Which of following graphs correctly represents the variation of particle momentum with de-Broglie wavelength?
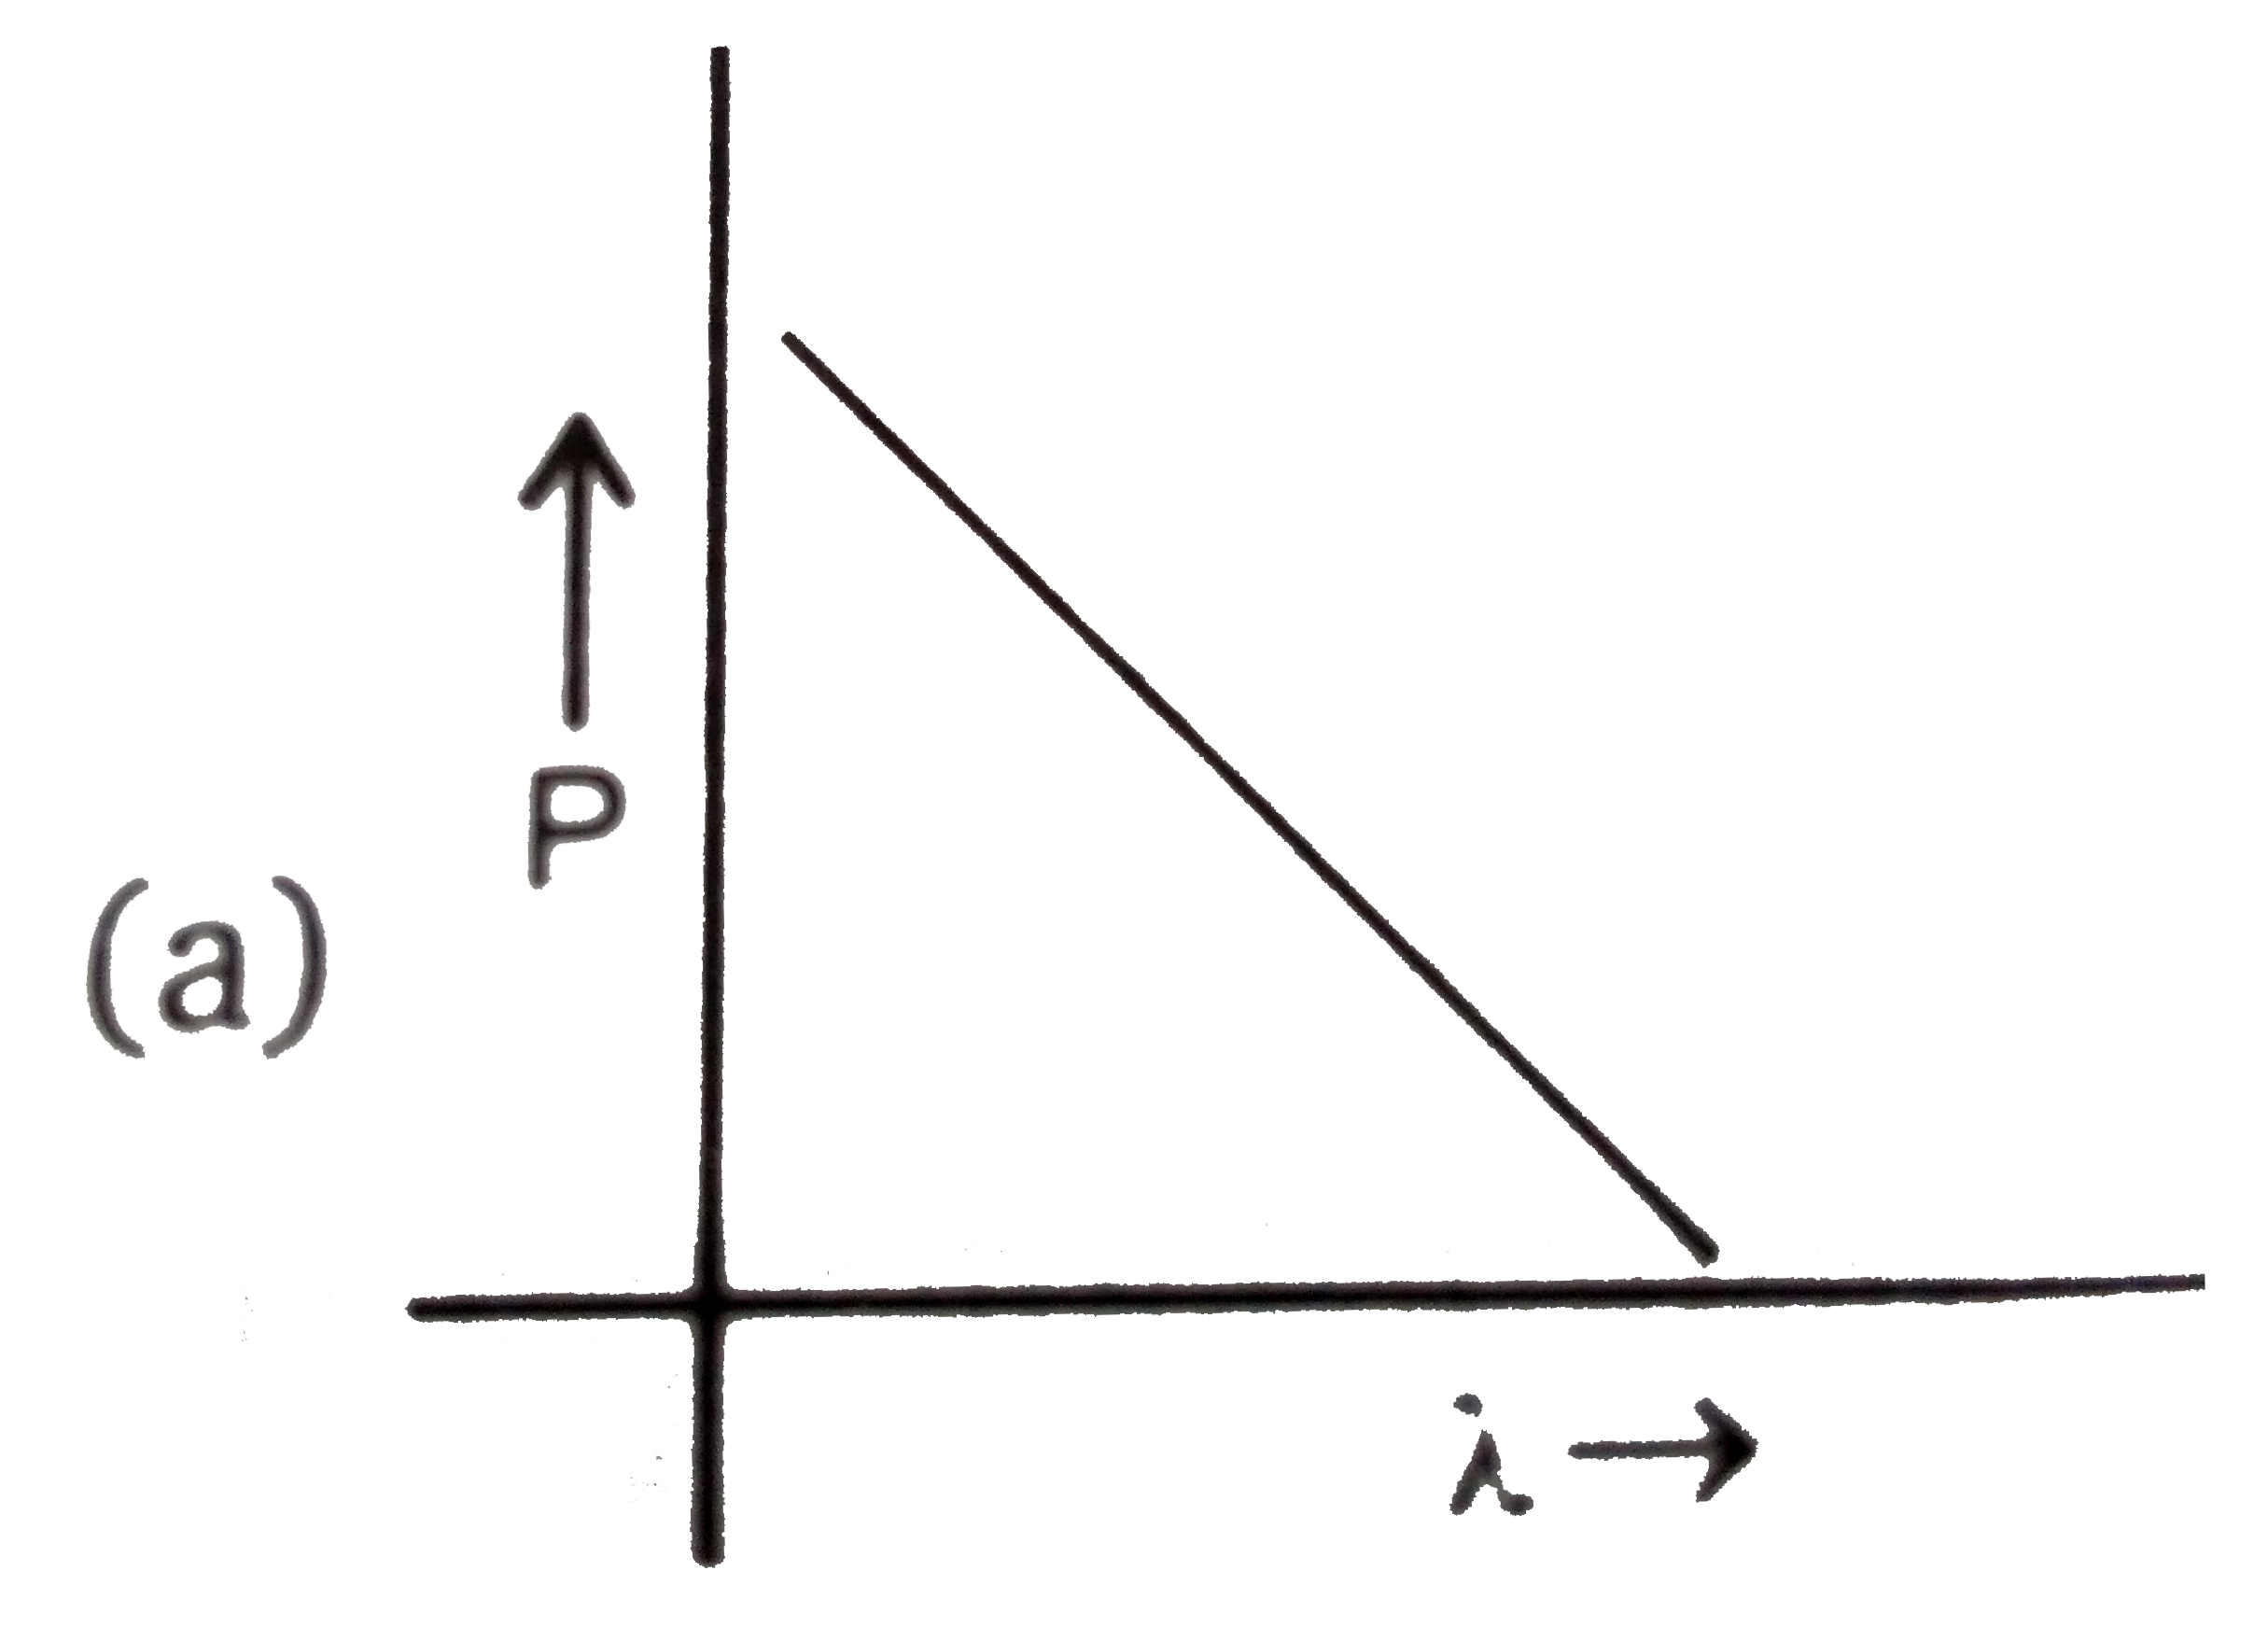
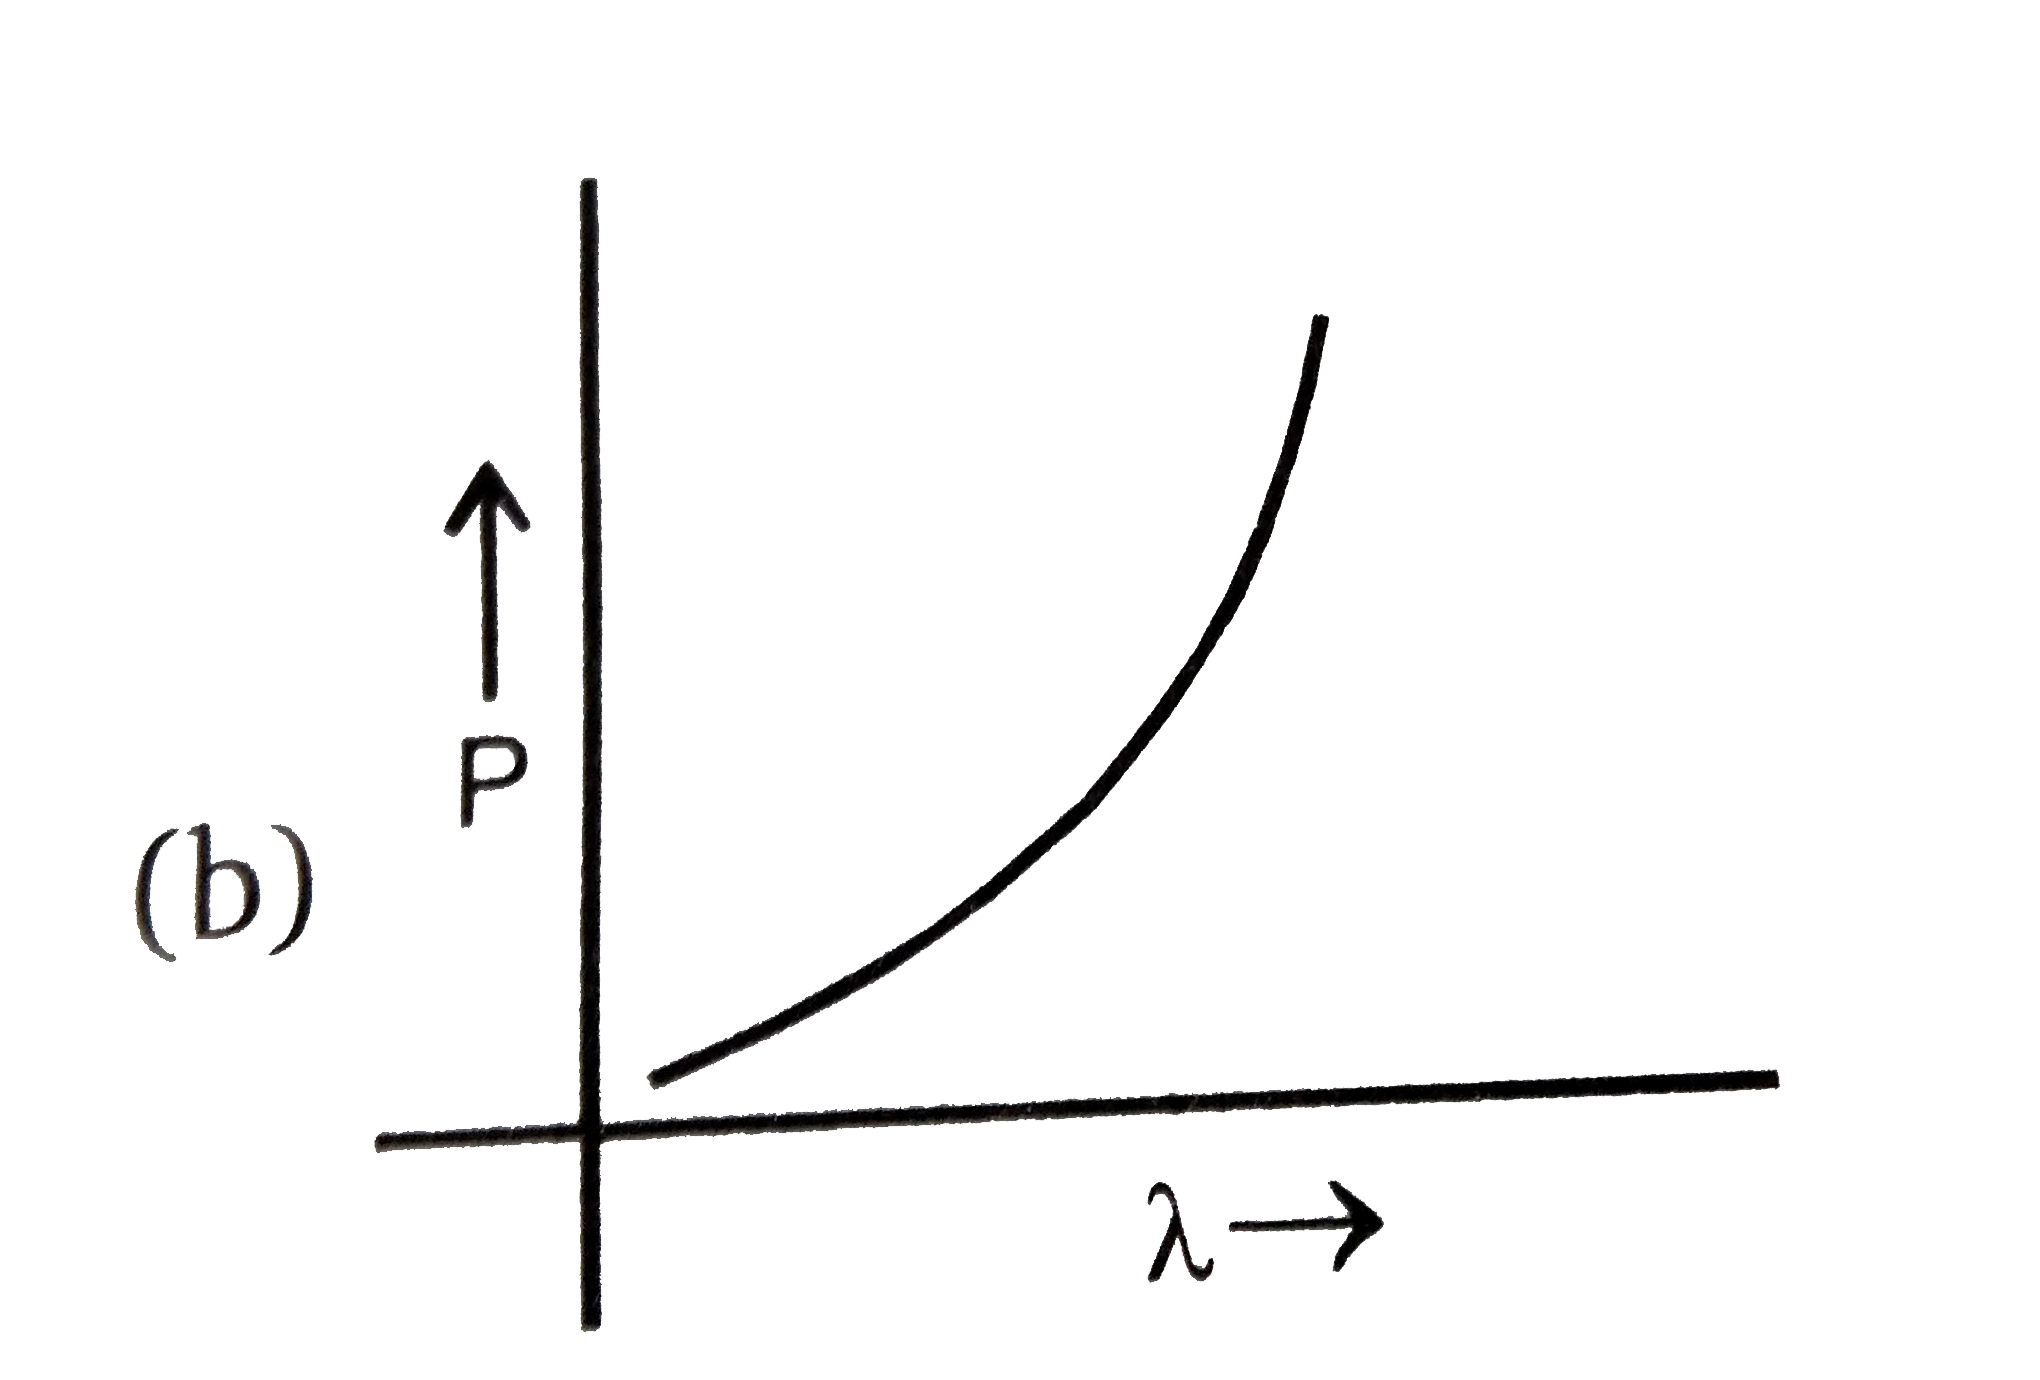
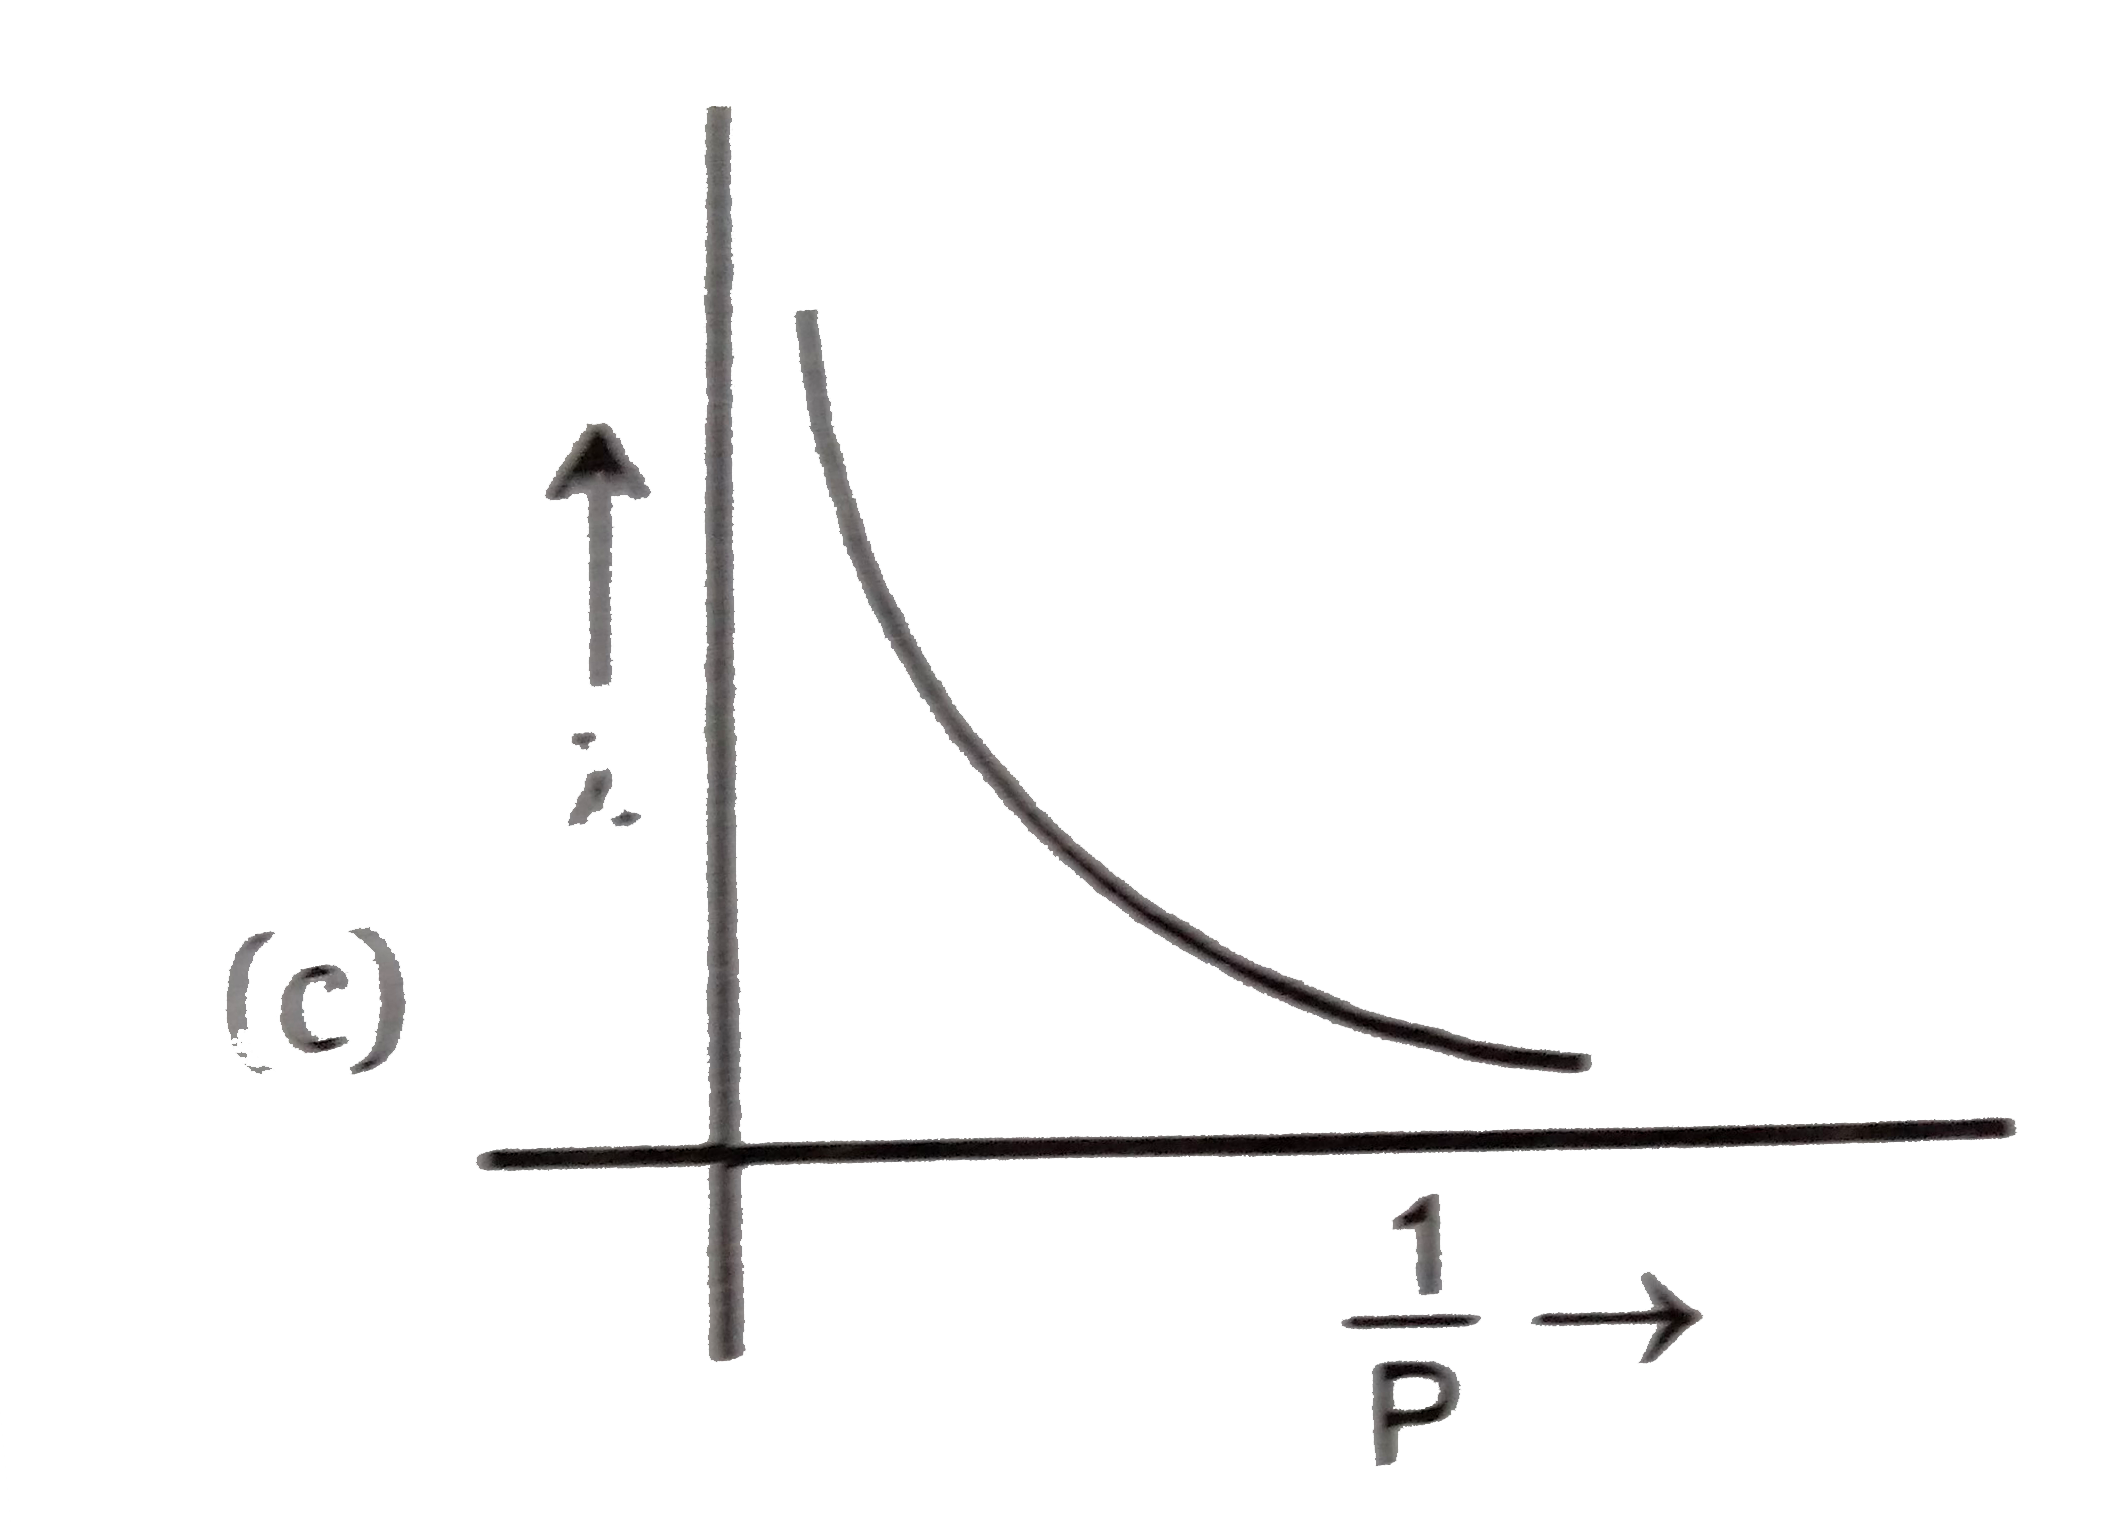
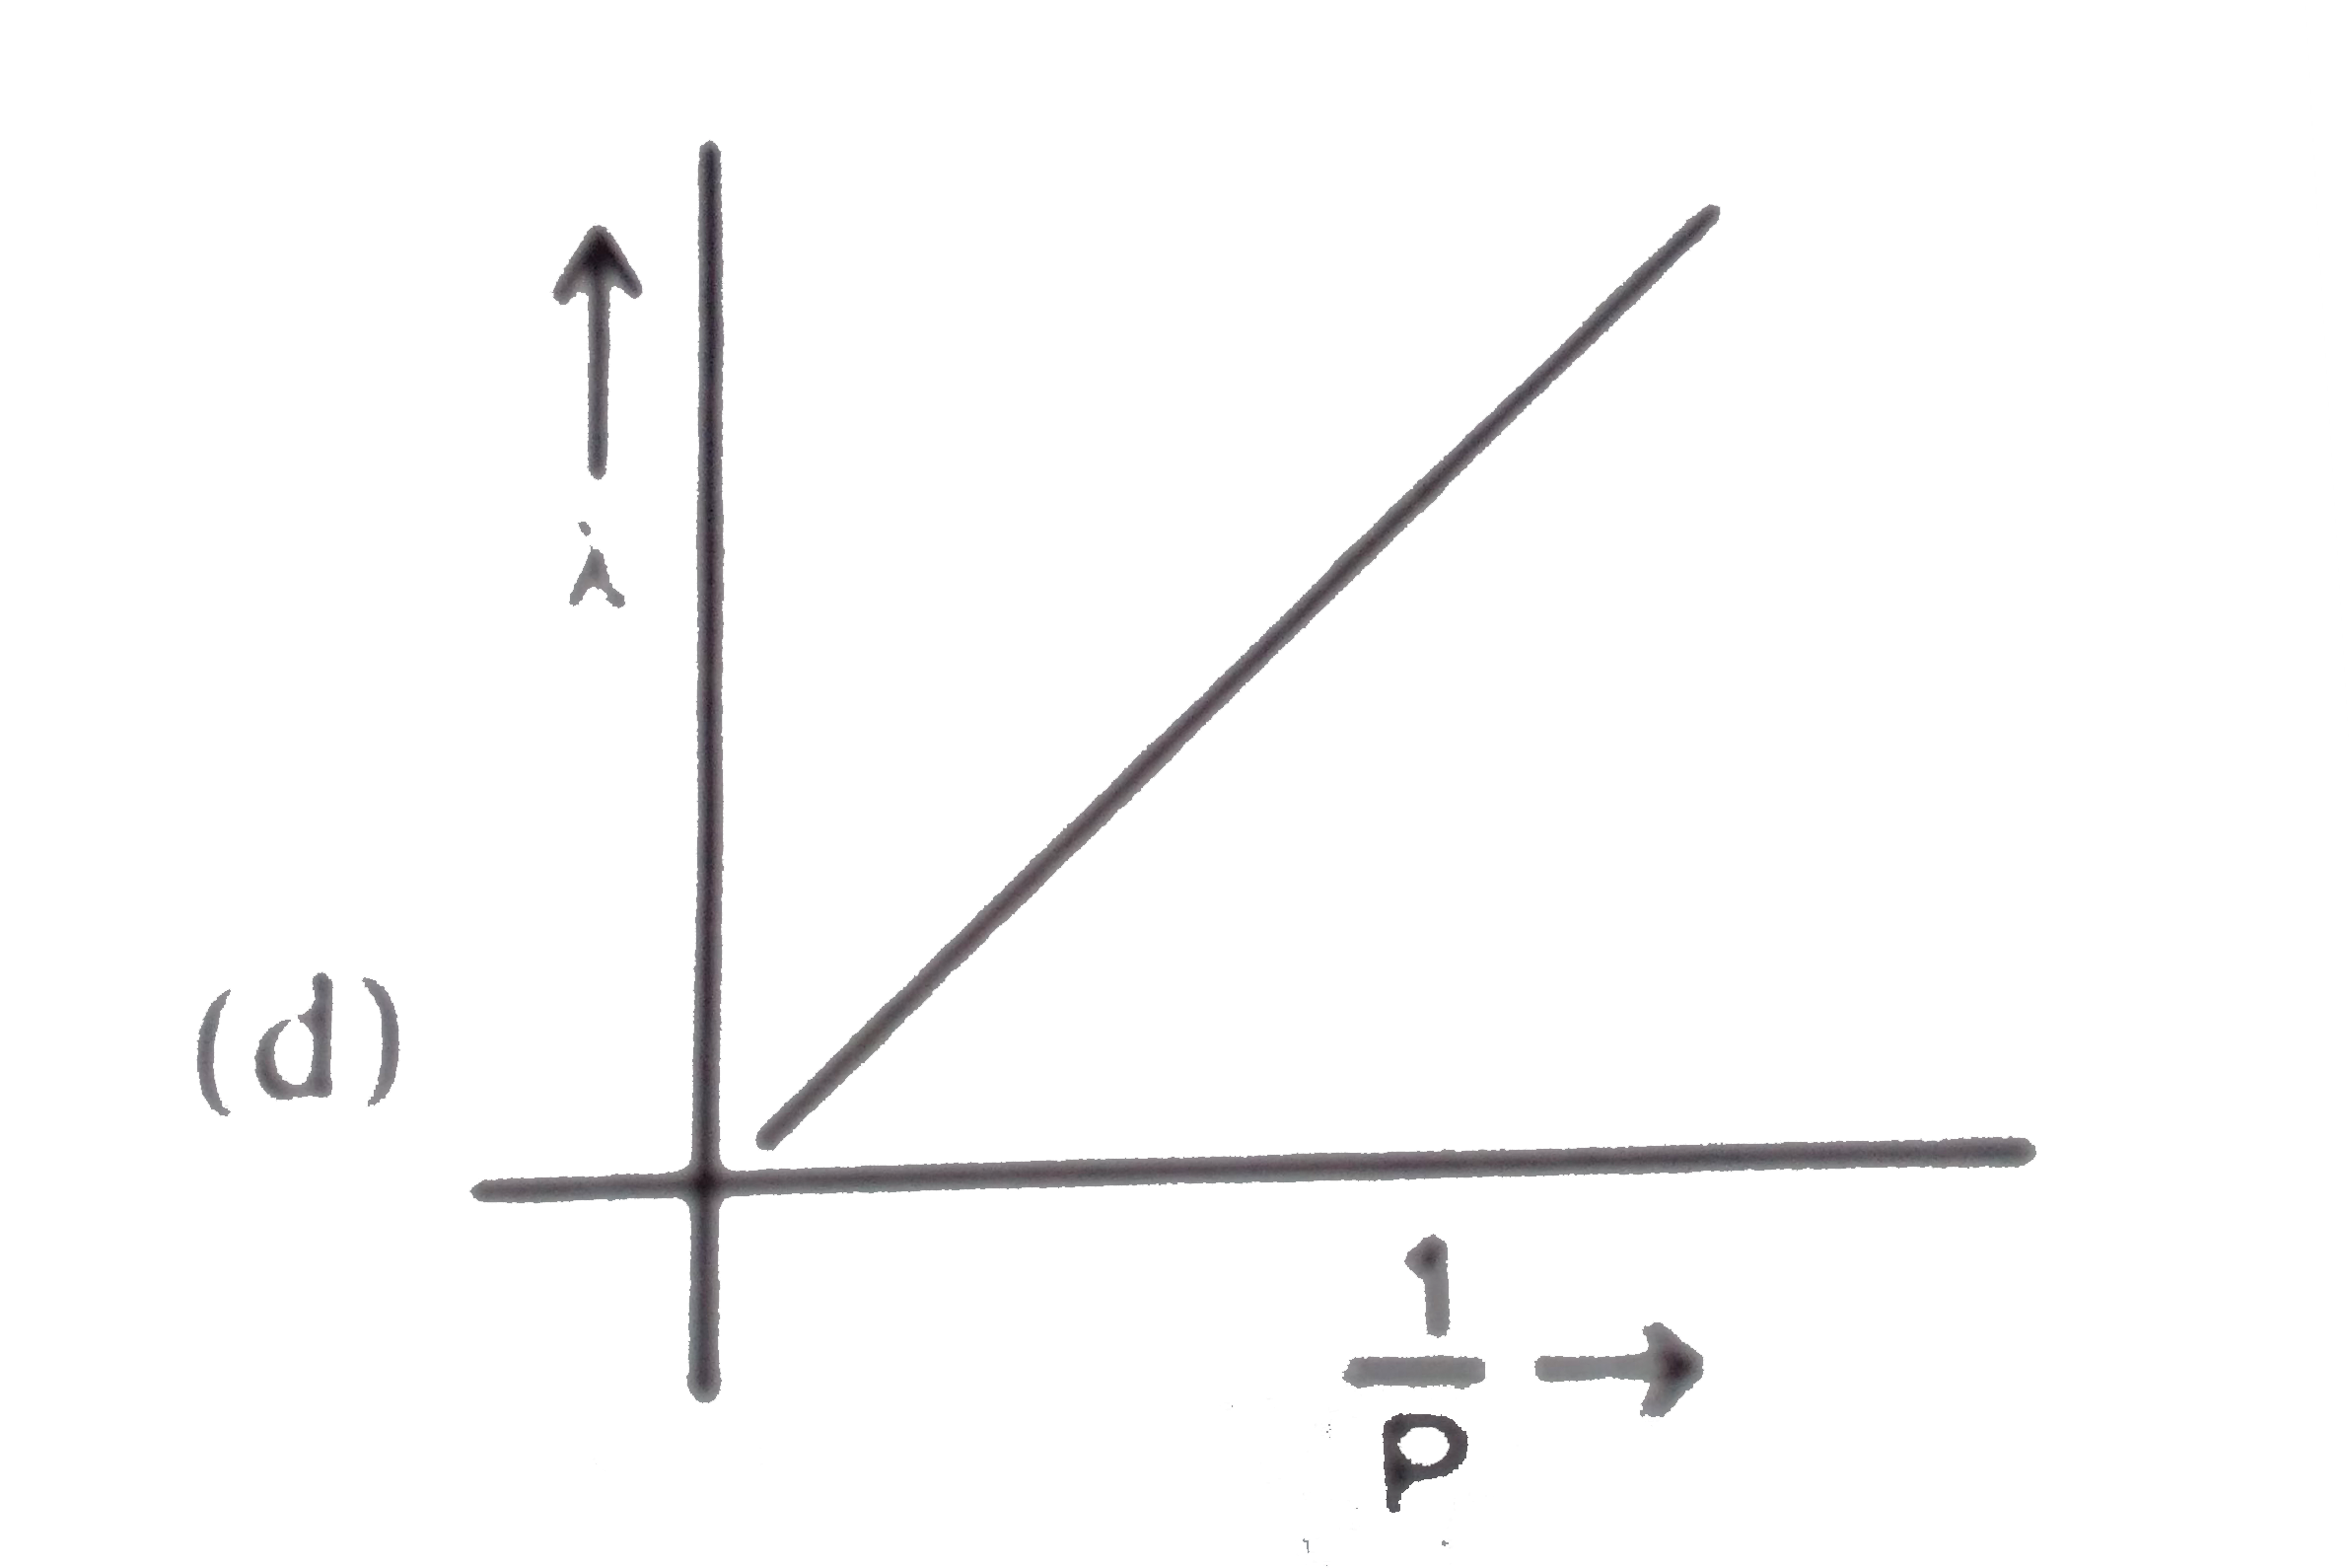
Step by step video & image solution for Which of following graphs correctly represents the variation of particle momentum with de-Broglie wavelength? by Chemistry experts to help you in doubts & scoring excellent marks in Class 11 exams.
Updated on:21/07/2023Topper's Solved these Questions
Similar Questions
The velocity -displacement graph of a particle is as shown in the figure. Which of the following graphs correctly represents the variation of acceleration with displacement?

View SolutionWhich of the following figure represents the variation of particle momentum and the associated de - Broglie wavelength ?
View Solution
Knowledge Check
Which of the following graphs correctly represents the variation of particle momentum with associated de Broglie wavelength?
A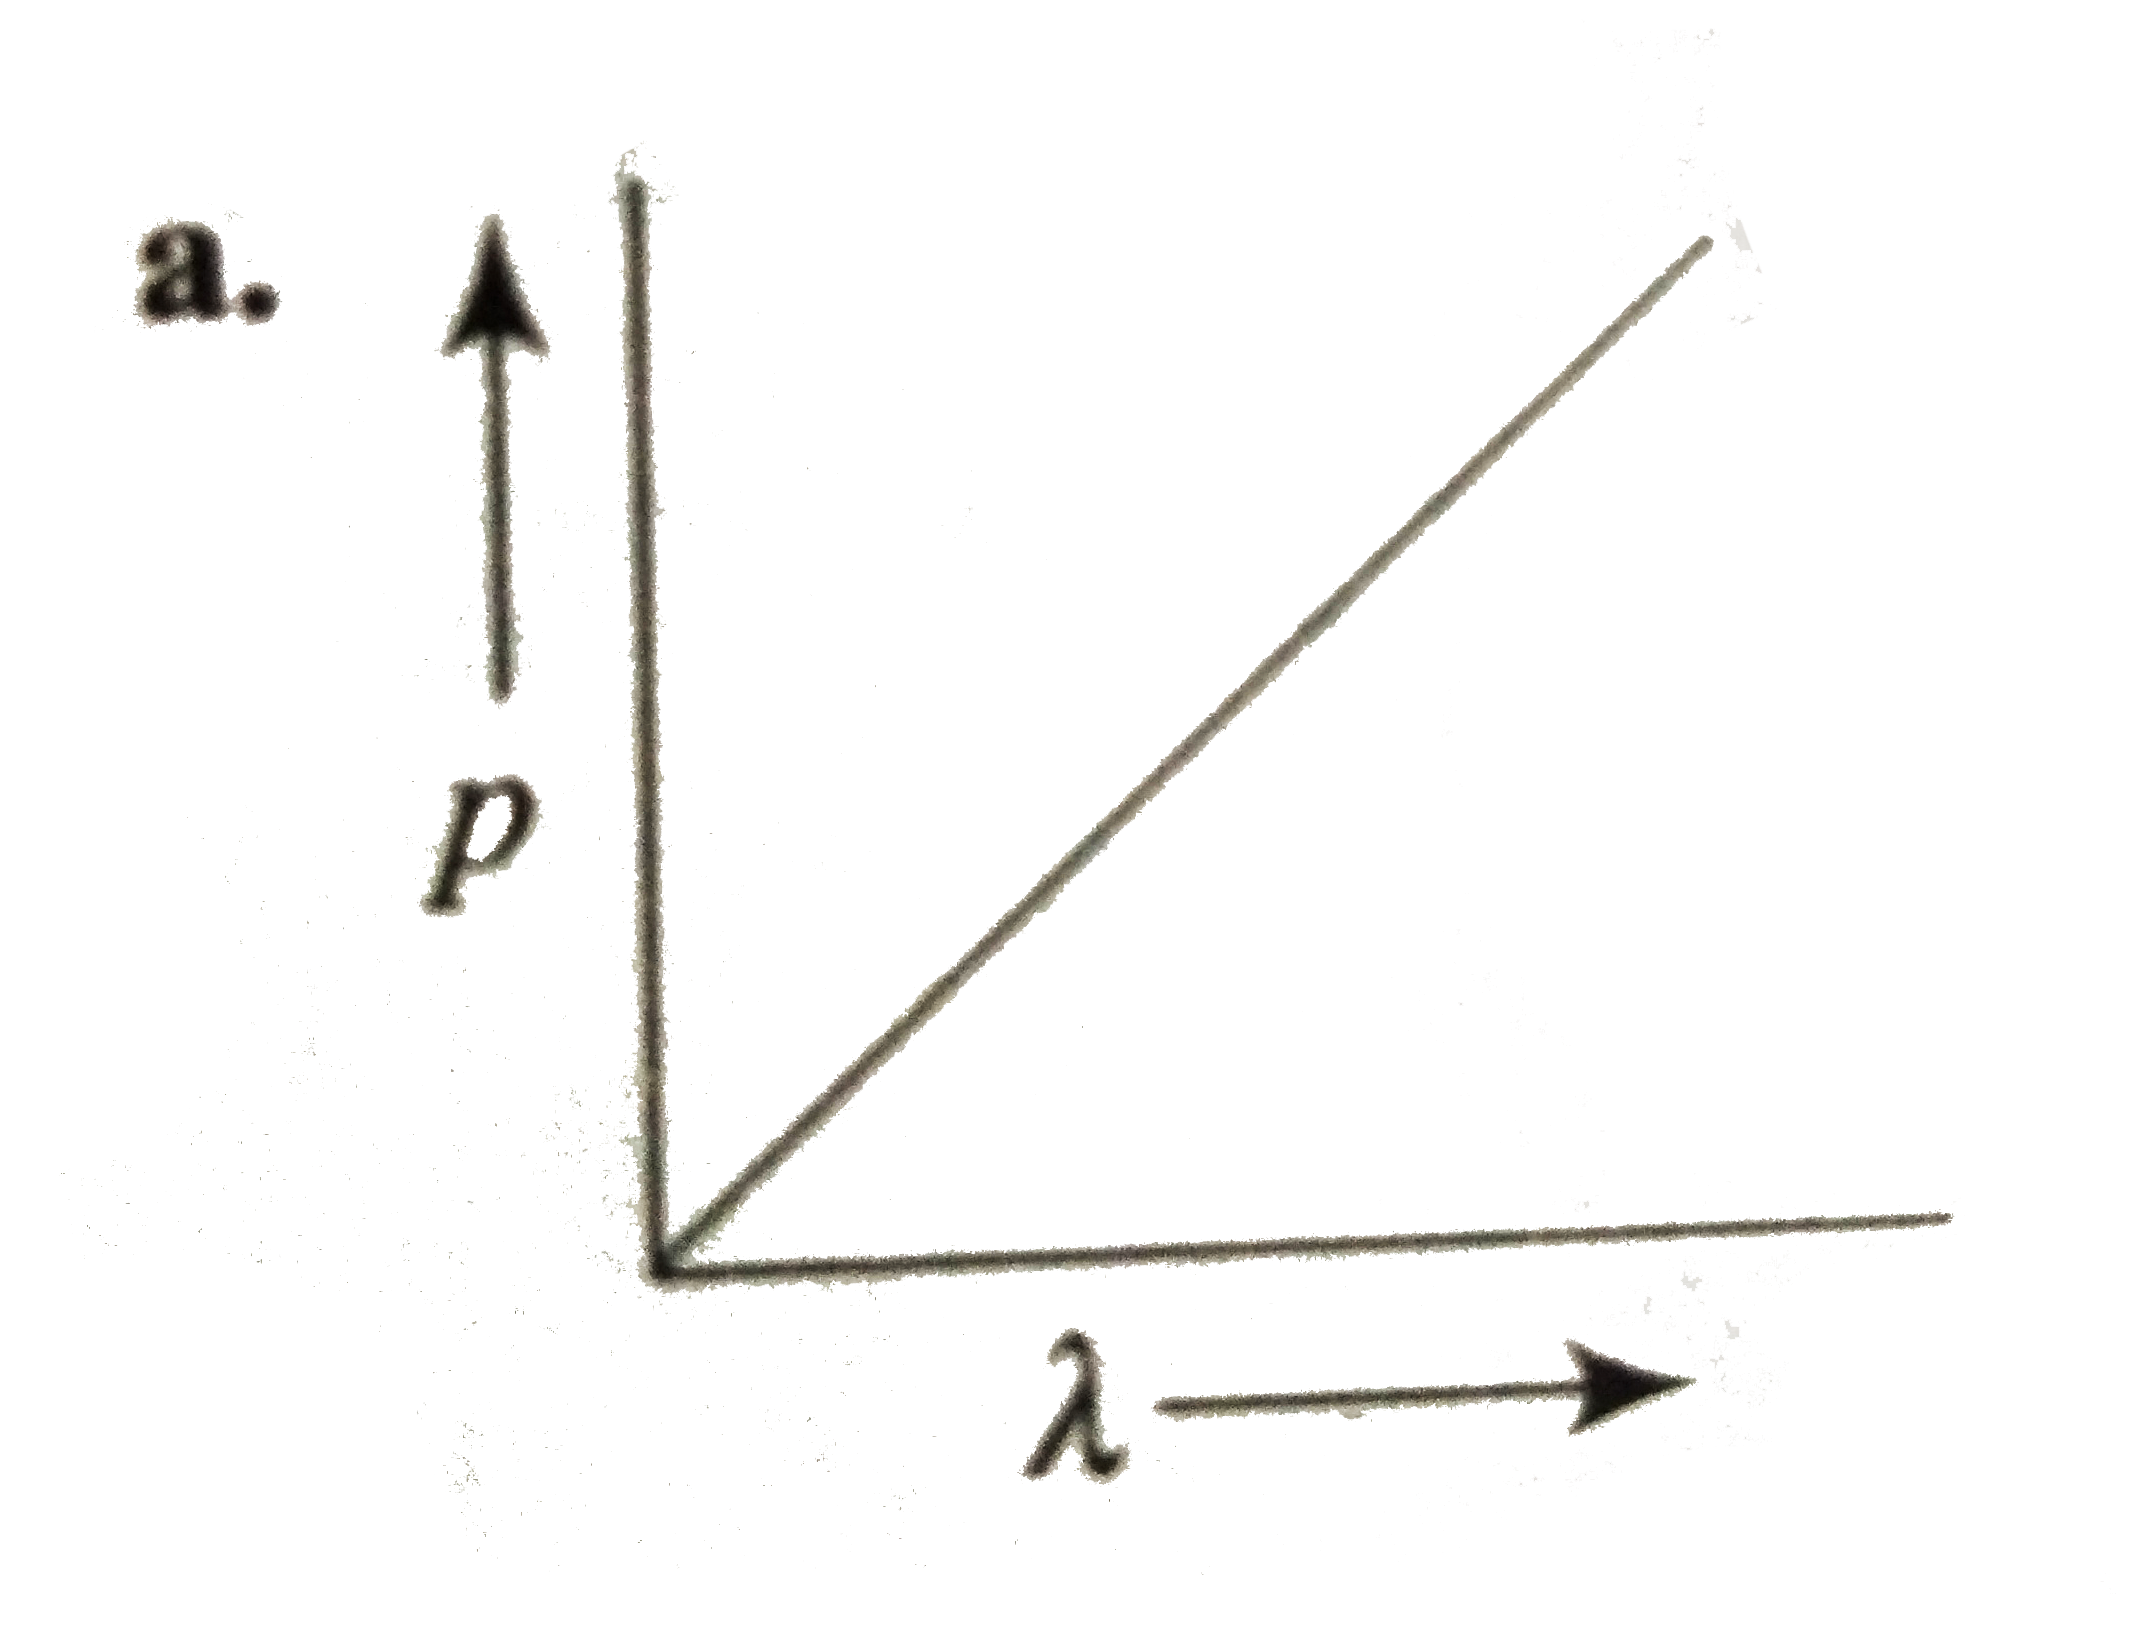 B
B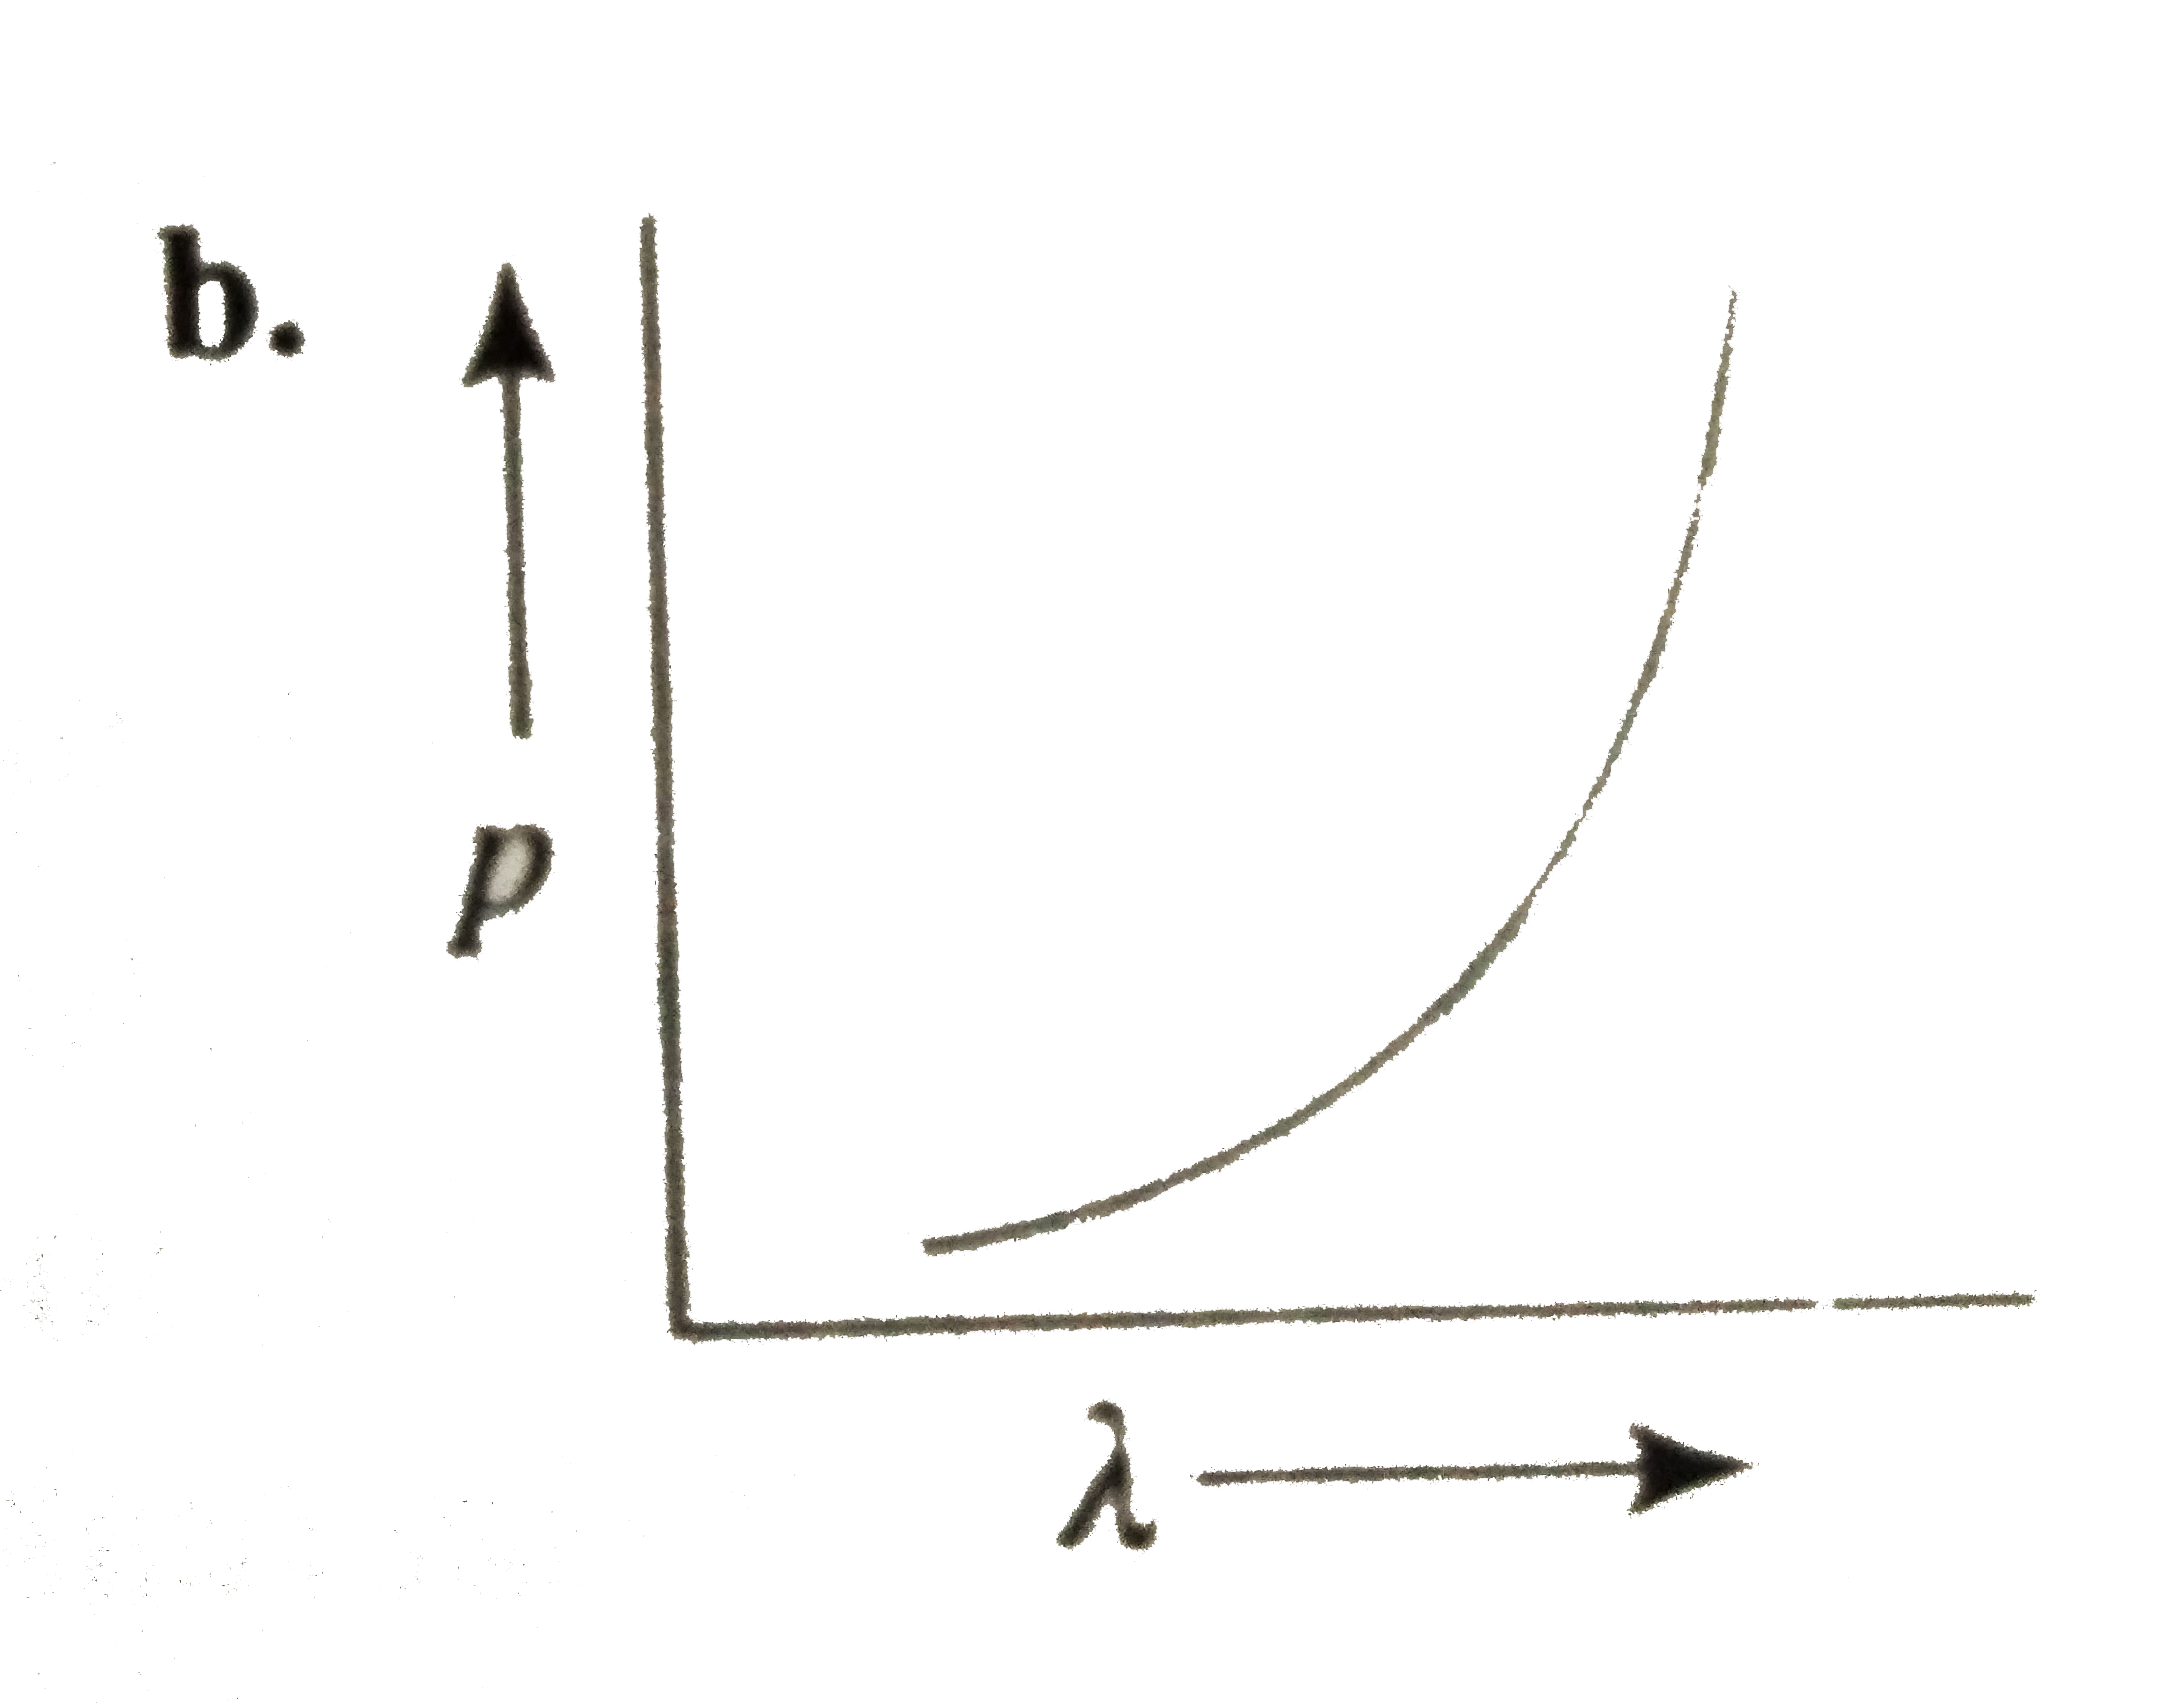 C
C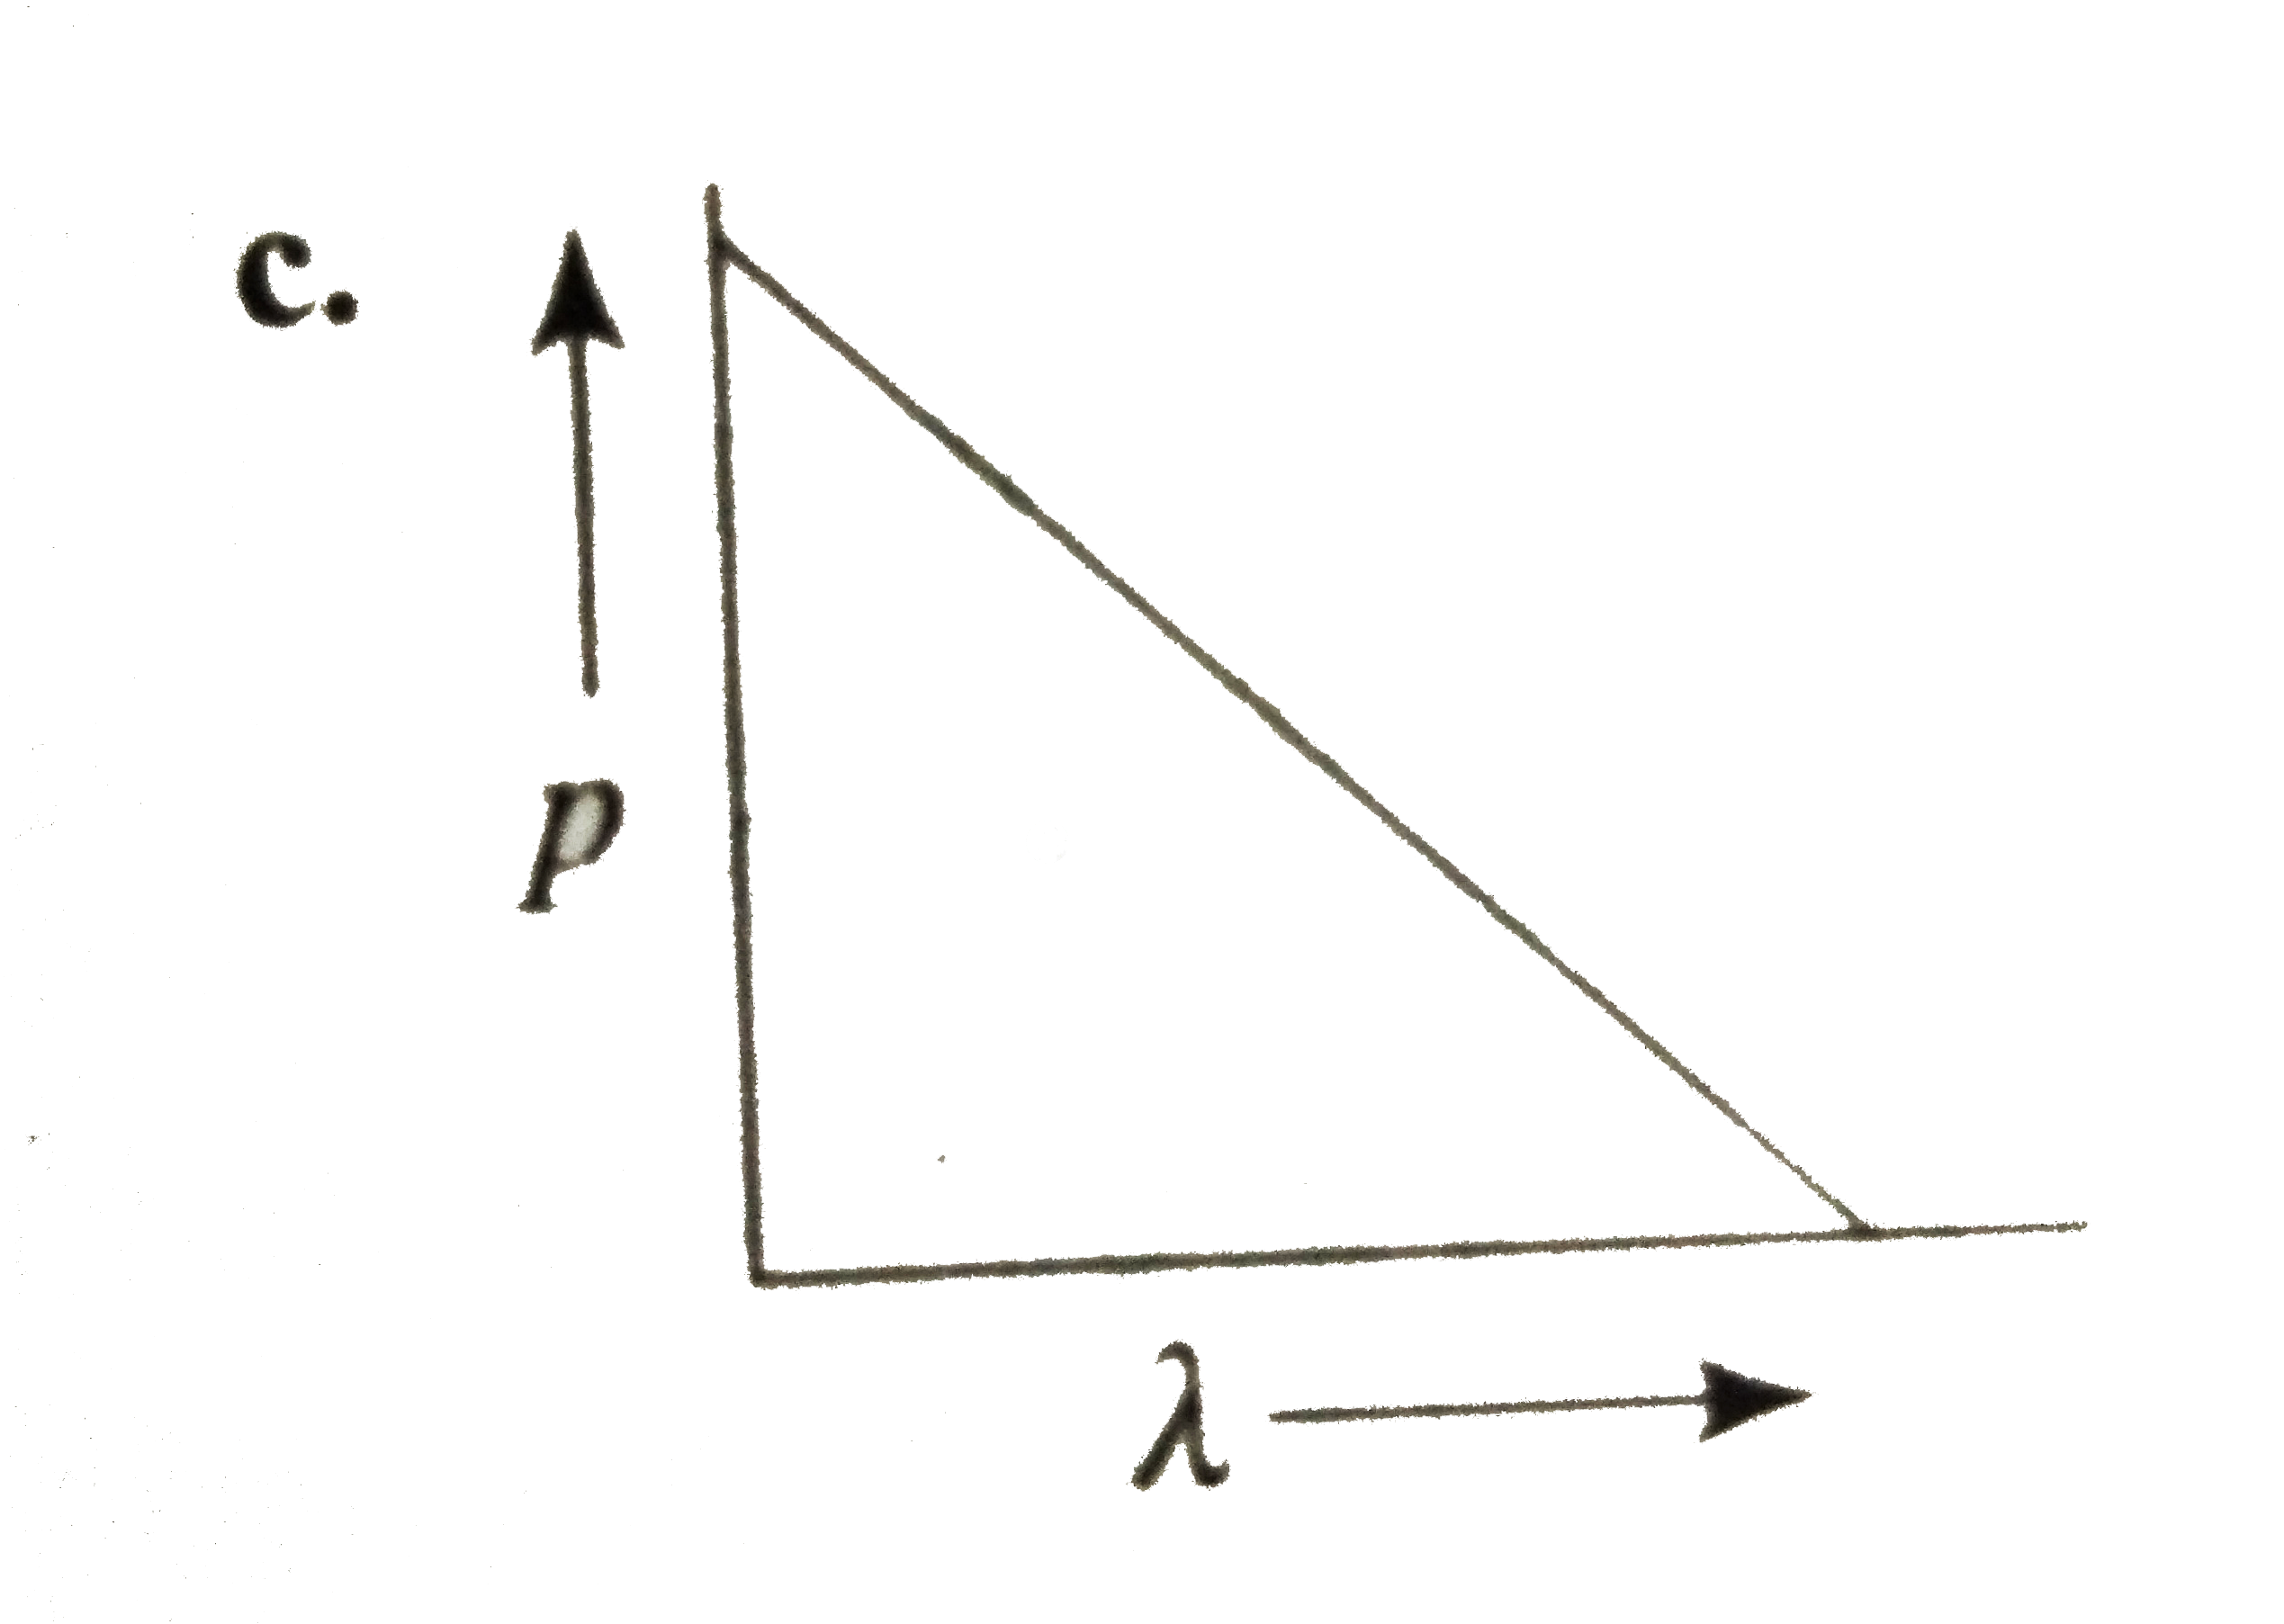 D
D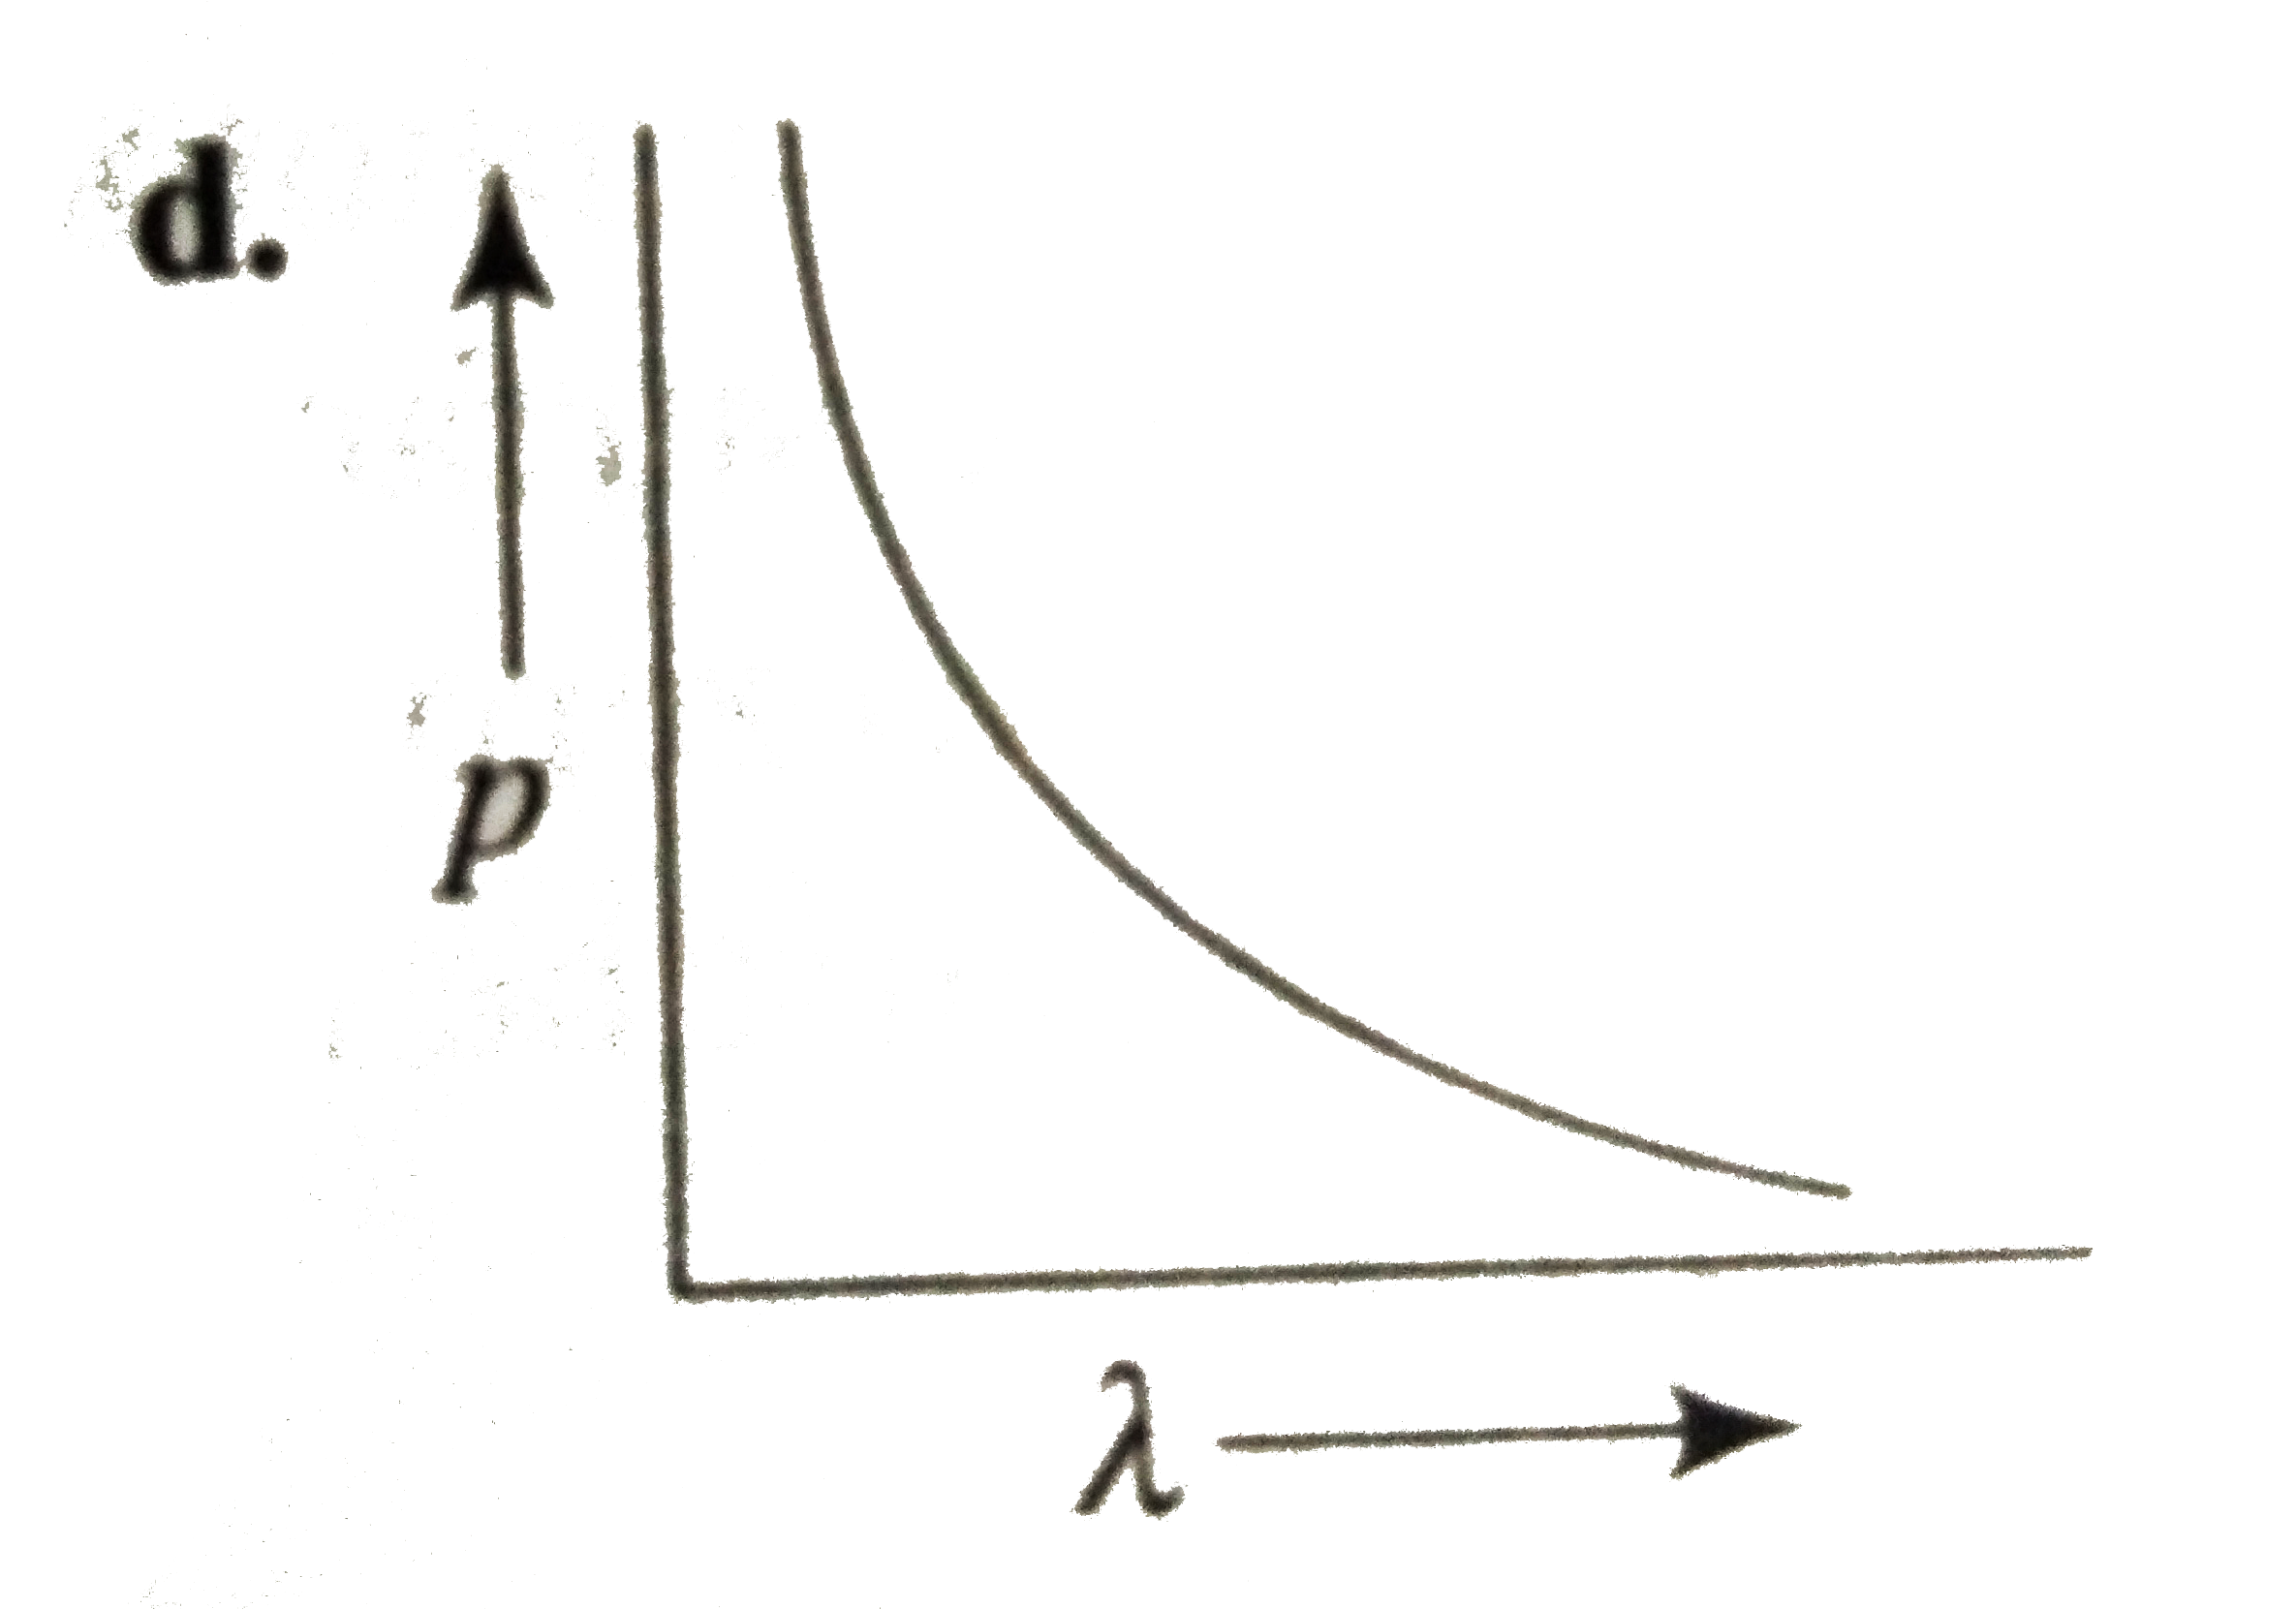
Which of the following graph is correctly represented?
A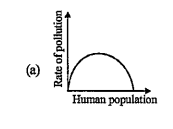 B
B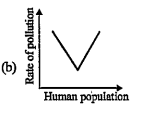 C
C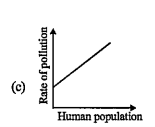 D
D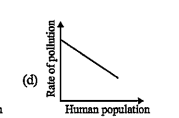
Which of the following graph represent the variation of particle momentum and associated de Broglie wavelength?
A B
B C
C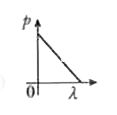 D
D
Which of the following figure represents the variation of particle momentum and the associated de - Broglie wavelength ?
View SolutionWhich of the following graph correctly represents the variation of molar conductance (Δm) with dilution for a strong electrolyte ?
View SolutionWithin elastic limit, which of the following graphs correctly represents the variation of extension in the length of wire with the external load?
View SolutionWhich of the following graphs correctly represents the variation of β=−(dV/dP)/V with P for an ideal gas at constant temperature?
View SolutionWhich of the following graphs correctly represents the variation of β=−dV/dPV
with P for an ideal gas at constant temperature?
View Solution
