For 1 mole of an ideal gas, a graph of pressure vs volume is plotted as shown. Which of the following option is correct ?
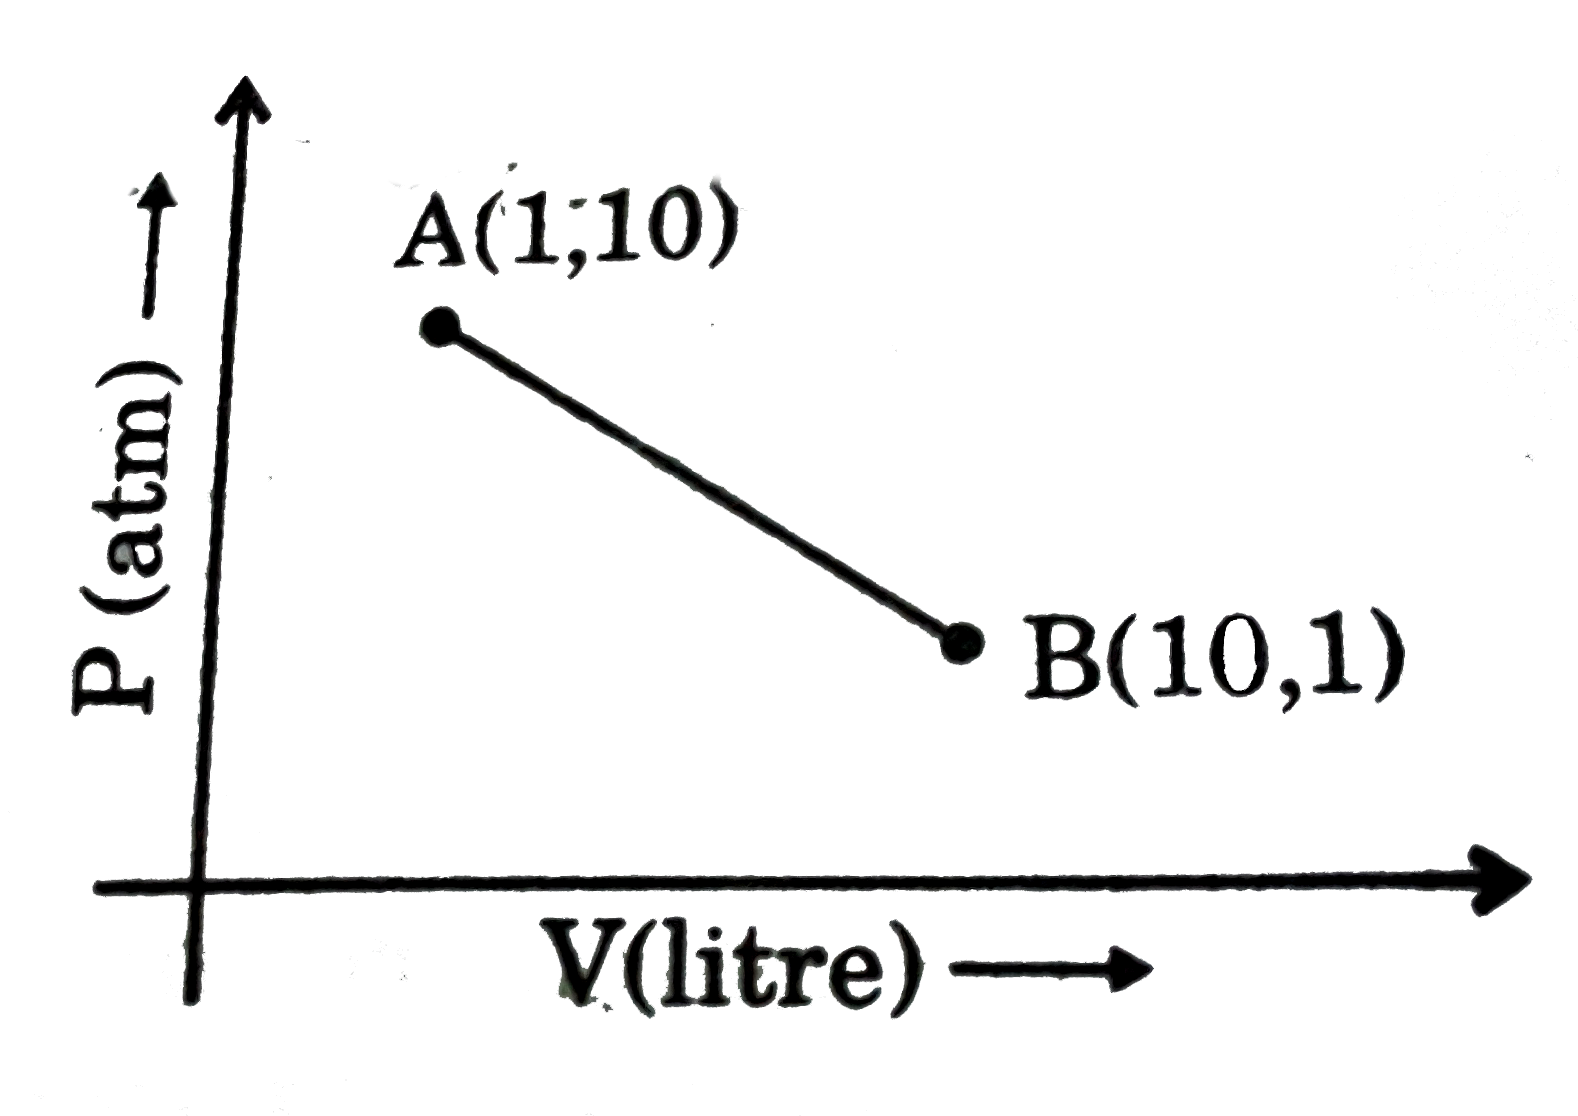
AB process is isothermal.
Maximum temperature of the gas can be 100.0821K.
Minimum temperature of the gas can be 114×0.0821K.
None of the above
The correct Answer is:D
Topper's Solved these Questions
- GRAPHICAL INTERPRETATIONBOOK - GRB PUBLICATIONCHAPTER - GRAPHICAL INTERPRETATIONEXERCISE - B. Gaseous State
1 Video
- GRAPHICAL INTERPRETATIONBOOK - GRB PUBLICATIONCHAPTER - GRAPHICAL INTERPRETATIONEXERCISE - Gaseous State
39 Videos
- GRAPHICAL INTERPRETATIONBOOK - GRB PUBLICATIONCHAPTER - GRAPHICAL INTERPRETATIONEXERCISE - Subjective Type
23 Videos
- F-BLOCK ELEMENTSBOOK - GRB PUBLICATIONCHAPTER - F-BLOCK ELEMENTSEXERCISE - Subjective type
7 Videos
- HYDROCARBON (ALIPHATIC)BOOK - GRB PUBLICATIONCHAPTER - HYDROCARBON (ALIPHATIC)EXERCISE - Previous years jee questions
28 Videos
Similar Questions
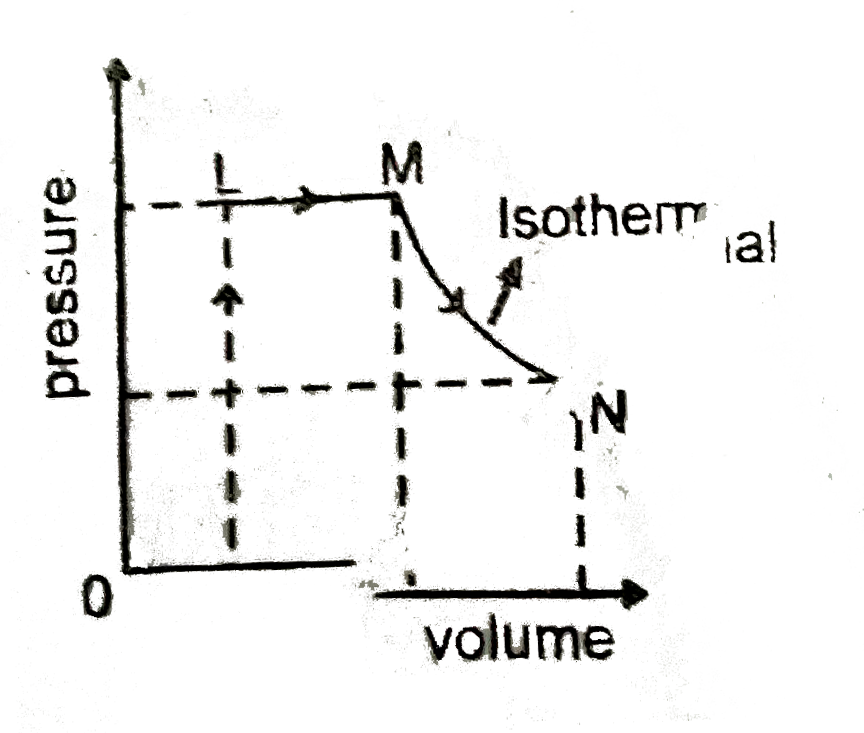
A fixed mass of an ideal gas undergoes changes of pressure and volume starting at L, as shown in Figure. Which of the the following is correct:
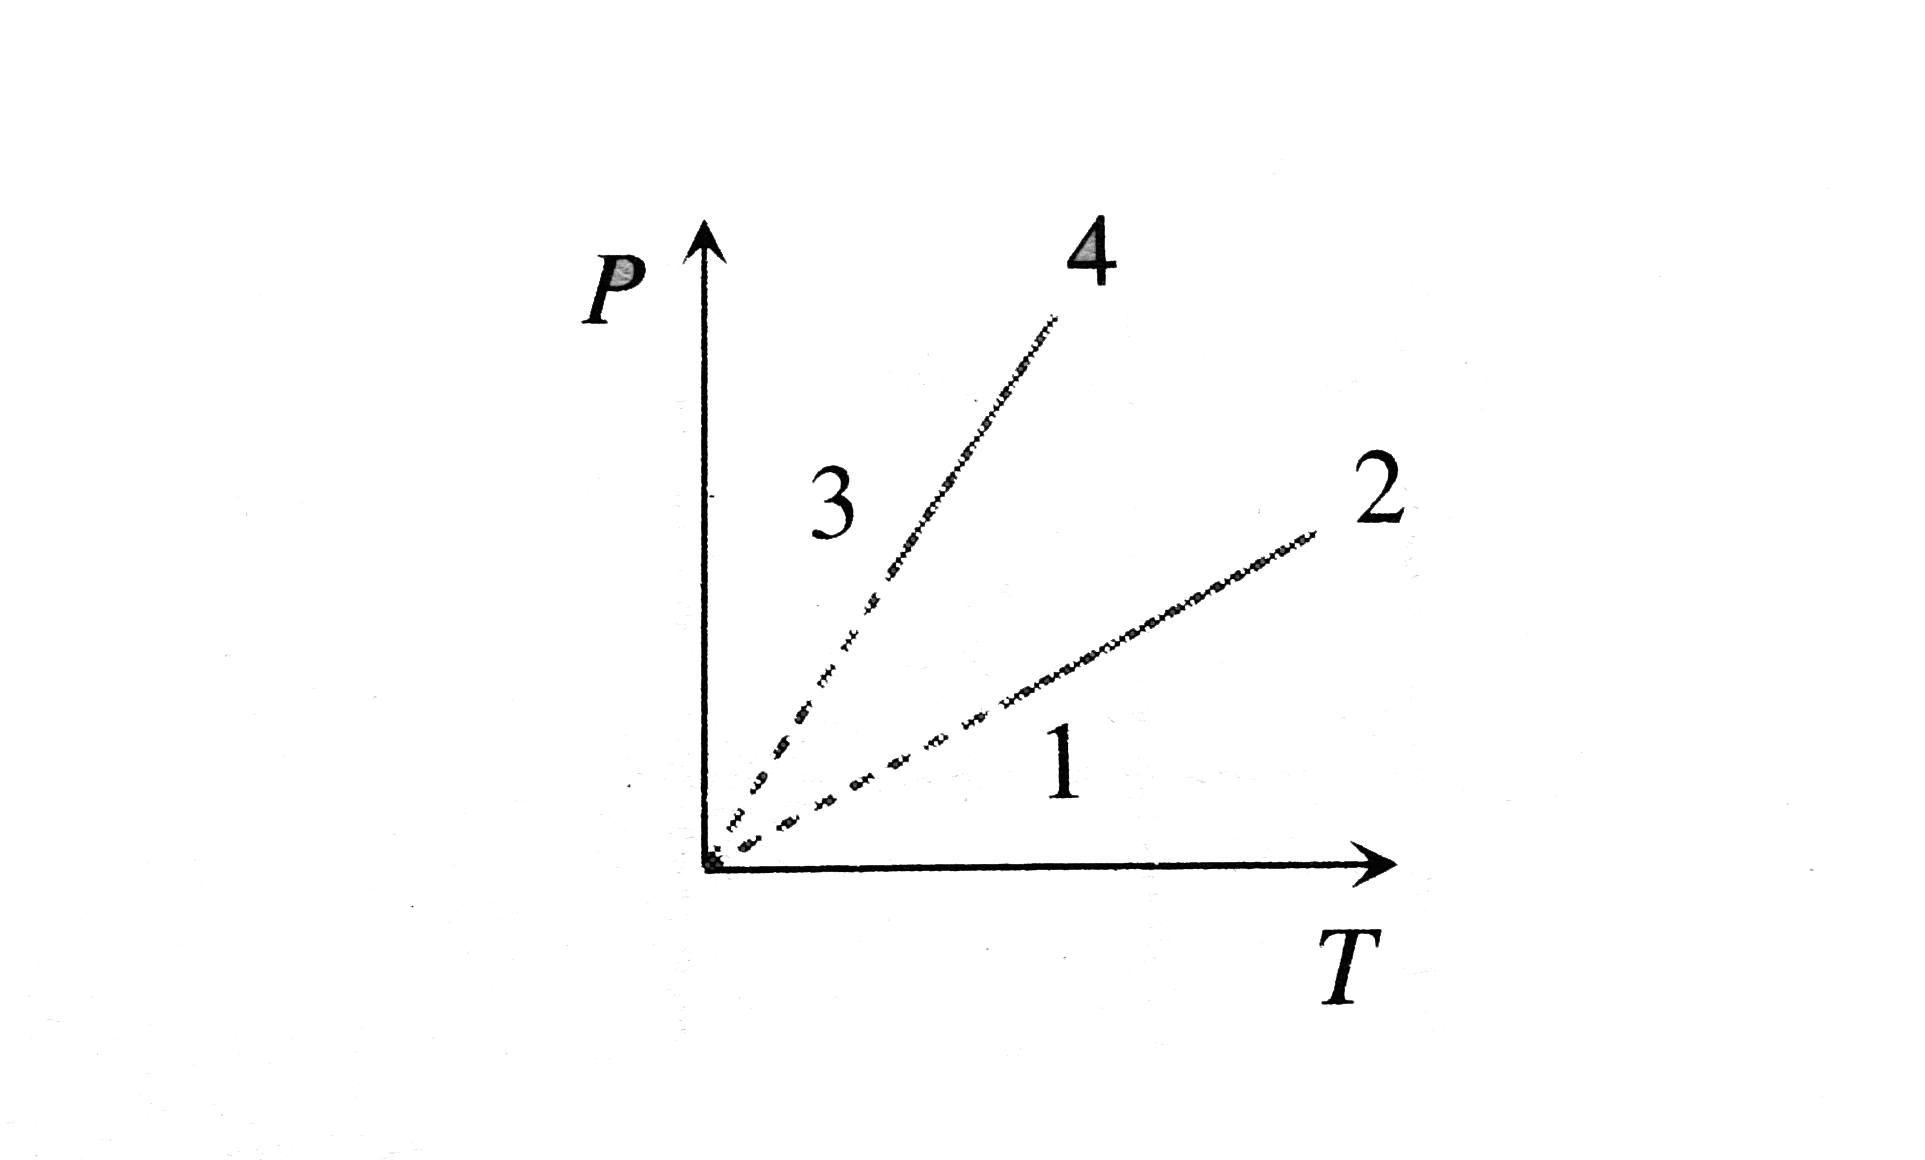
View SolutionPressure versus temperature graph of an ideal gas of equal number of moles of different volumes is plotted as shown in Fig. Choose the correct alternative.
View Solution
Knowledge Check
For 1 mole of an ideal gas, a graph of pressure vs volume is plotted as shown. Which of the following options is correct ?
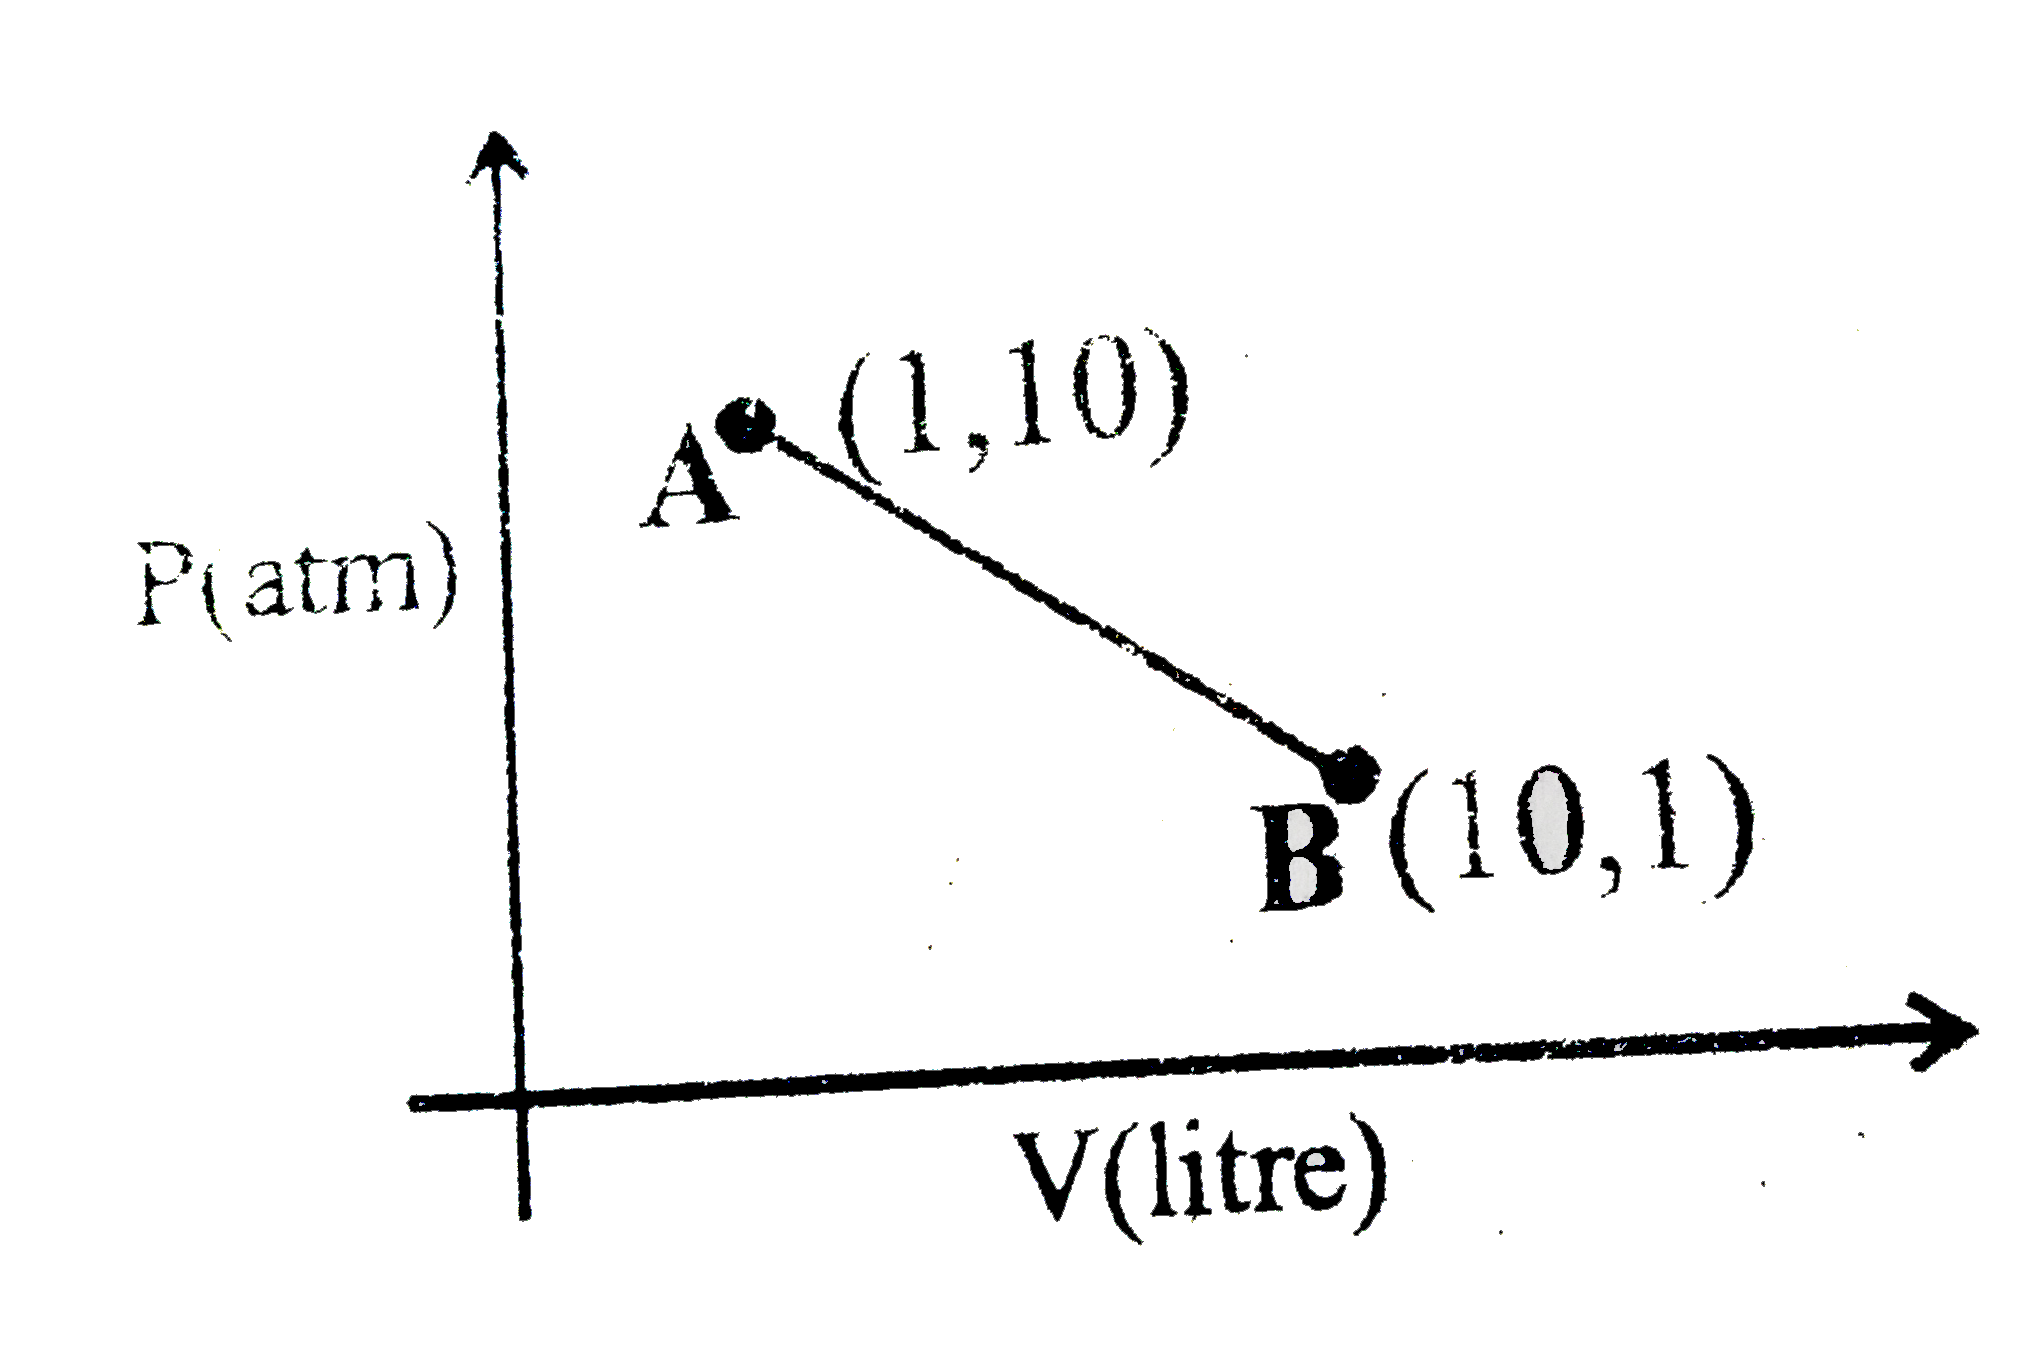 AAB process is isothermalBMaximum temperature of the gas can be 100.0821KCMinimum temperature of the gas can be 114×0.0821KDNone of these
A fixed mass of an ideal gas undergoes changes of pressure and volume starting at L, as shown in Figure. Which of the the following is correct:
 A
A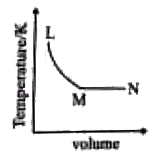 B
B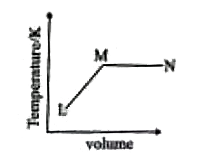 C
C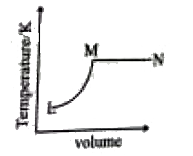 D
D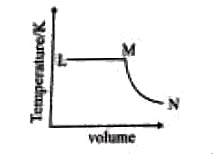
A fixed mass of an ideal gas undergoes changes of pressure and volume starting at L, as shown in Figure. Which of the the following is correct:
 A
A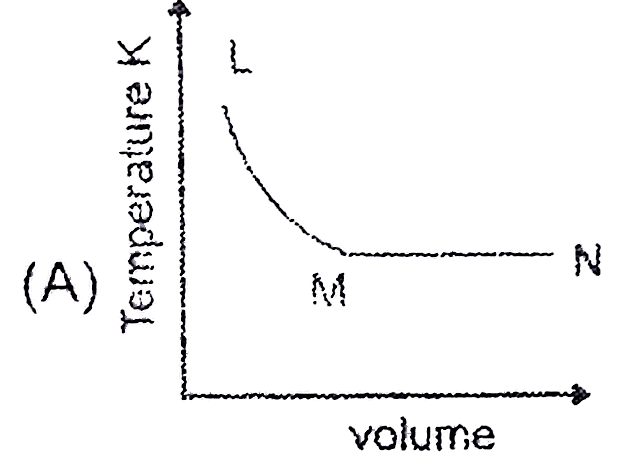 B
B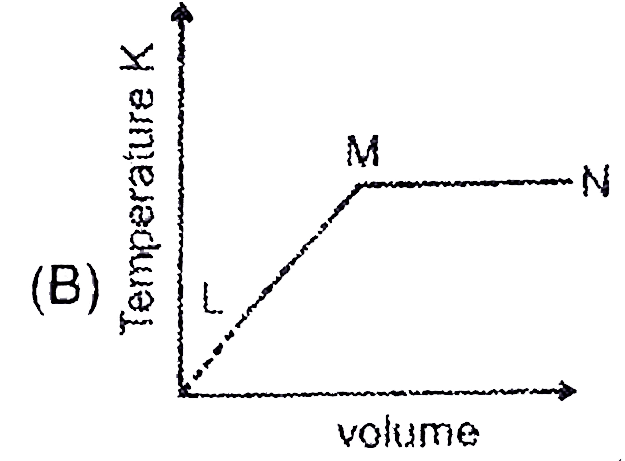 C
C D
D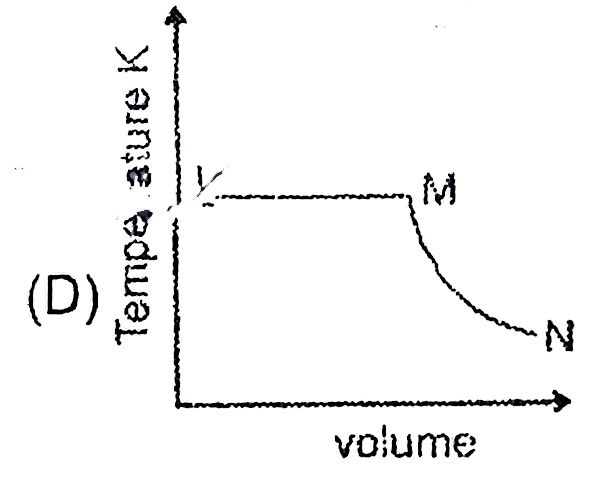
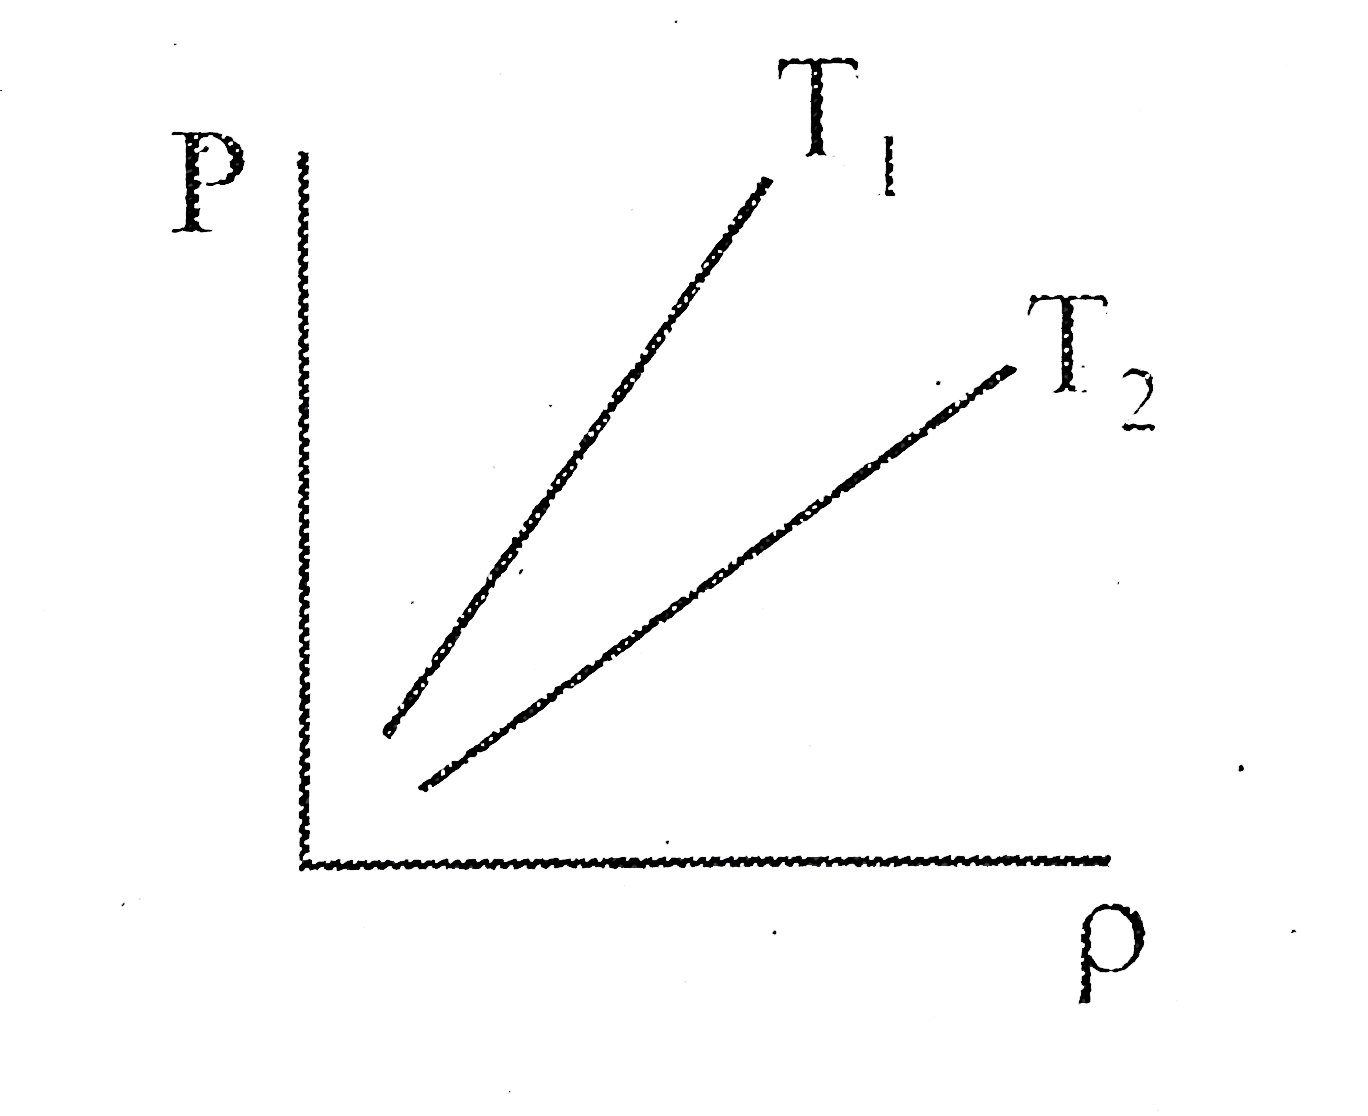
Figure shows graphs of pressure vs density for an ideal gas at two temperature T1 and T2 . Which of the following is correct ?
View SolutionWhich of the following plots are correct for an ideal gas ?
View SolutionPressure versus temperature graph of an ideal gas of equal number of moles of different volumes is plotted as shown in figure. Choose the correct alternatives.
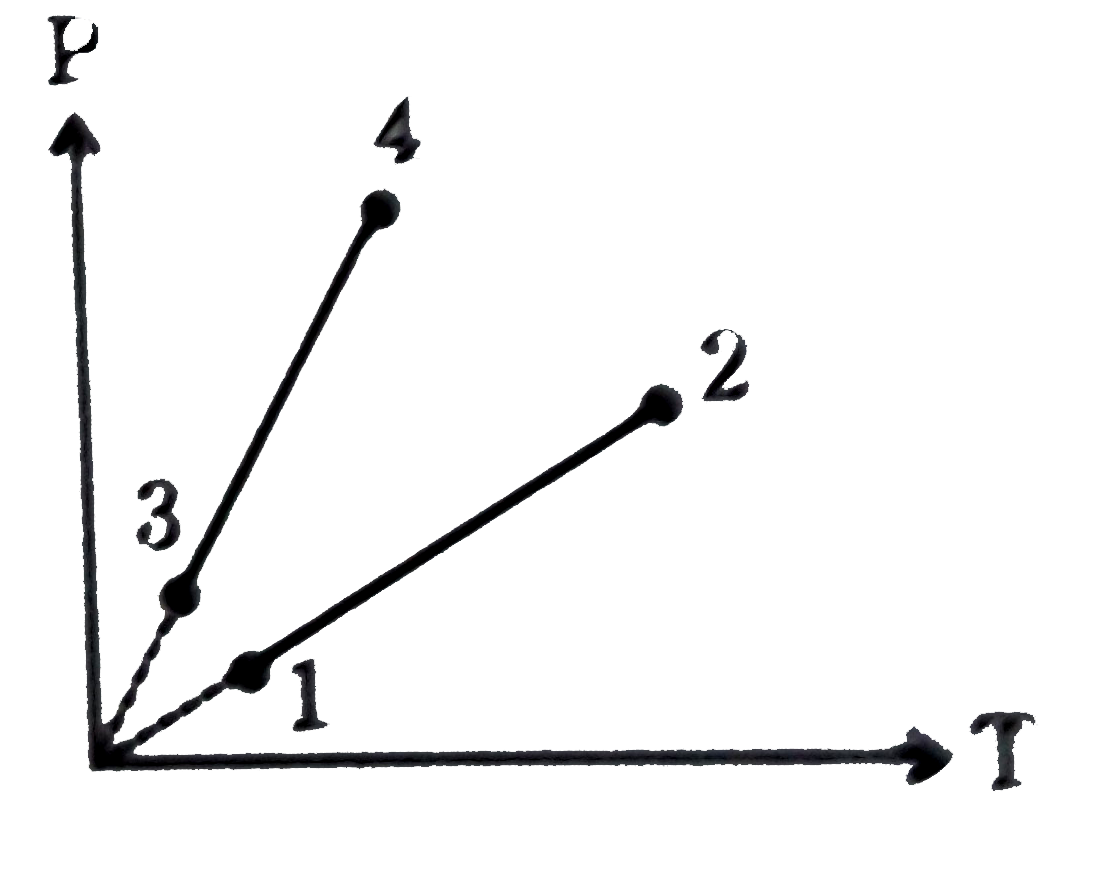
View SolutionPressure versus temperature graph of an ideal gas of equal number of moles of different volumes is plotted as shown in Fig. Choose the correct alternative.

View SolutionPressure versus temperature graph of an ideal gas of equal number of moles of different volumes is plotted as shown in Fig. Choose the correct alternative.

View Solution
