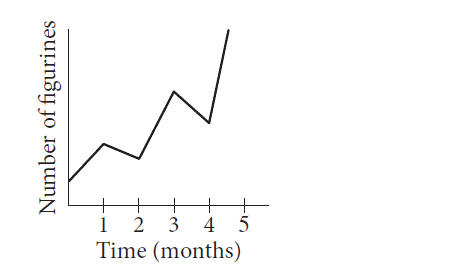
Tracy collects, sells, and trades figurines, and she tracks the number of figurines in her collection on the graph below.

On what interval did the number of figurines decrease the fastest?
A
Between 1 and 2 months
B
Between 2 and 3 months
C
Between 3 and 4 months
D
Between 4 and 5 months
Video Solution
Text Solution
The correct Answer is:C
According to the graph, the number of figurines decreased between 1 and 2 months and between 3 and 4 months. Because the line segment between 3 and 4 months is steeper than the line segment between 1 and 2 months, it follows that the number of figurines decreased the fastest between 3 and 4 months.
Choice A is incorrect. Between 1 and 2 months, the number of figurines decreased. However, the number of figurines decreased faster during the interval between 3 and 4 months. Choices B and D are incorrect. The number of figurines during these intervals was increasing, not decreasing.
|
Updated on:21/07/2023
Similar Questions
Find the perimeter of the figure given below.
 02:31View Solution
Find the area of the figure given below.
 02:21View Solution
The area of the shaded part in the figure given below is ______.
 02:03View Solution
The inequation represented by the graph given below is :
02:10View SolutionThe inequation that best describes the graph given below is _________
02:17View SolutionThe inequation that best describes the following graph is _________
02:10View SolutionWhich inequations represent the shaded region in the given figure
04:23View SolutionWhat is the distance OA for the square shown in figure :- ltimg src="https://d10lpgp6xz60nq.cloudfront.net/physics_images/ALN_PHY_R05_E01_015_Q01.png" width="80%"gt
01:19View Solution

