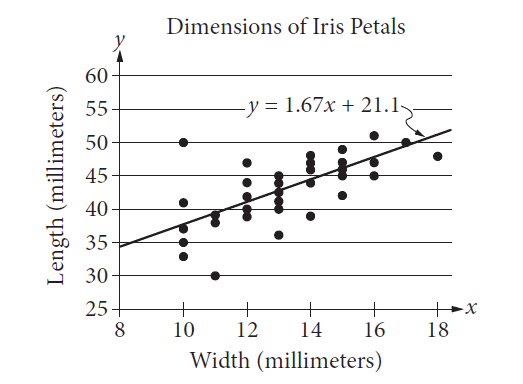
The scatterplot above shows data collected on the lengths and widths of Iris setosa petals. A line of best fit for the data is also shown. Based on the line of best fit, if the width of an Iris setosa petal is 19 millimeters, what is the predicted length, in millimeters, of the petal?
21.10
31.73
52.83
55.27
The correct Answer is:C
The given line of best fit can be used to predict the length when the width is known. The equation of the line of best fit is given as y = 1.67x + 21.1, where x is the width in millimeters and y is the predicted length in millimeters. If the width of the petal is 19 millimeters, then x = 19 and y = 1.67(19) + 21.1 = 52.83
Choice A is incorrect and may result from incorrectly using x = 0 in the equation. Choice B is incorrect and may result from neglecting to add 21.1 in the computation. Choice D is incorrect and may result from an arithmetic error.
Similar Questions
The inequation that best describes the following graph is _________
View SolutionThe equation of straight line shown in figure is :
ltimg src="https://d10lpgp6xz60nq.cloudfront.net/physics_images/ALN_PHY_R04_E01_020_Q01.png" width="80%"gt
View SolutionWhat is the distance OA for the square shown in figure :- ltimg src="https://d10lpgp6xz60nq.cloudfront.net/physics_images/ALN_PHY_R05_E01_015_Q01.png" width="80%"gt
View SolutionFor shown situation find ∠BCA :-
ltimg src="https://d10lpgp6xz60nq.cloudfront.net/physics_images/ALN_PHY_R05_E01_035_Q01.png" width="80%"gt
View SolutionFind the magnitude of the resultant of shown forces :-
ltimg src="https://d10lpgp6xz60nq.cloudfront.net/physics_images/ALN_PHY_R02_E02_009_Q01.png" width="80%"gt
View SolutionWhat is the distance OA for the square shown in figure :- ltimg src="https://d10lpgp6xz60nq.cloudfront.net/physics_images/ALN_PHY_R05_E01_015_Q01.png" width="80%"gt
View SolutionFor shown situation find angleBCA :- ltimg src="https://d10lpgp6xz60nq.cloudfront.net/physics_images/ALN_PHY_R05_E01_035_Q01.png" width="80%"gt
View Solution
