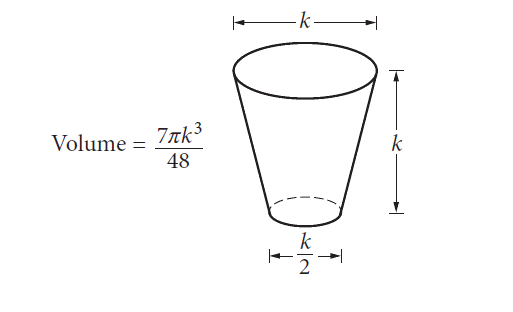
The glass pictured above can hold a maximum volume of 473 cubic centimeters, which is approximately 16 fluid ounces.
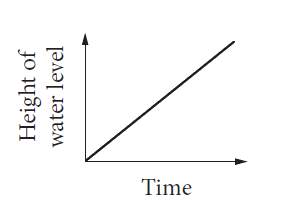
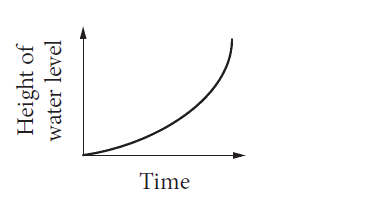
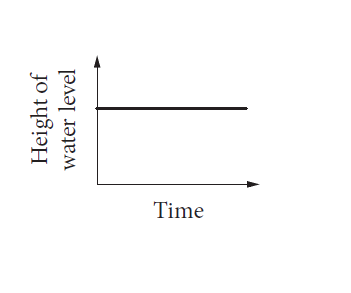
Water pours into the glass slowly and at a constant rate. Which of the following graphs best illustrates the height of the water level in the glass as it fills?
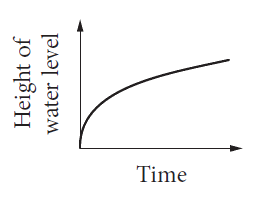
The correct Answer is:C
Due to the shape of the glass, if the water is poured at a constant rate, the height of the water level will increase faster initially, where the diameter of the glass is smaller, and increase more slowly later, as the diameter of the glass increases. Choice C is the only graph that shows this behavior: it is steeper initially and then gets less steep.
Choice A is incorrect since it shows the height of the water level increasing at a constant rate over time. Choice B is incorrect since it shows the height of the water level increasing slowly at first and faster later. Choice D is incorrect since it shows the height of the water level staying constant even as water is being poured into the glass.
Similar Questions
Calculate the volume of the given solid.
ltimg src="https://d10lpgp6xz60nq.cloudfront.net/physics_images/PS_MATH_VII_C06_E03_002_Q01.png" width="80%"gt
View SolutionThe inequation represented by the graph given below is :
View SolutionThe inequation that best describes the graph given below is _________
View SolutionThe inequation that best describes the following graph is _________
View SolutionWhich inequations represent the shaded region in the given figure
View SolutionWhich of the following statement is not correc for following straight line graph :-
ltimg src="https://d10lpgp6xz60nq.cloudfront.net/physics_images/ALN_PHY_R04_E01_015_Q01.png" width="80%"gt
View Solution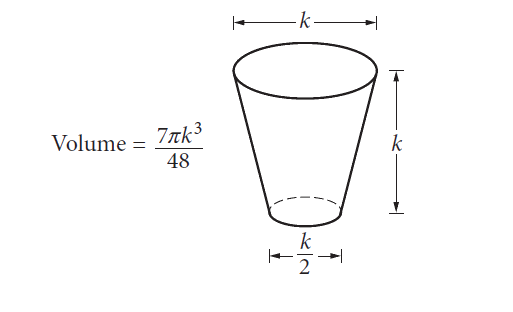
The glass pictured above can hold a maximum volume of 473 cubic centimeters, which is approximately 16 fluid ounces.
What is the value of k, in centimeters?
View Solution
