The line graphed in the xy-plane below models the total cost, in dollars, for a cab ride, y, in a certain city during nonpeak hours based on the number of miles traveled, x.
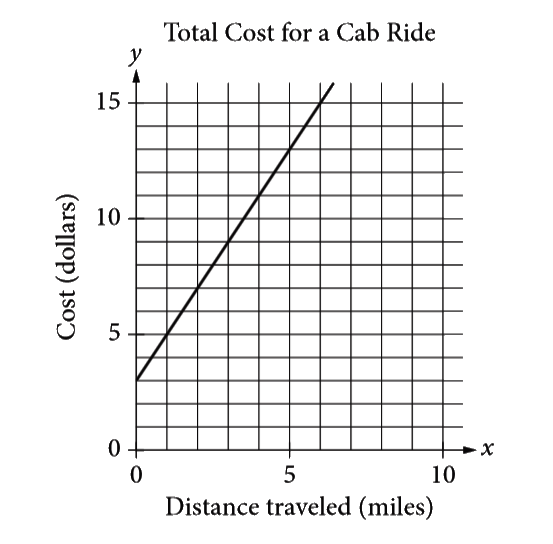
According to the graph, what is the cost for each additional mile traveled, in dollars, of a cab ride?
2
2.6
3
5
The correct Answer is:A
The cost of each additional mile traveled is represented by the slope of the given line. The slope of the line can be calculated by identifying two points on the line and then calculating the ratio of the change in y to the change in x between the two points. Using the points (1, 5) and (2, 7), the slope is equal to 7−52−1 , or 2. Ther efore, the cost for each additional mile traveled of the cab ride is $2.00.
Choice B is incorrect and may result from calculating the slope of the line that passes through the points (5, 13) and (0, 0). However, (0, 0) does not lie on the line shown. Choice C is incorrect. This is the y-coordinate of the y-intercept of the graph and represents the flat fee for a cab ride before the charge for any miles traveled is added. Choice D is incorrect. This value represents the total cost of a 1-mile cab ride.
Similar Questions
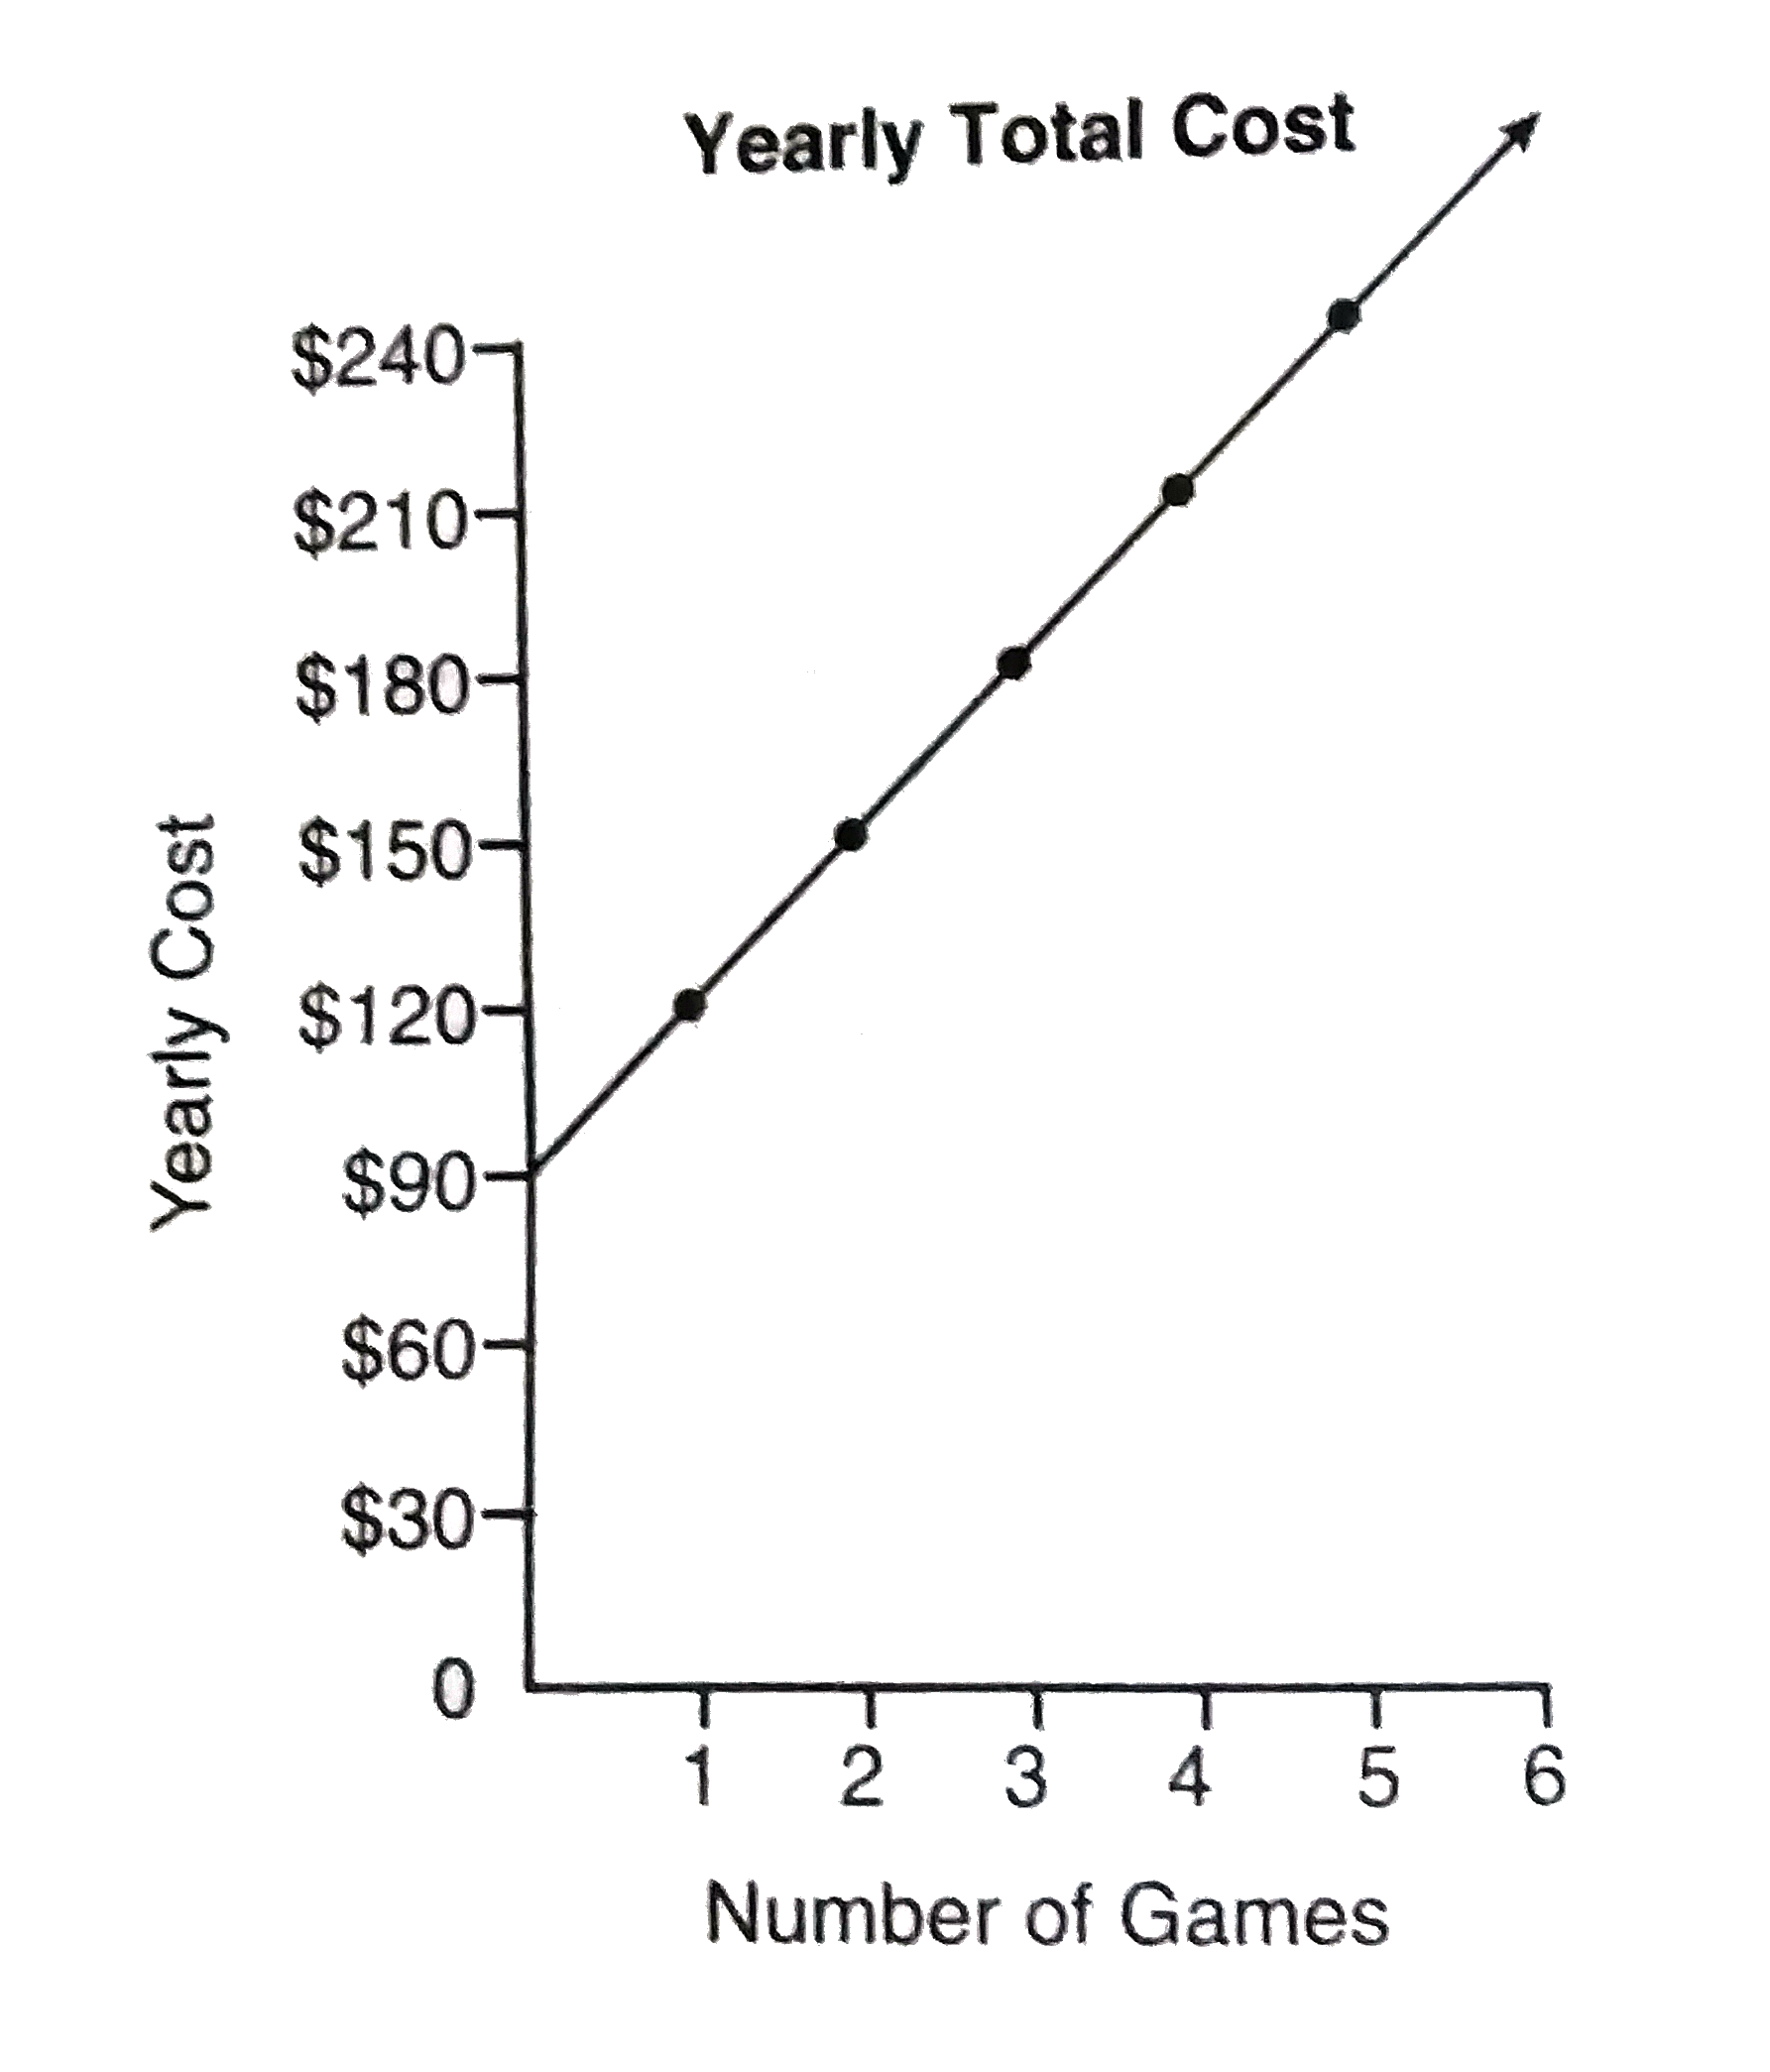
The graph on page 222 represents the yearly cost of playing 0 to 5 games of golf at the sunybrook Golf Course, which includes the yearly membership fee.
a. What is the cost of playing one game of golf?
b. Write a linear functions that expresses the total cost in dollars, C, of joining the club and playing n games during the year. What is the cost of playing 10 games of golf?View Solution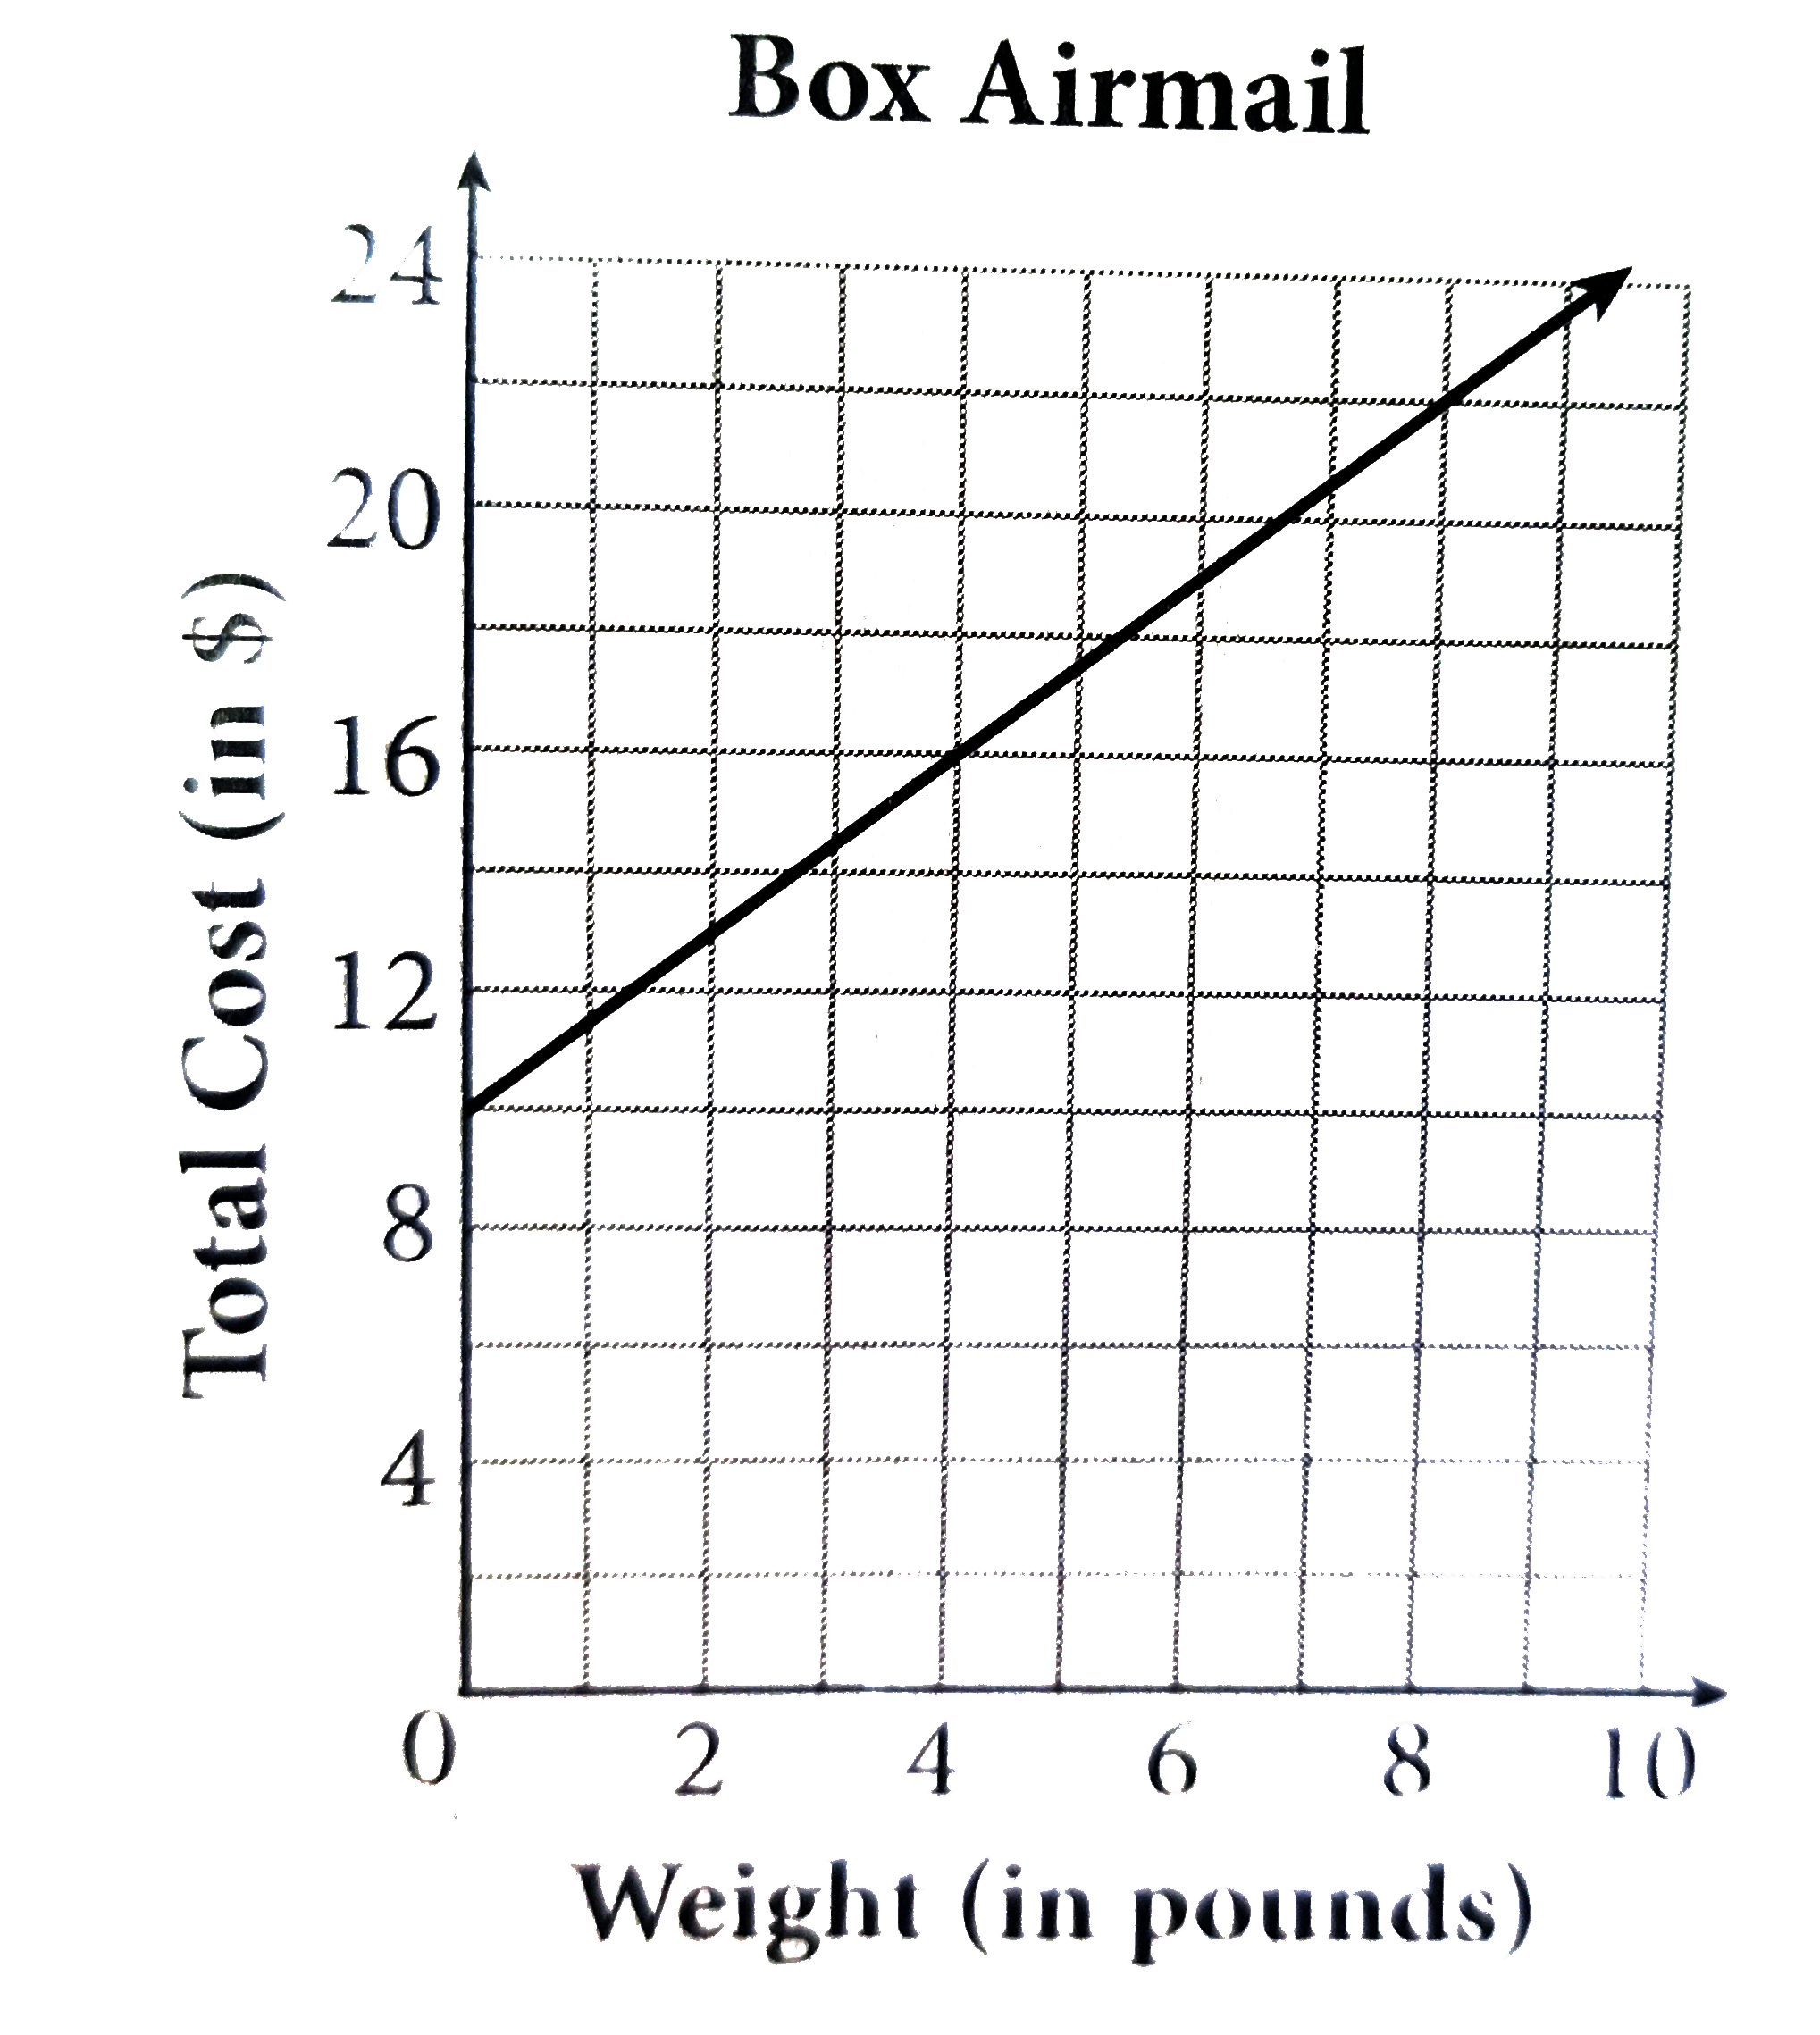
A freight airline charges a flat fee to airmil a box, plus an additional charge for each pound the box weights. The graph above shows the relationship between the weitht of the box and the total cost to airmail it. Based on the graph, how much would it cost in dollars to airmail a 40-pound boxView Solution
Knowledge Check
- Question 1 - Select One
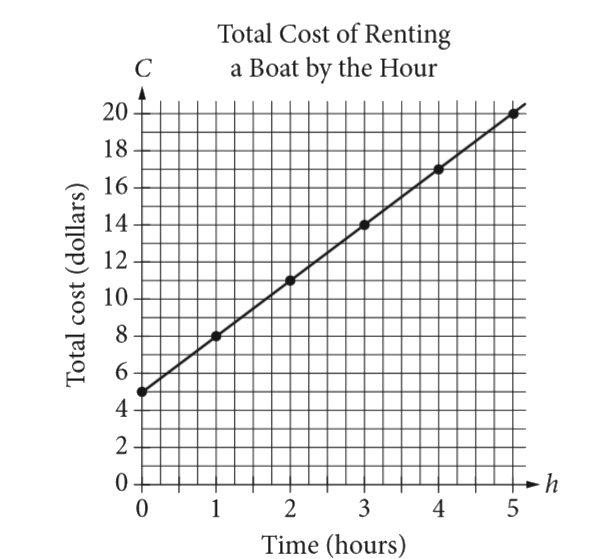
The graph above displays the total cost C, in dollars, of renting a boat for h hours.
What does the C-intercept represent in the graph?AThe initial cost of renting the boatBThe total number of boats rentedCThe total number of hours the boat is rentedDThe increase in cost to rent the boat for each additional hour - Question 2 - Select One
y = 19.99 + 1.50x
The equation above models the total cost y, in dollars, that a company charges a customer to rent a truck for one day and drive the truck x miles. The total cost consists of a flat fee plus a charge per mile driven. When the equation is graphed in the xy-plane, what does the y-intercept of the graph represent in terms of the model?AA flat fee of $19.99BA charge per mile of $1.50CA charge per mile of $19.99DTotal daily charges of $21.49 - Question 3 - Select One
Mr. Martinson is building a concrete patio in his backyard and deciding where to buy the materials and rent the tools needed for the project. The table below shows the materials’ cost and daily rental costs for three different stores.
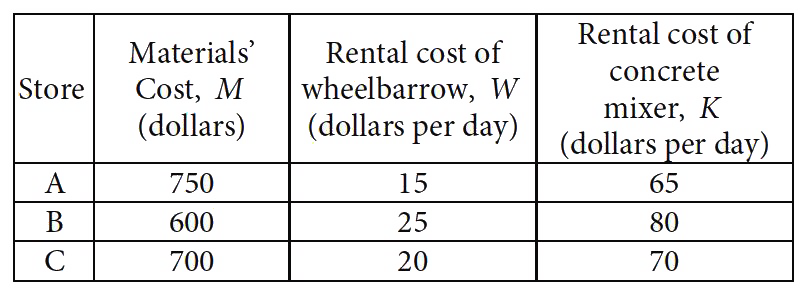
The total cost, y, for buying the materials and renting the tools in terms of the number of days, x, is given by y=M+(W+K)x .
If the relationship between the total cost, y, of buying the materials and renting the tools at Store C and the number of days, x, for which the tools are rented is graphed in the xy-plane, what does the slope of the line represent?AThe total cost of the projectBThe total cost of the materialsCThe total daily cost of the projectDThe total daily rental costs of the tools
A poor , frustrated artist named Fresco created a plan to make money. He collected trash, repurposed it into sculptures, then asked various celebrities to write and paint on these trash objects, which he then sold on his own as modern high art. The chart below separately shows the cost and revenue of his plan. The linear cost function, C(x) , represents the total money spent to make and market the art , while the linear revenue function, R(x) , shows the amount of money he has made in sculpture sales.
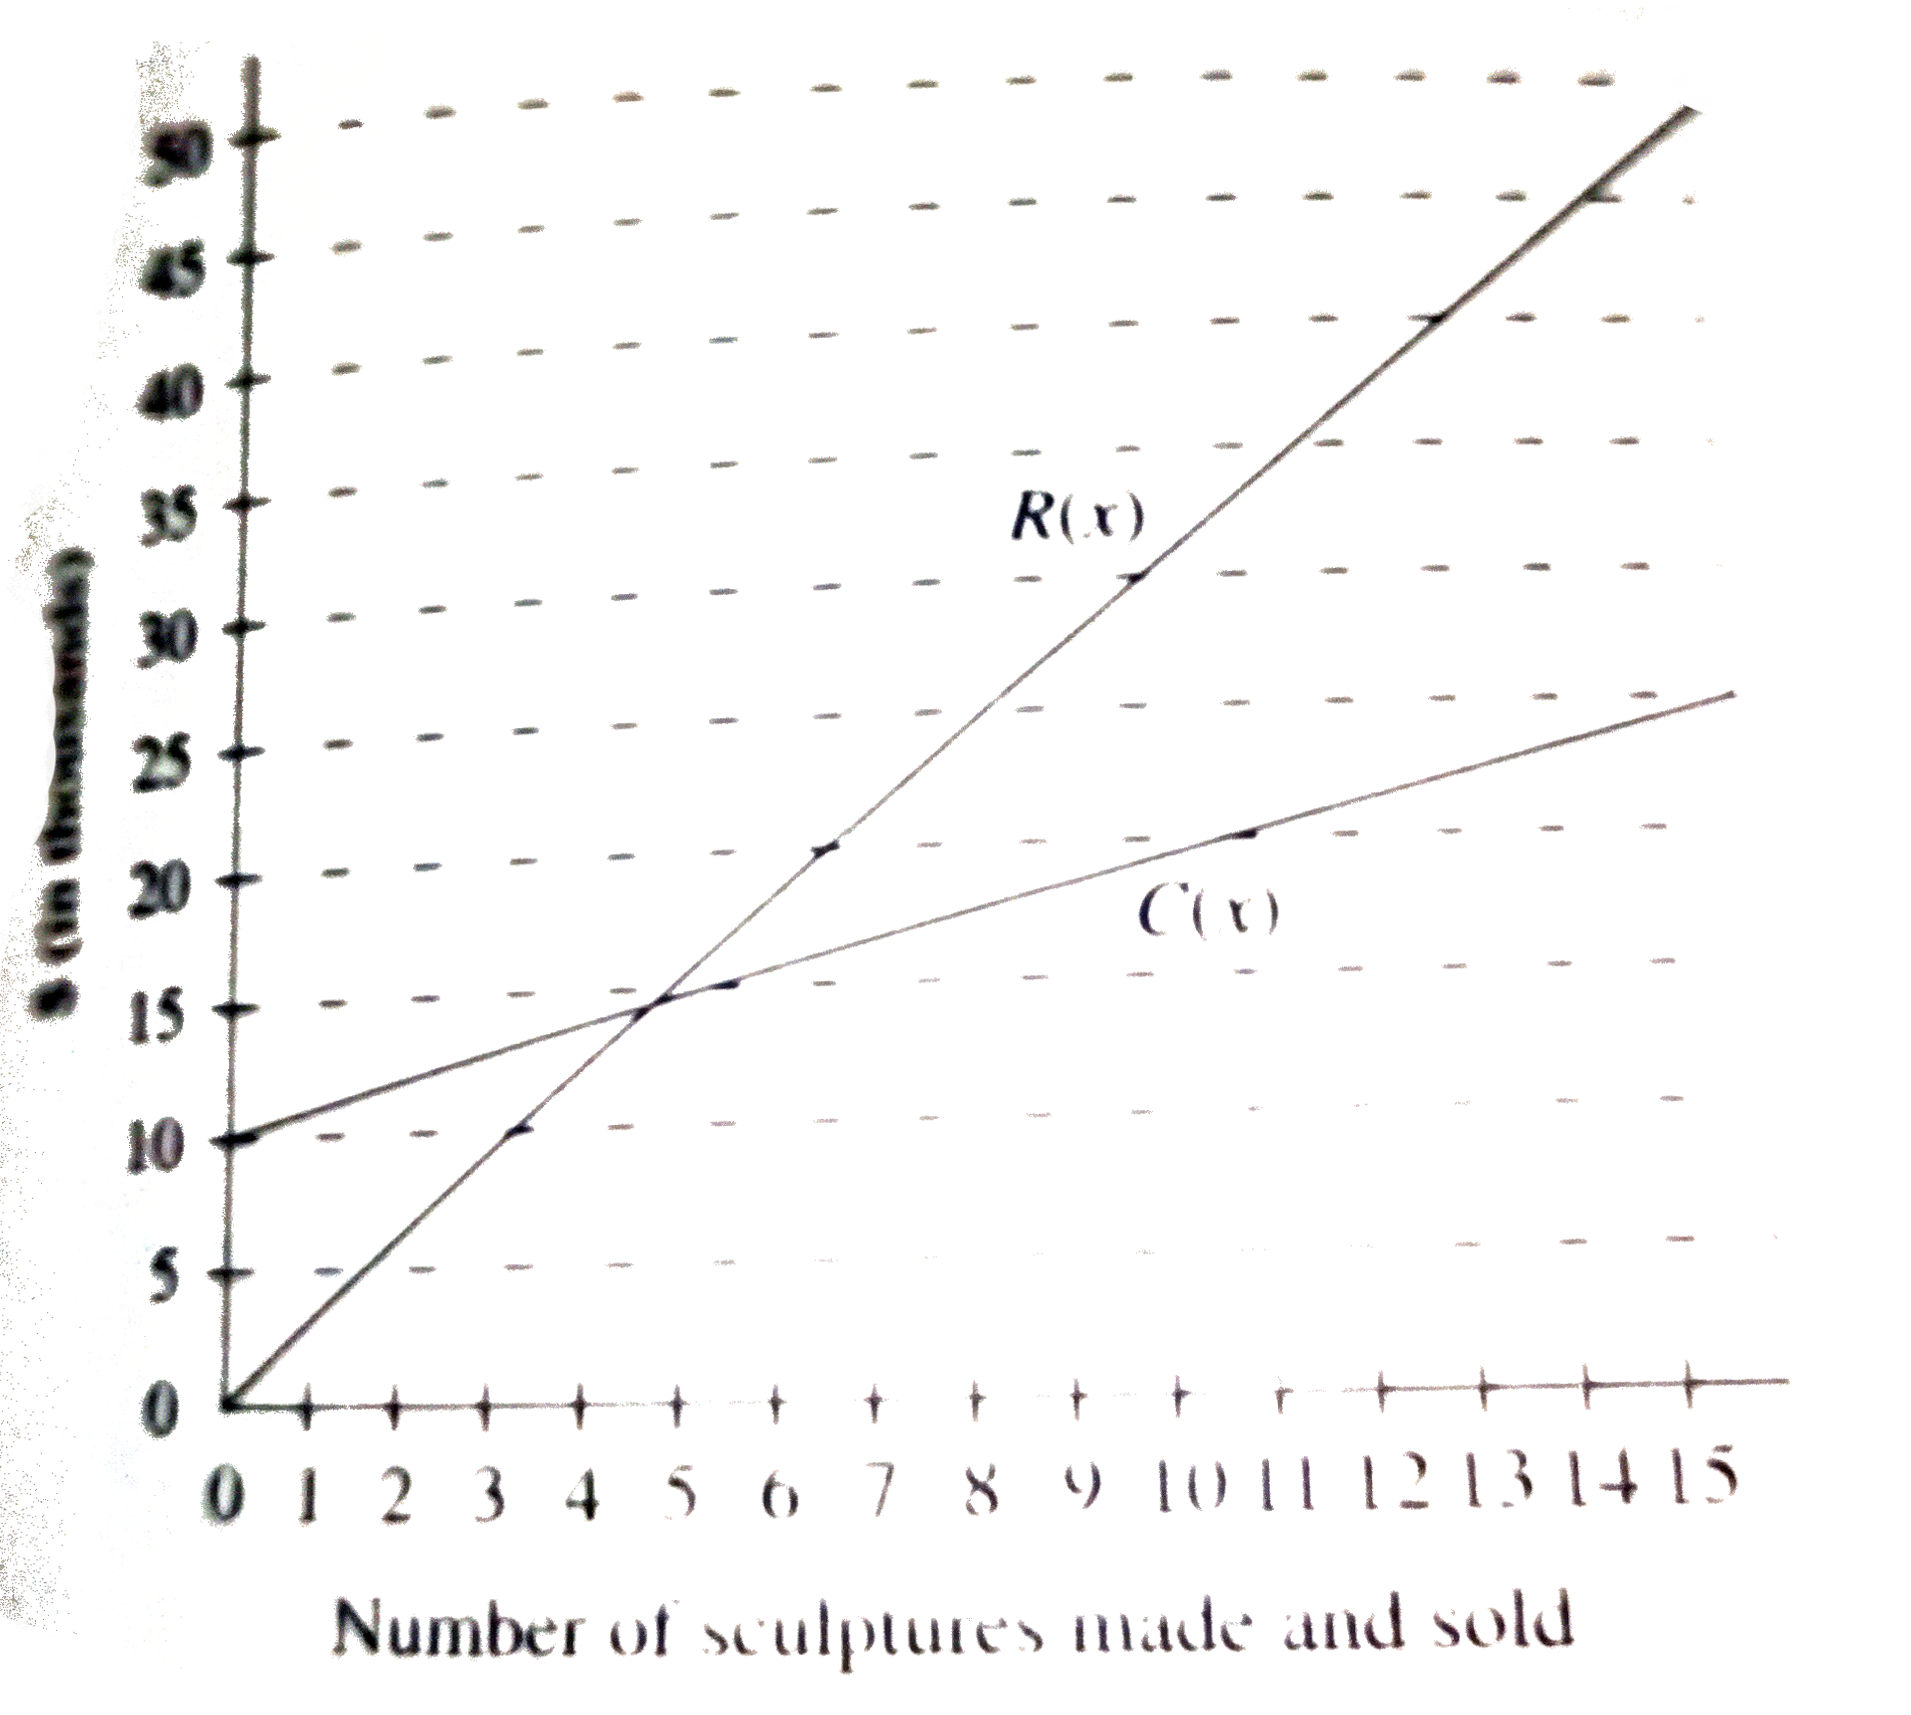
The selling price of each trash sculpture is an integer number of dollars . According to the revenue function , what is the selling price of one trash sculpture ?View SolutionAt both Quick Car Rental and Speedy Car Rental, the cost, in dollars, of renting a full - size car depends on a fixed daily rental fee and a fixed charge per mile that the car is driven. However, the daily rental fee and the charge per mile are not the same for the 2 companies. In the graph below, line Q represents the total cost for Quick Car Rental and line S represents the total cost for Speedy Car Rental.
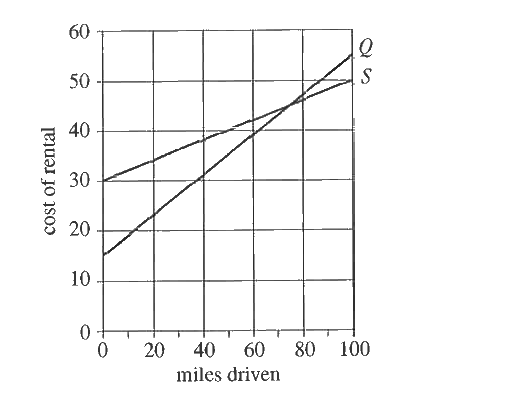
If you rent a full-size car from Quick Car Rental for 1 day, how much more would the total rental cost be if you drove the car 78 miles than if you drove it 77 miles?View SolutionAt both Quick Car Rental and Speedy Car Rental, the cost, in dollars, of renting a full - size car depends on a fixed daily rental fee and a fixed charge per mile that the car is driven. However, the daily rental fee and the charge per mile are not the same for the 2 companies. In the graph below, line Q represents the total cost for Quick Car Rental and line S represents the total cost for Speedy Car Rental.
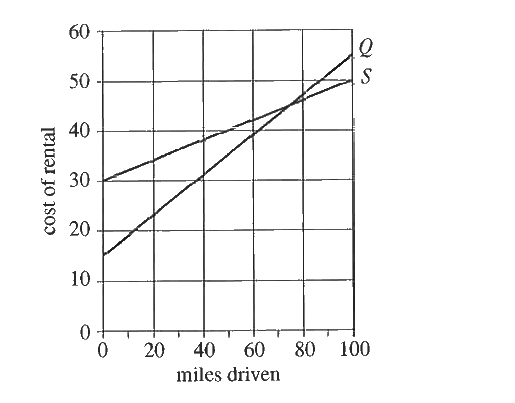
What would be the total cost of renting a full-size car from Speedy Car Rental for 1 day and driving the car 150 miles?View SolutionAt both Quick Car Rental and Speedy Car Rental, the cost, in dollars, of renting a full - size car depends on a fixed daily rental fee and a fixed charge per mile that the car is driven. However, the daily rental fee and the charge per mile are not the same for the 2 companies. In the graph below, line Q represents the total cost for Quick Car Rental and line S represents the total cost for Speedy Car Rental.
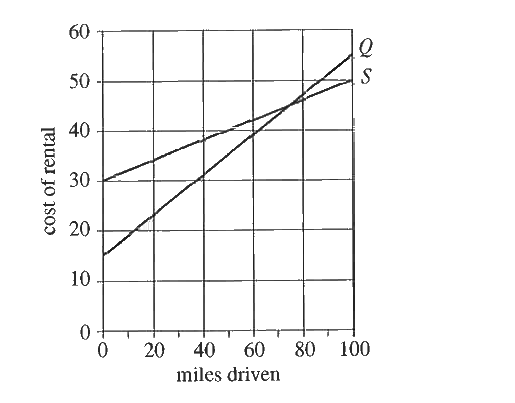
Robert plans to rent a full-size car for 1 day and drive only 50 miles. If his only consideration is to incur the least cost, which company should he choose?View Solutiony=−75x+5,000
the equation above models the amount of money y, in dollars, remaining in Bo's bank account x days after the start of the fall semester. The amount of money in Bo's bank account is based on the money he earned over the summer and how much he spends per day during the fall semester. When the equation is graphed in the xy-plane , what does the slope of the graph represent in terms of the model?View Solution

