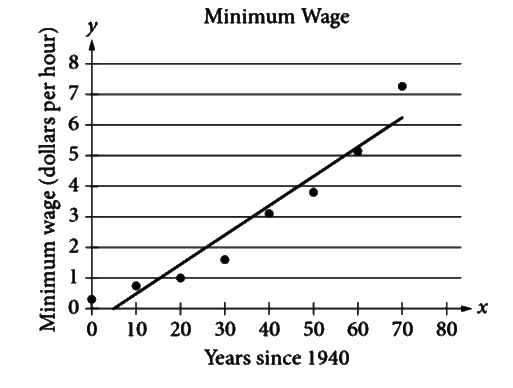
The scatterplot above shows the federal-mandated minimum wage every 10 years between 1940 and 2010. A line of best fit is shown, and its equation is y = 0.096x − 0.488.What does the line of best fit predict about the increase in the minimum wage over the 70-year period?
Each year between 1940 and 2010, the average increase in minimum wage was 0.096 dollars.
Each year between 1940 and 2010, the average increase in minimum wage was 0.49 dollars.
Every 10 years between 1940 and 2010, the average increase in minimum wage was 0.096 dollars.
Every 10 years between 1940 and 2010, the average increase in minimum wage was 0.488 dollars.
The correct Answer is:A
The given equation is in slope-intercept form, or y = mx + b, where m is the value of the slope of the line of best fit. Therefore, the slope of the line of best fit is 0.096. From the definition of slope, it follows that an increase of 1 in the x-value corresponds to an increase of 0.096 in the y-value. Therefore, the line of best fit predicts that for each year between 1940 and 2010, the minimum wage will increase by 0.096 dollar per hour.
Choice B is incorrect and may result from using the y-coordinate of the y-intercept as the average increase, instead of the slope. Choice C is incorrect and may result from using the 10-year increments given on the x-axis to incorrectly interpret the slope of the line of best fit. Choice D is incorrect and may result from using the y-coordinate of the y-intercept as the average increase, instead of the slope, and from using the 10-year increments given on the x-axis to incorrectly interpret the slope of the line of best fit.
Similar Questions
The inequation that best describes the following graph is _________
02:10View SolutionWhich of the following equation is best representation of given graph's? ltimg src="https://d10lpgp6xz60nq.cloudfront.net/physics_images/ALN_PHY_R04_E01_008_Q01.png" width="80%"gt
02:13View SolutionThe equation of straight line shown in figure is :
ltimg src="https://d10lpgp6xz60nq.cloudfront.net/physics_images/ALN_PHY_R04_E01_020_Q01.png" width="80%"gt01:59View SolutionWhat is the distance OA for the square shown in figure :- ltimg src="https://d10lpgp6xz60nq.cloudfront.net/physics_images/ALN_PHY_R05_E01_015_Q01.png" width="80%"gt
01:19View SolutionFor shown situation find ∠BCA :-
ltimg src="https://d10lpgp6xz60nq.cloudfront.net/physics_images/ALN_PHY_R05_E01_035_Q01.png" width="80%"gt01:32View SolutionWrite the vector →F in terms of its component :-
ltimg src="https://d10lpgp6xz60nq.cloudfront.net/physics_images/ALN_PHY_R02_E02_002_Q01.png" width="80%"gt01:21View SolutionFind the magnitude of the resultant of shown forces :-
ltimg src="https://d10lpgp6xz60nq.cloudfront.net/physics_images/ALN_PHY_R02_E02_009_Q01.png" width="80%"gt04:05View Solution

