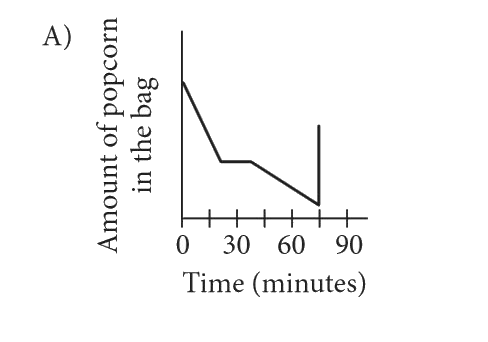
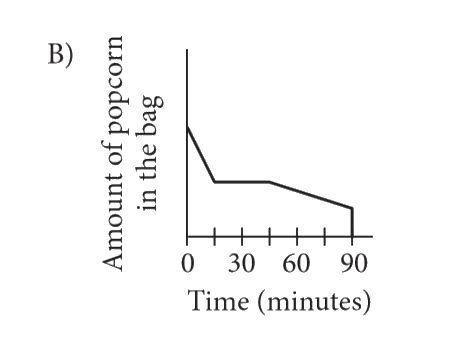
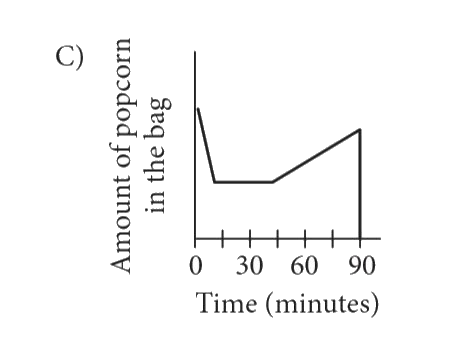
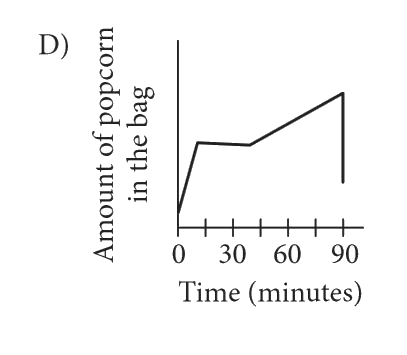
Jake buys a bag of popcorn at a movie theater. He eats half of the popcorn during the 15 minutes of previews. After eating half of the popcorn, he stops eating for the next 30 minutes. Then he gradually eats the popcorn until he accidentally spills all of the remaining popcorn. Which of the following graphs could represent the situation?
A

B

C

D

Video Solution
Text Solution
The correct Answer is:B
During the first 15 minutes Jake is in the theater, or from 0 to 15 minutes, Jake’s popcorn amount decreases by half. This is represented graphically by a linear decrease. From 15 to 45 minutes, Jake stops eating popcorn. This is represented graphically by a constant y-value. From 45 to 90 minutes, Jake eats more popcorn. This is represented graphically by another linear decrease as the amount of popcorn in the bag gradually goes down. At 90 minutes, Jake spills all of his remaining popcorn. This is represented graphically by a vertical drop in the y-value to 0. Choice B matches these representations.
Choices A, C, and D are incorrect. At no point during this period of time did Jake buy more popcorn. All of these graphs represent an increase in the amount of popcorn in Jake’s bag at some point during this period of time.
|
Similar Questions
He sat up …. to eat a nut
View SolutionHe sat up …. to eat a nut
View SolutionWhere did the narrator eat a nice meal one evening and how did he feel after eating?
View SolutionAnalogy: Melting of ice:Physical change. Popping of popcorn:_____
View SolutionName the carbonyl compound that gives popcorn its butter flavour.
View SolutionHe sat up …. to eat a nut
View SolutionSelect the correct passive form of the given sentence.
He was eating a large pizza.
View SolutionIn the following questions, a sentence/ part of the sentence is printed in bold. Below are given alternatives to the bold sentence/part of the sentence at (1), (2) and (3) which may improve the sentence. Choose the correct alternative. In case no Improvement is needed your answer is (4).
They could not tell me why did he not eat his lunch.
View Solution
