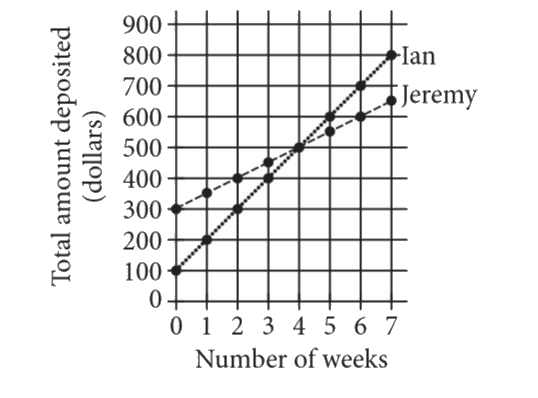
The two graphs above show the total amounts of money that Ian and Jeremy each have deposited into their savings accounts for the first seven weeks after opening their accounts. After they made their initial deposits, how much more did Ian deposit each week than Jeremy?

200
100
50
25
The correct Answer is:C
The graph for Ian shows that the initial deposit was $100 and that each week the total amount deposited increased by $100. Therefore, Ian deposited $100 each week. The graph for Jeremy shows that the initial deposit was $300 and that each week the total amount deposited increased by $50. Therefore, Jeremy deposited $50 each week. Thus, Ian deposited $50 more than Jeremy did each week.
Choice A is incorrect. This is the difference between the initial deposits in the savings accounts. Choice B is incorrect. This is the amount Ian deposited each week. Choice D is incorrect. This is half the amount that Jeremy deposited each week.
Similar Questions
The inequation represented by the graph given below is :
View SolutionThe inequation that best describes the graph given below is _________
View SolutionThe inequation that best describes the following graph is _________
View SolutionWhich inequations represent the shaded region in the given figure
View SolutionDemand deposits include (Choose the correct alternative)
(a) Saving account deposits and fixed deposits
(b) Saving account deposits and current account deposits
(c) Current account deposits and fixed deposits
(d) All types of deposits
View Solutiona=18t+15
Jane made an initial deposit to a savings account. Each week thereafter she deposited a fixed amount to the account. The equation above models the amount a, in dollars, that Jane has deposited after t weekly deposits. According to the model, how many dollars was Jane’s initial deposit? (Disregard the $ sign when gridding your answer.)
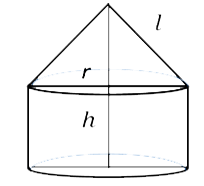
View SolutionThe total surface area of the given solid figure is _______________.

View Solution
