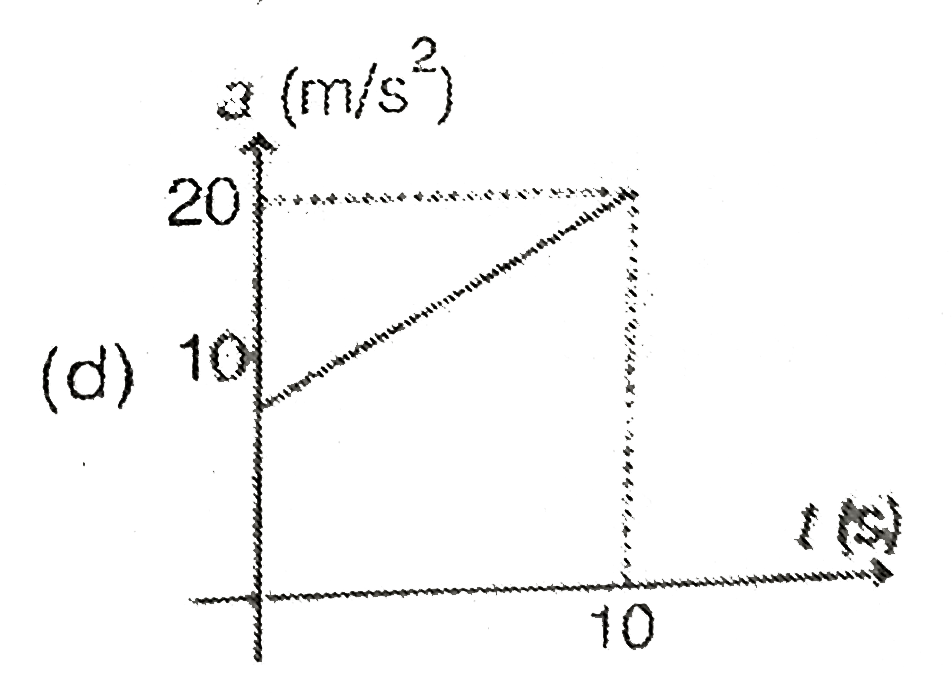
Acceleration of two identical particles moving in a straight line are as shown in figure.
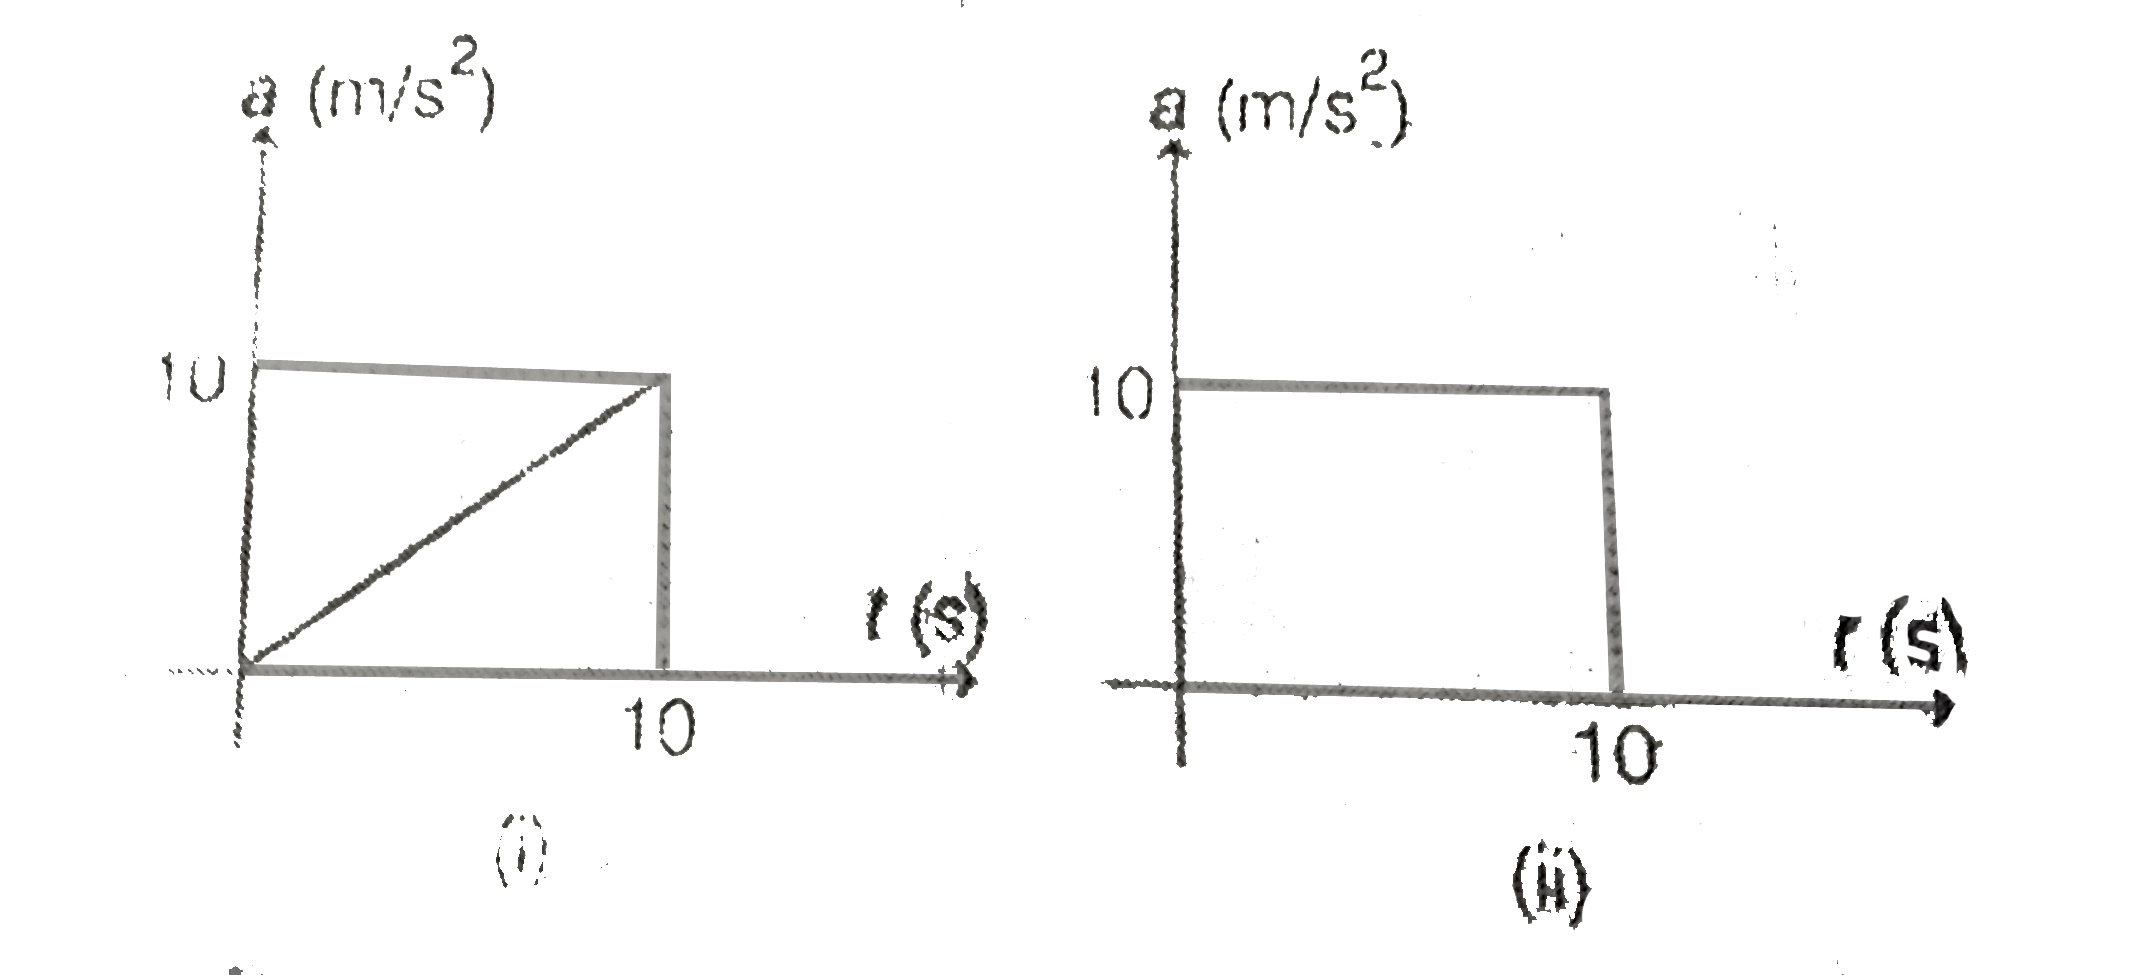
The corresponding a-t graph of their centre of mass will be
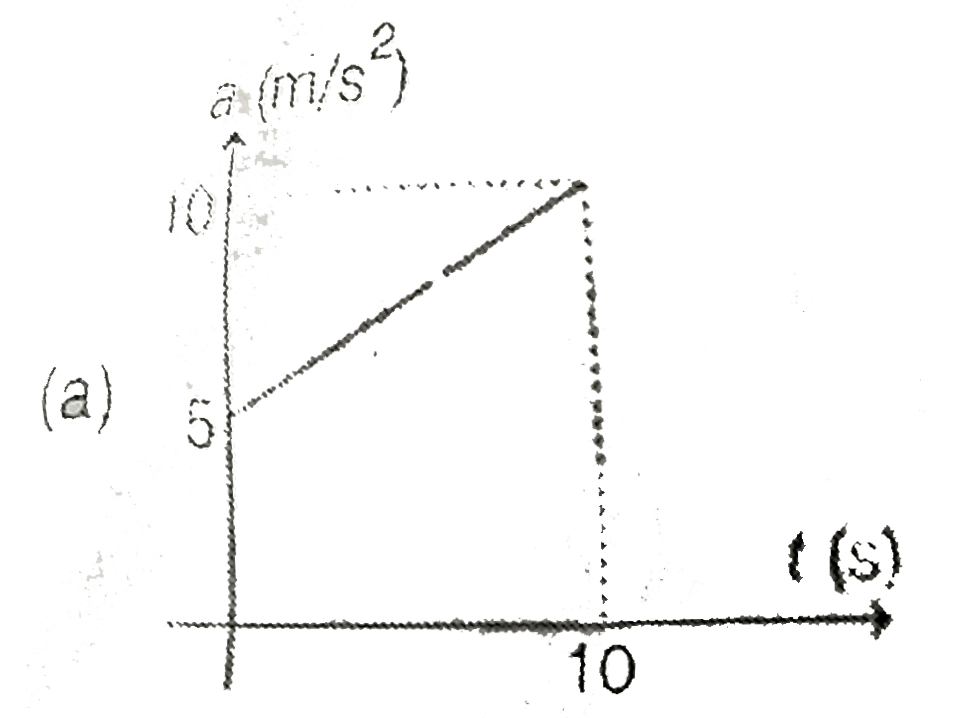
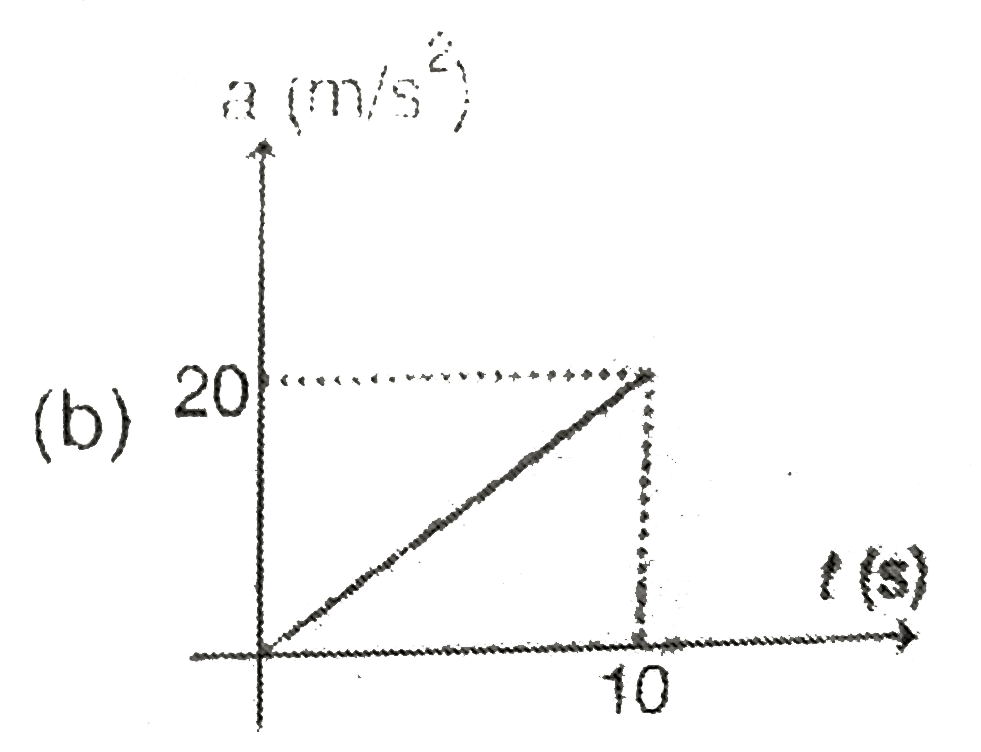
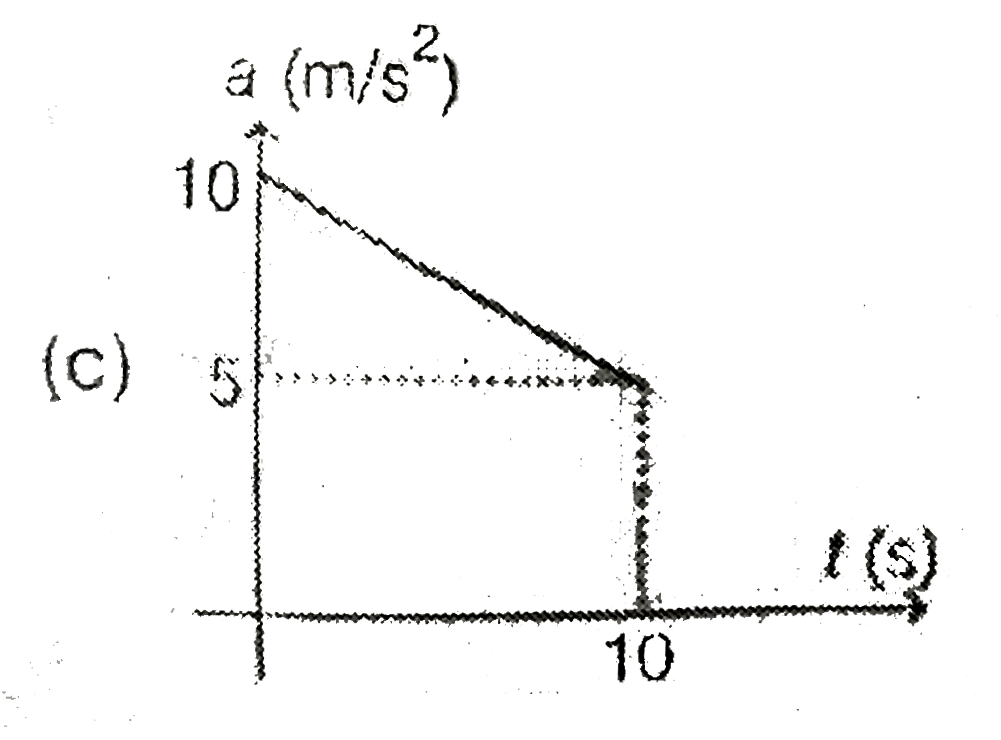
Step by step video & image solution for Acceleration of two identical particles moving in a straight line are as shown in figure. The corresponding a-t graph of their centre of mass will be by Physics experts to help you in doubts & scoring excellent marks in Class 11 exams.
Updated on:21/07/2023Topper's Solved these Questions
- CENTRE OF MASS, IMPULSE AND MOMENTUMBOOK - DC PANDEYCHAPTER - CENTRE OF MASS, IMPULSE AND MOMENTUMEXERCISE - More a than one option is Correct
1 Videos
- CENTRE OF MASSBOOK - DC PANDEYCHAPTER - CENTRE OF MASSEXERCISE - Medical entrances gallery
27 Videos
- CENTRE OF MASS, LINEAR MOMENTUM AND COLLISIONBOOK - DC PANDEYCHAPTER - CENTRE OF MASS, LINEAR MOMENTUM AND COLLISIONEXERCISE - Level 2 Subjective
21 Videos
Similar Questions
Acceleration of two identical particles moving in a straight line are as shown in figure.
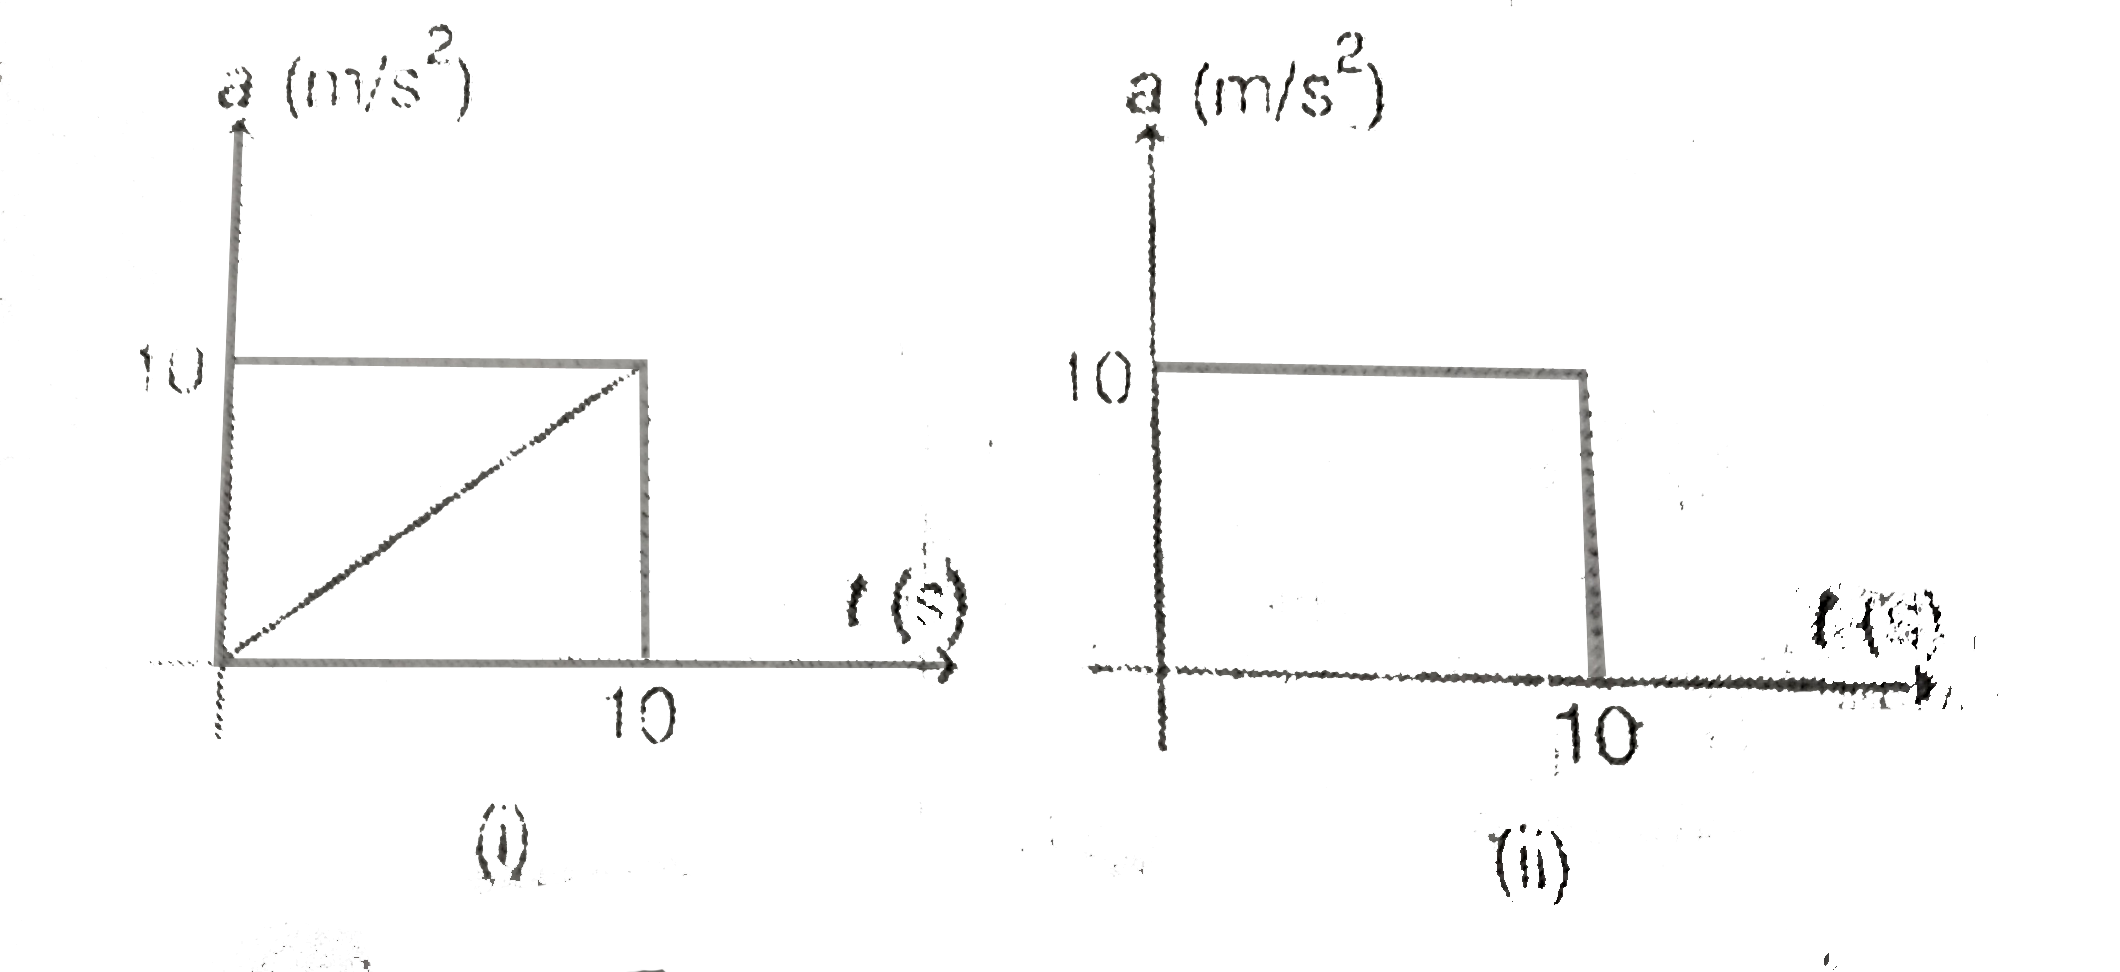
If initial velocity of both the particles was zero. Then velocity of their centre of mass after 10 s will be
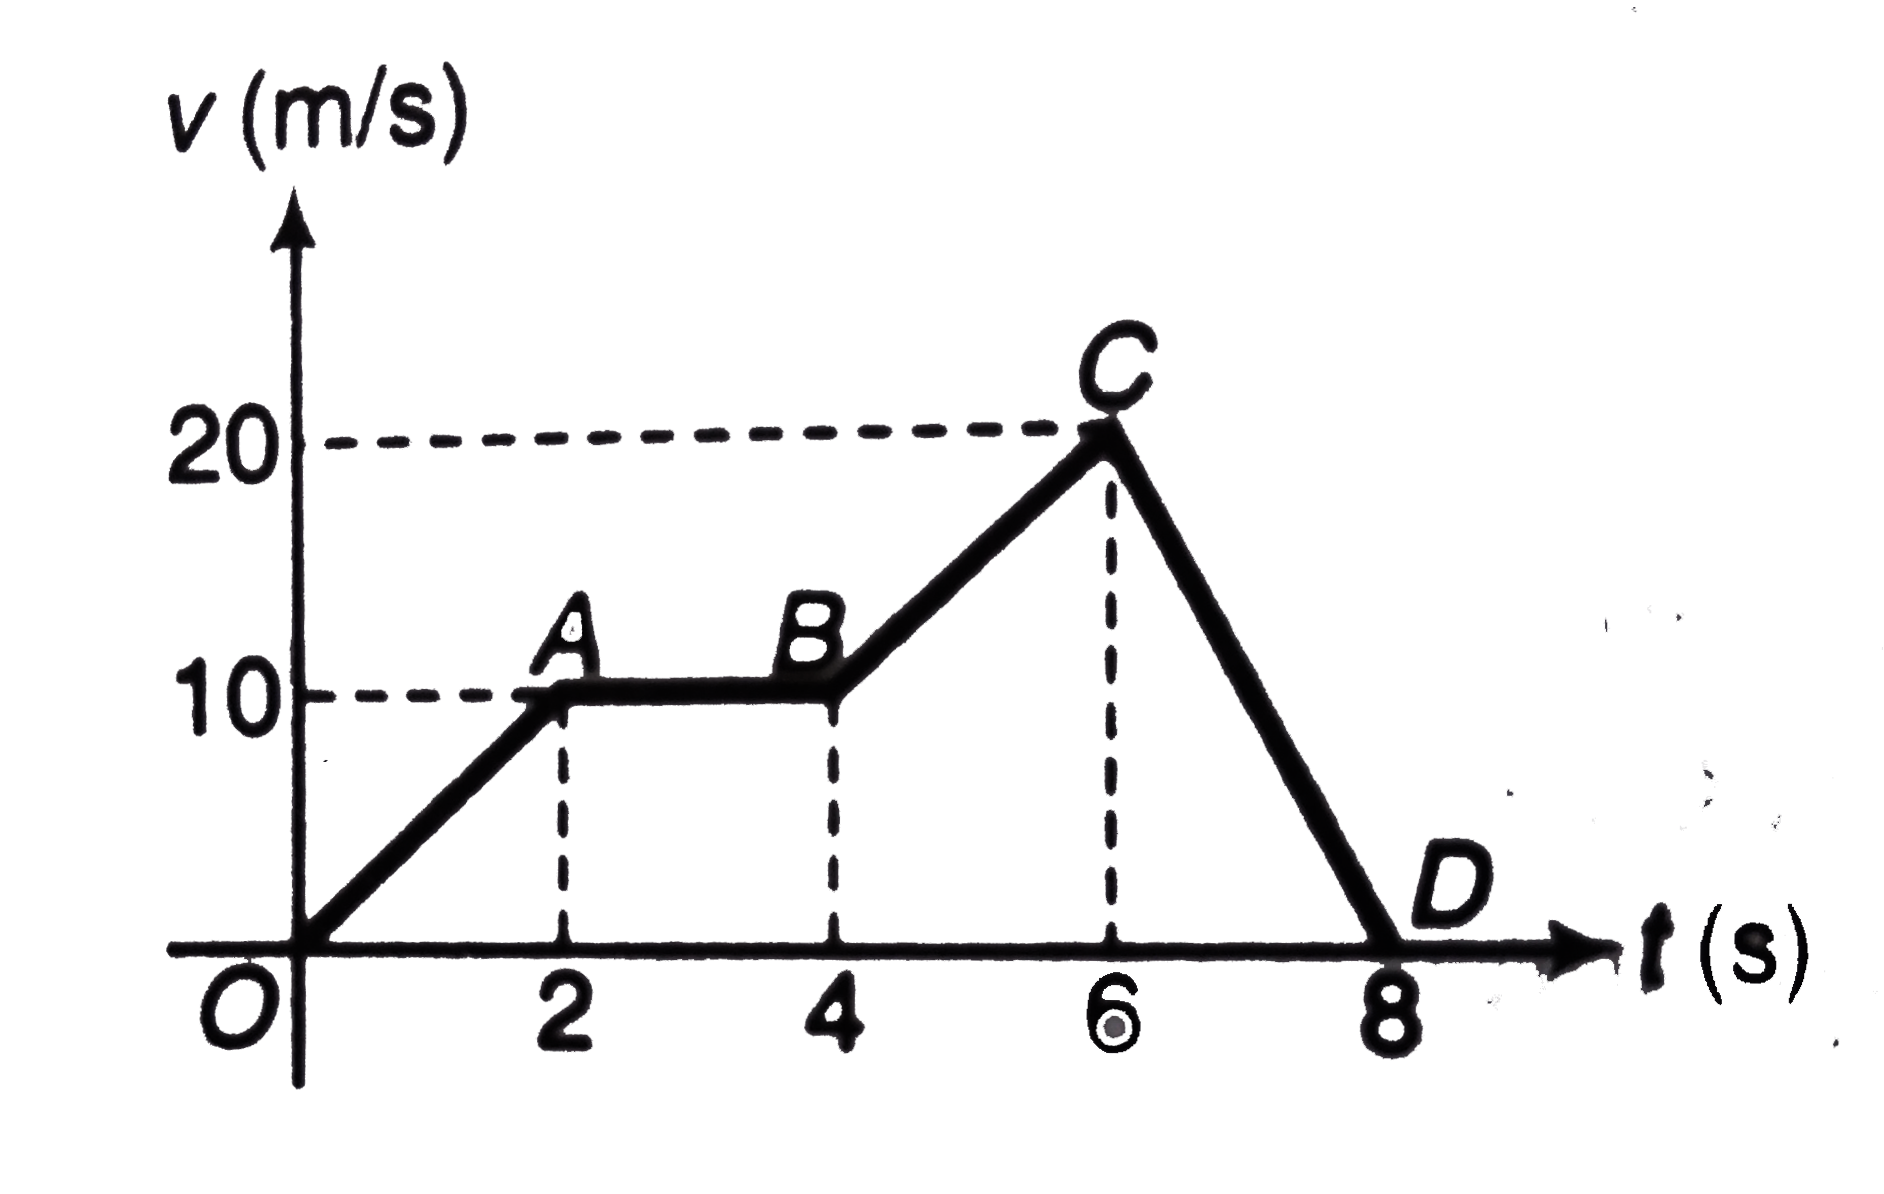
View SolutionVelocity-time graph of a particle moving in a straight line is shown in figure. Plot the corresponding displacement-time graph of the particle if at time t=0, displacement s=0.
View Solution
Knowledge Check
Displacement time graph of a particle moving in a straight line is a shown in figure.
 Ain region A acceleration is positiveBin region B acceleration is negativeCin region C acceleration is positiveDin region D acceleration is negative
Velocity displacement graph of a particle moving in a straight line is as shown in figure.
 Amagnitude of acceleration of particle is decreasingBmagnitude of acceleration of particlre is increasingCacceleration versus displacement graph straight lineDacceleration versus displacement graph is parabola
Velocity versus displacement graph of a particle moving in a straight line as shown in figure.
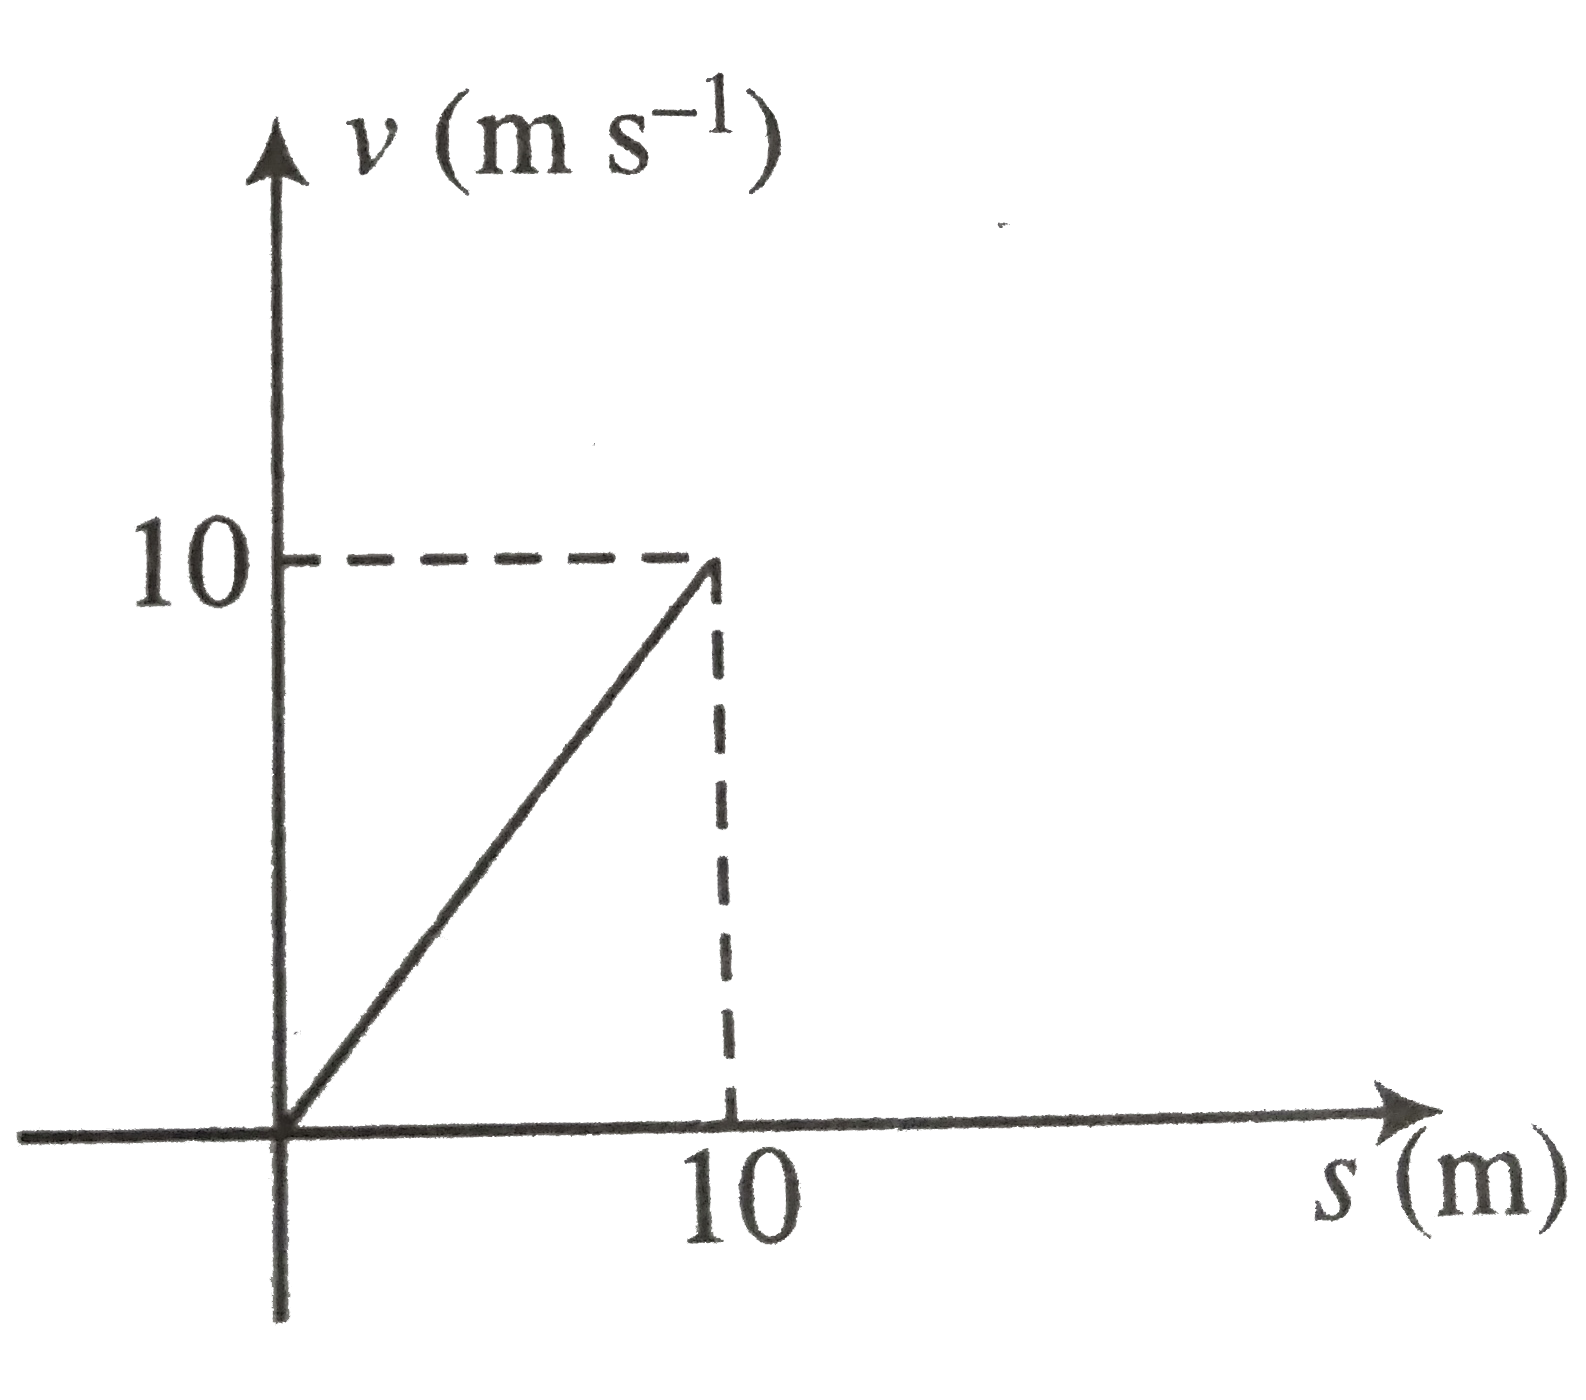
The corresponding acceleration versus velocity graph will be .A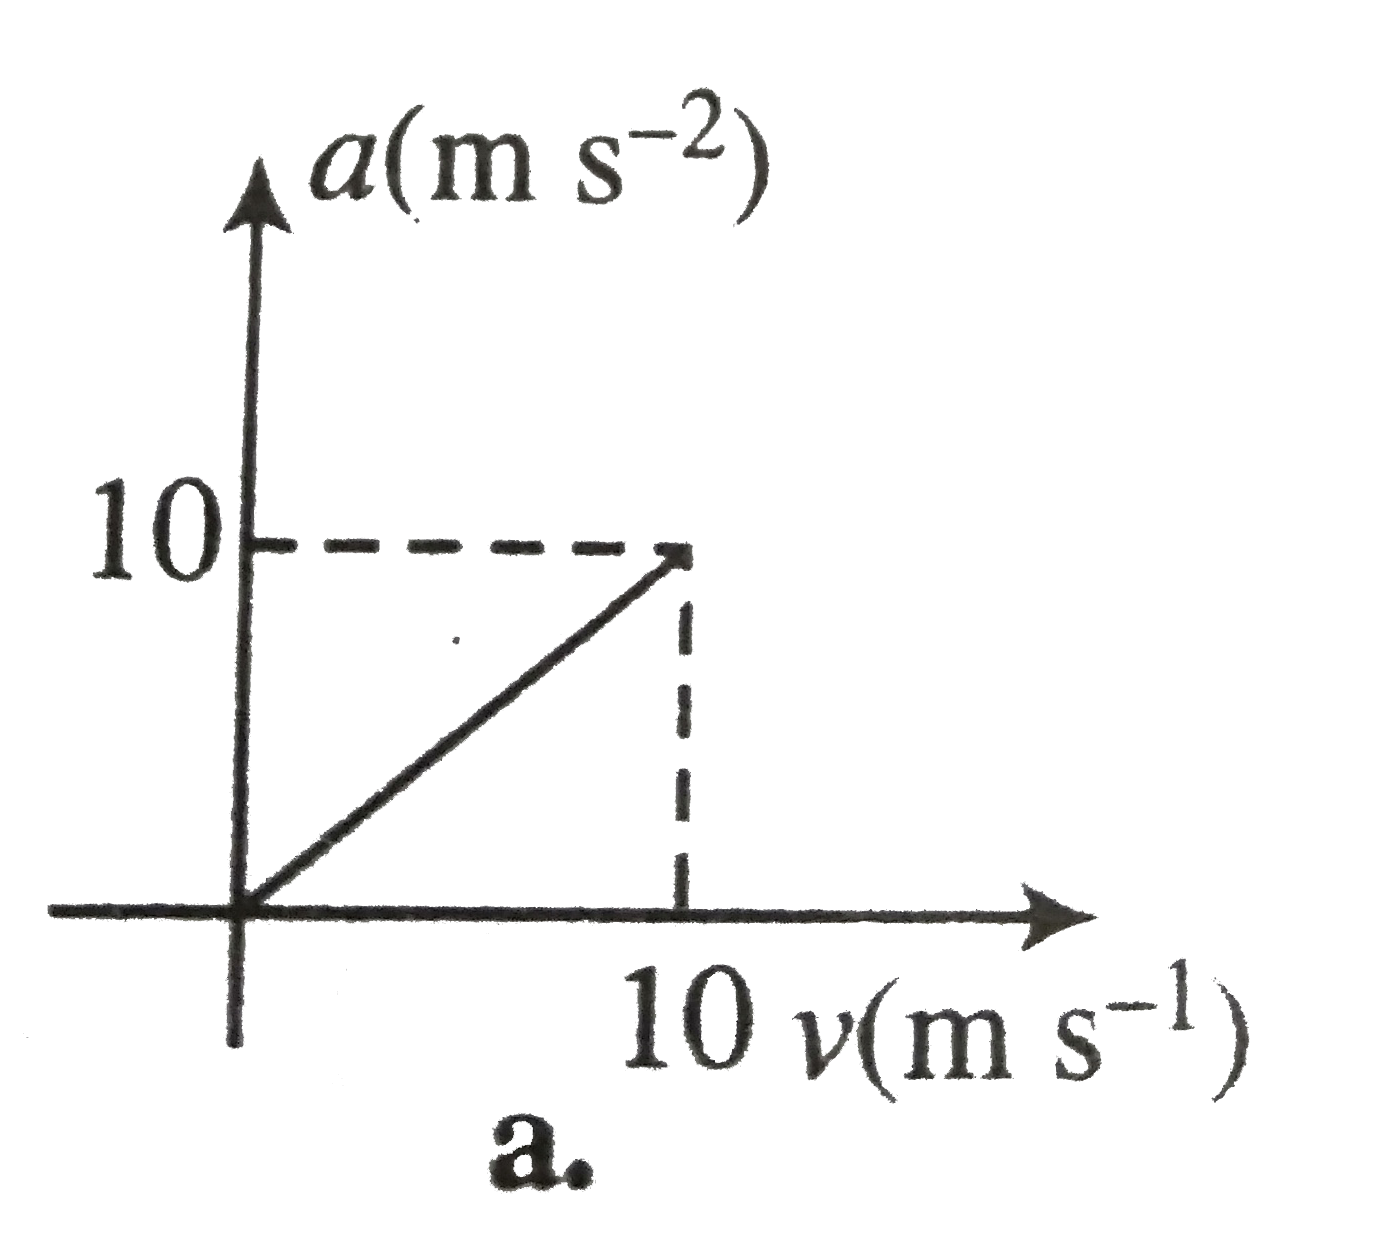 B
B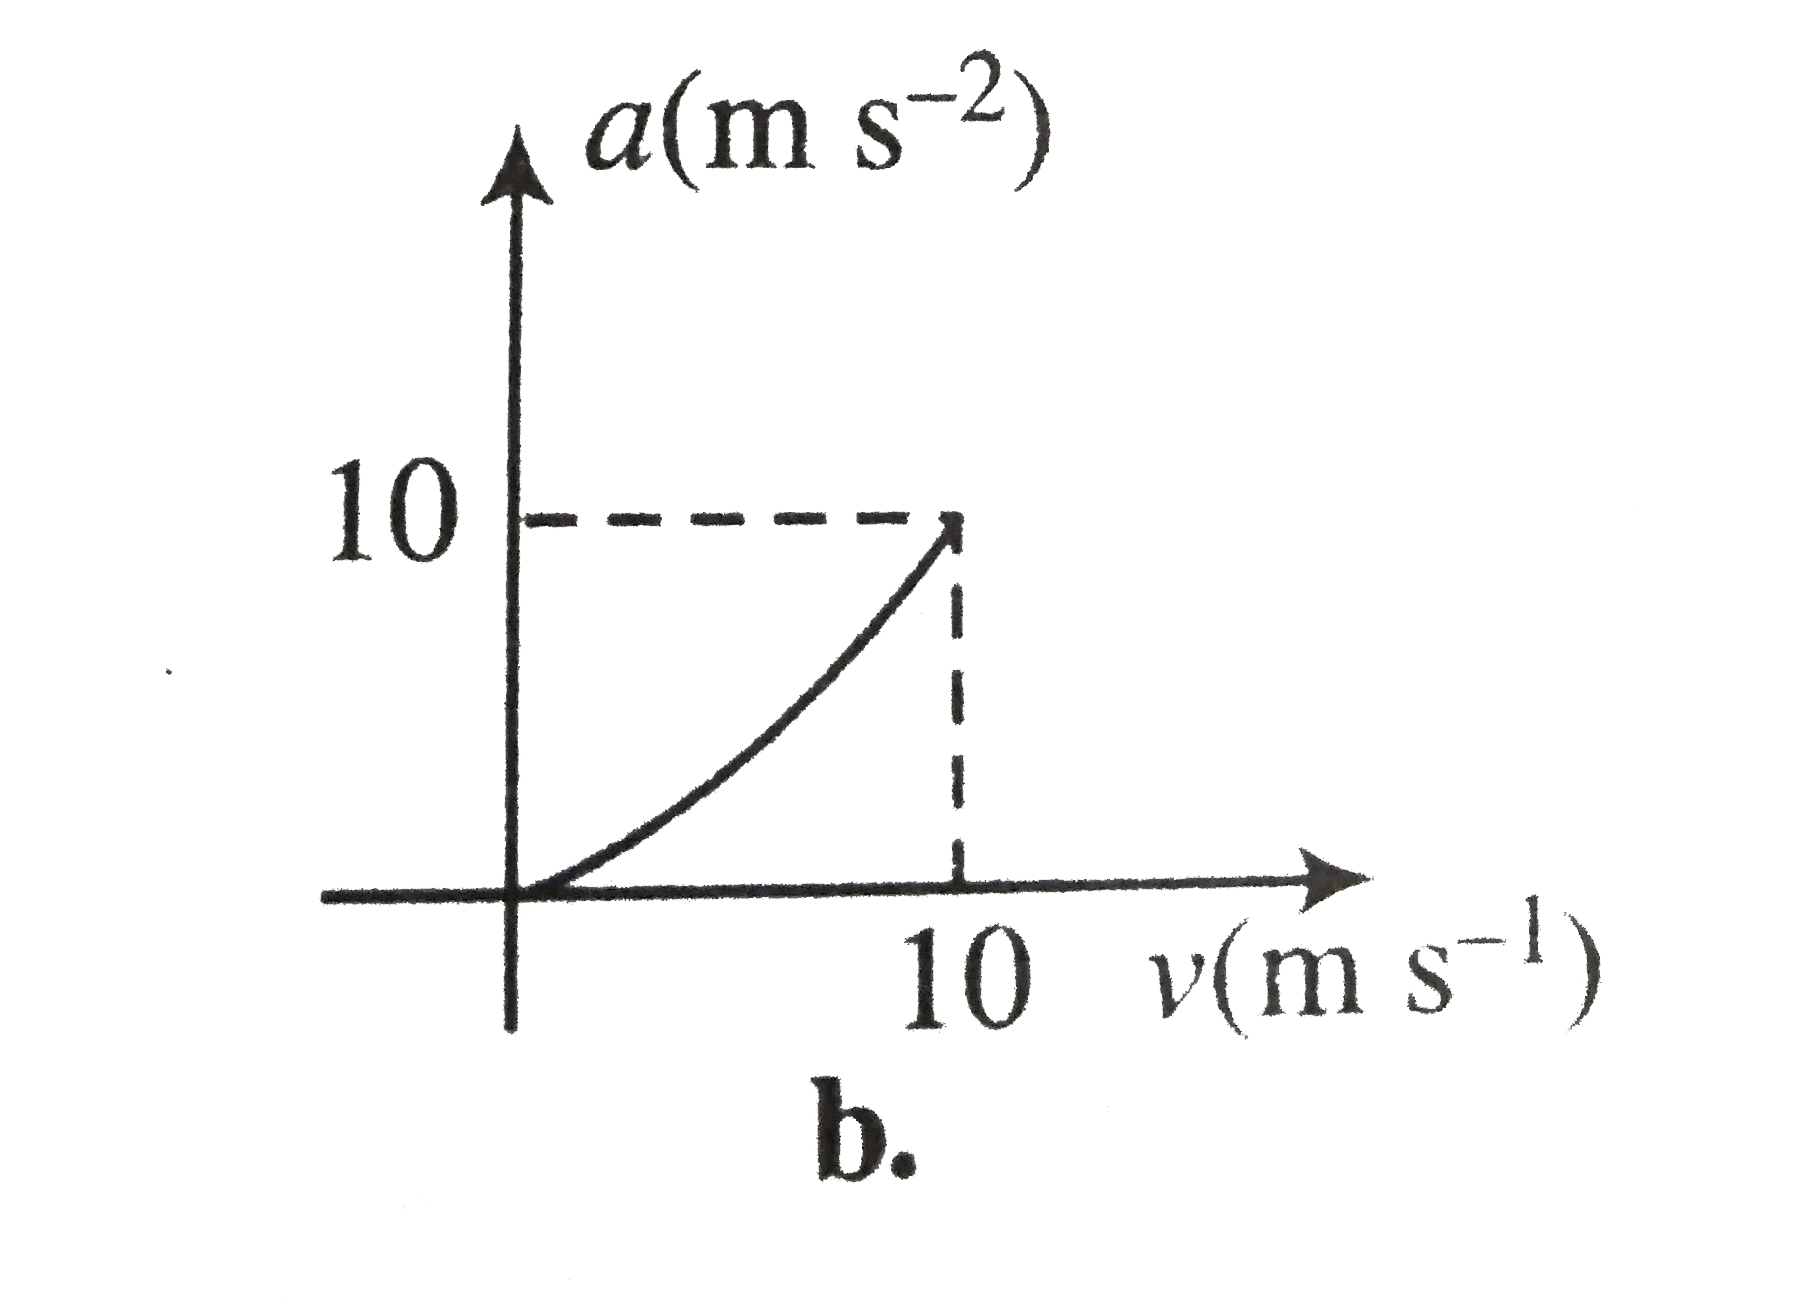 C
C D
D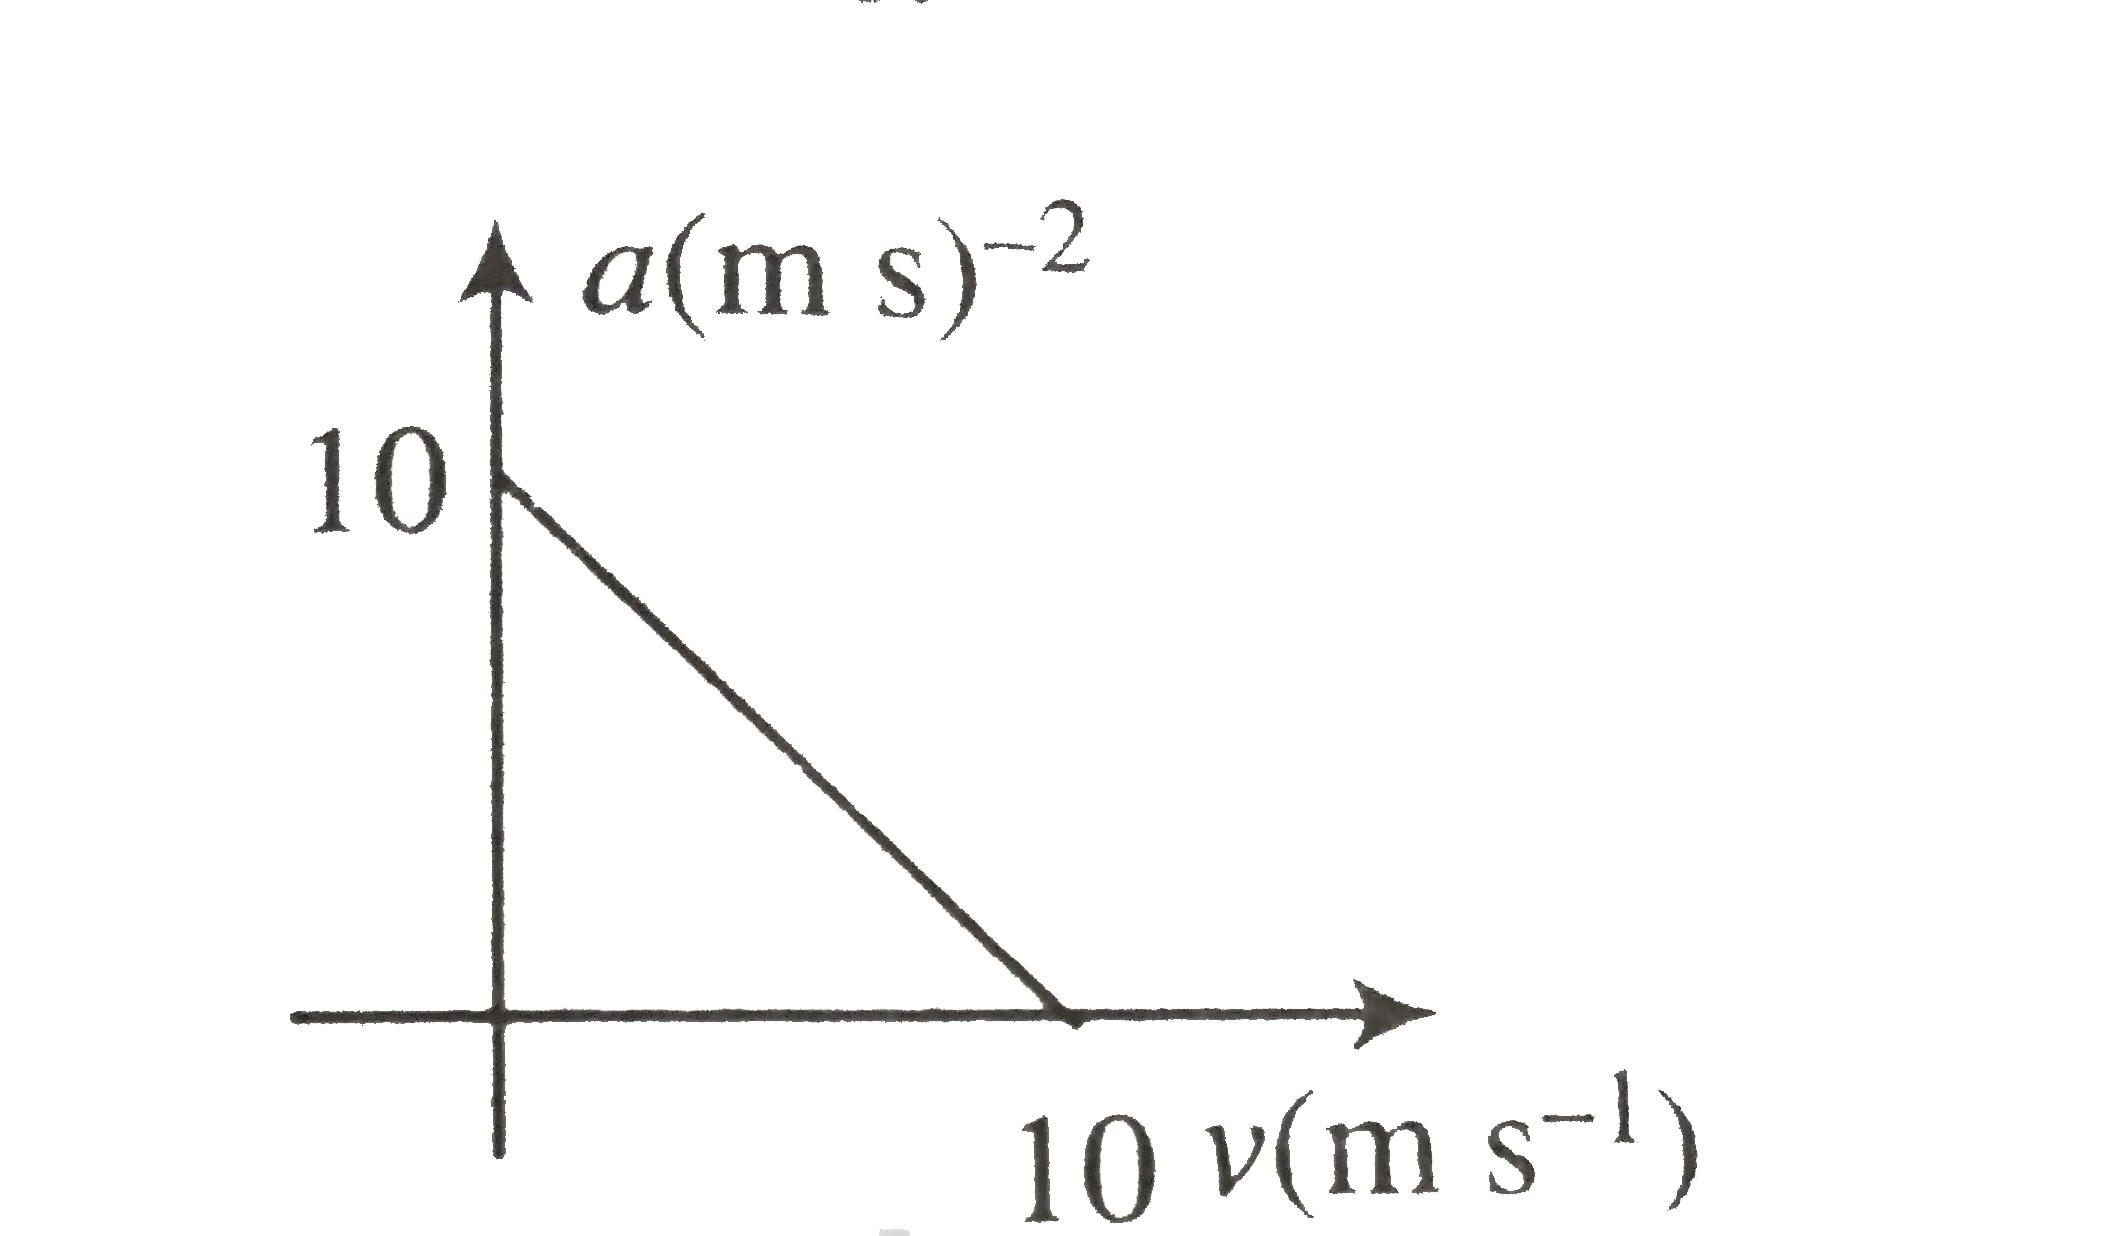
Acceleration versus velocity graph of a particle moving in a straight line starting form rest is as shown in figure. The corresponding velocity-time graph would be :
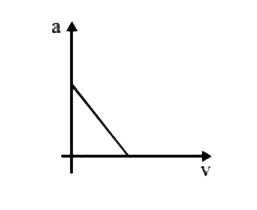
View SolutionAcceleration-velocity graph of a particle moving in a straight line is as shown in the figure. Then slope of velocity-displacement graph

View SolutionThe x-t graph of a particle moving along a straight line is shown in figure
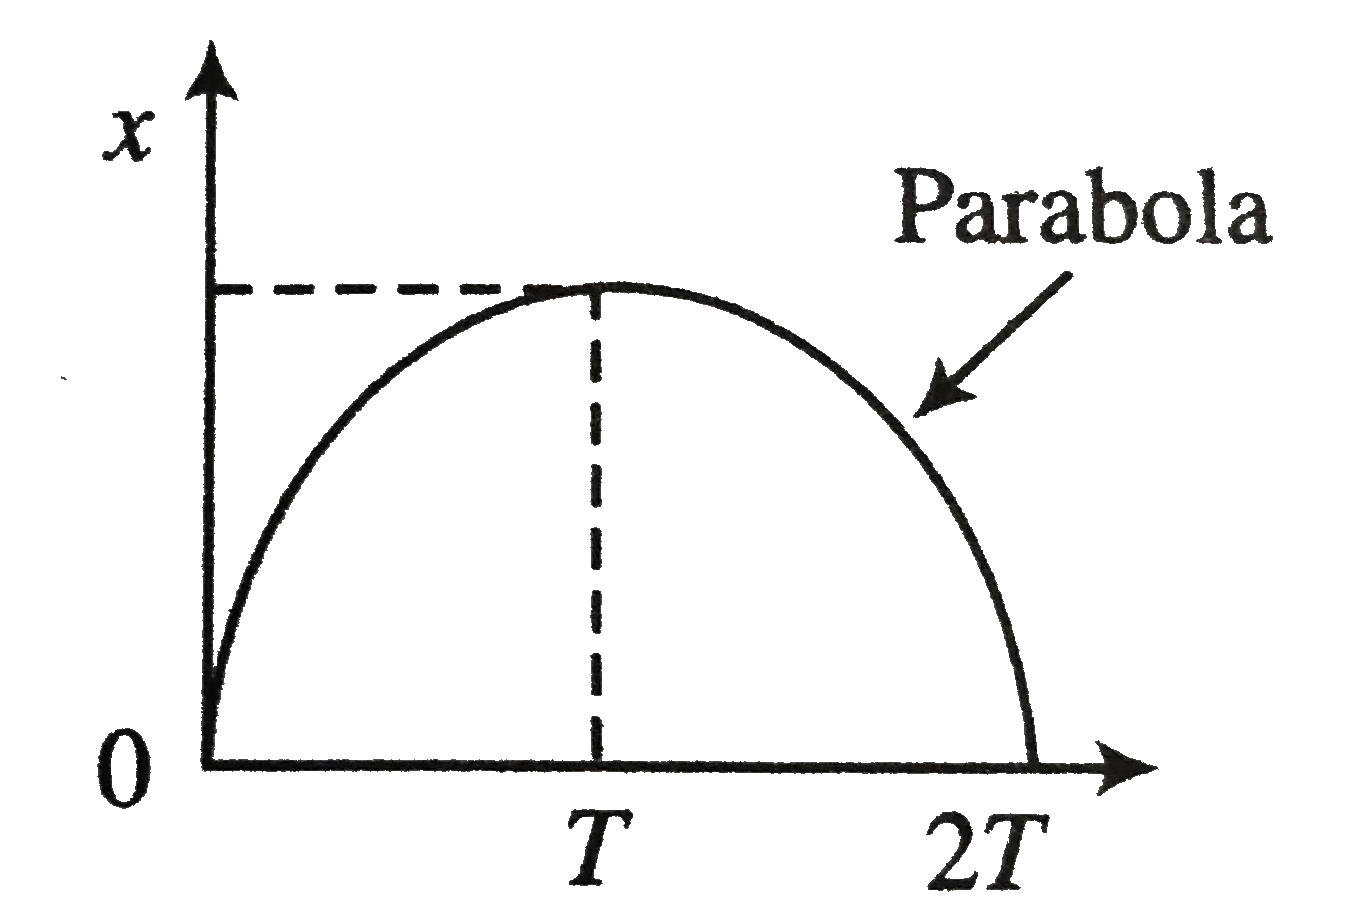
The a-t graph of the particle is correctly shown by
View SolutionThe x−t graph of particle moving along a straight line is shown in figure
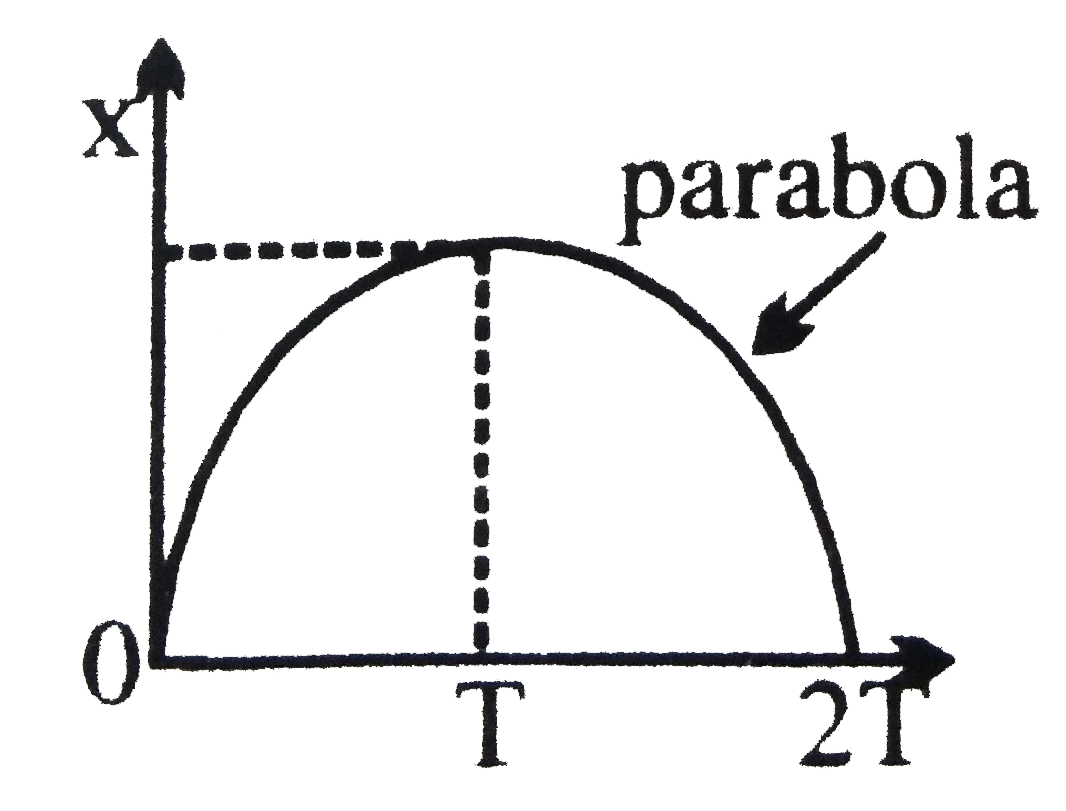
The a−t graph of the particle is correctly shown by
View SolutionThe x−t graph of particle moving along a straight line is shown in figure
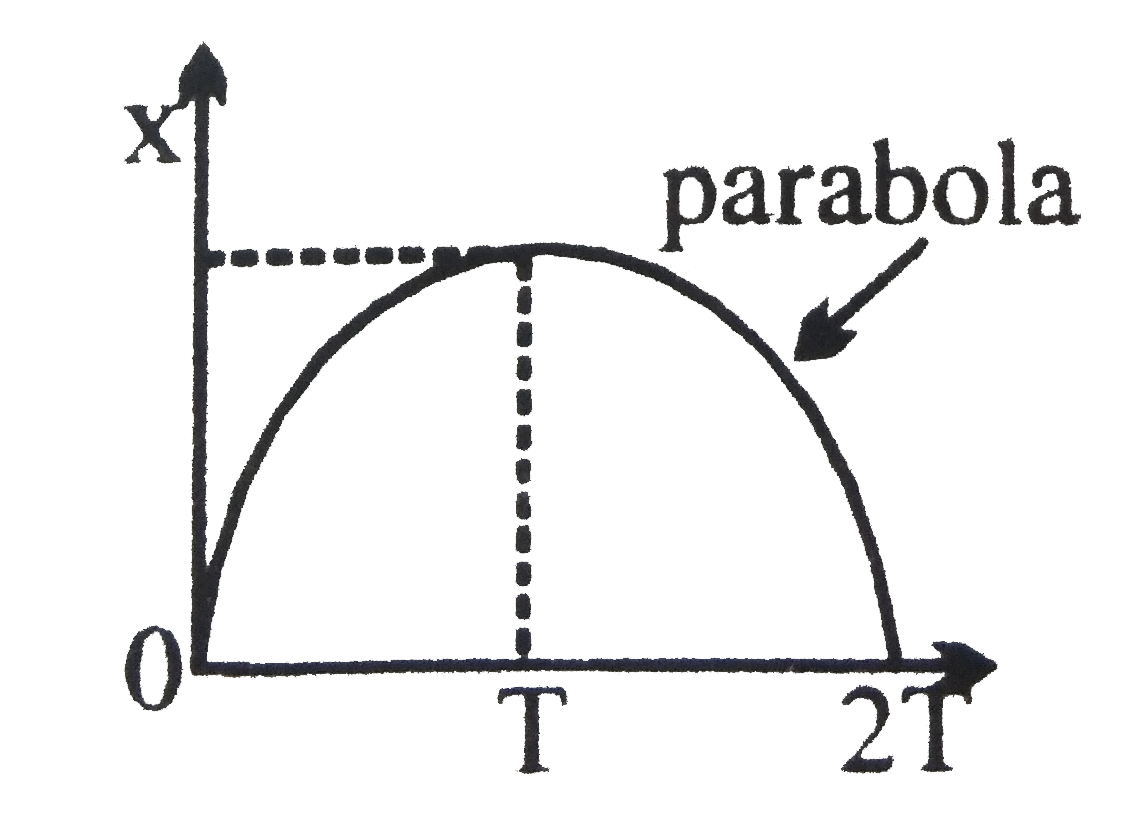
The v−t graph of the particles is correctly shown by
View Solution
