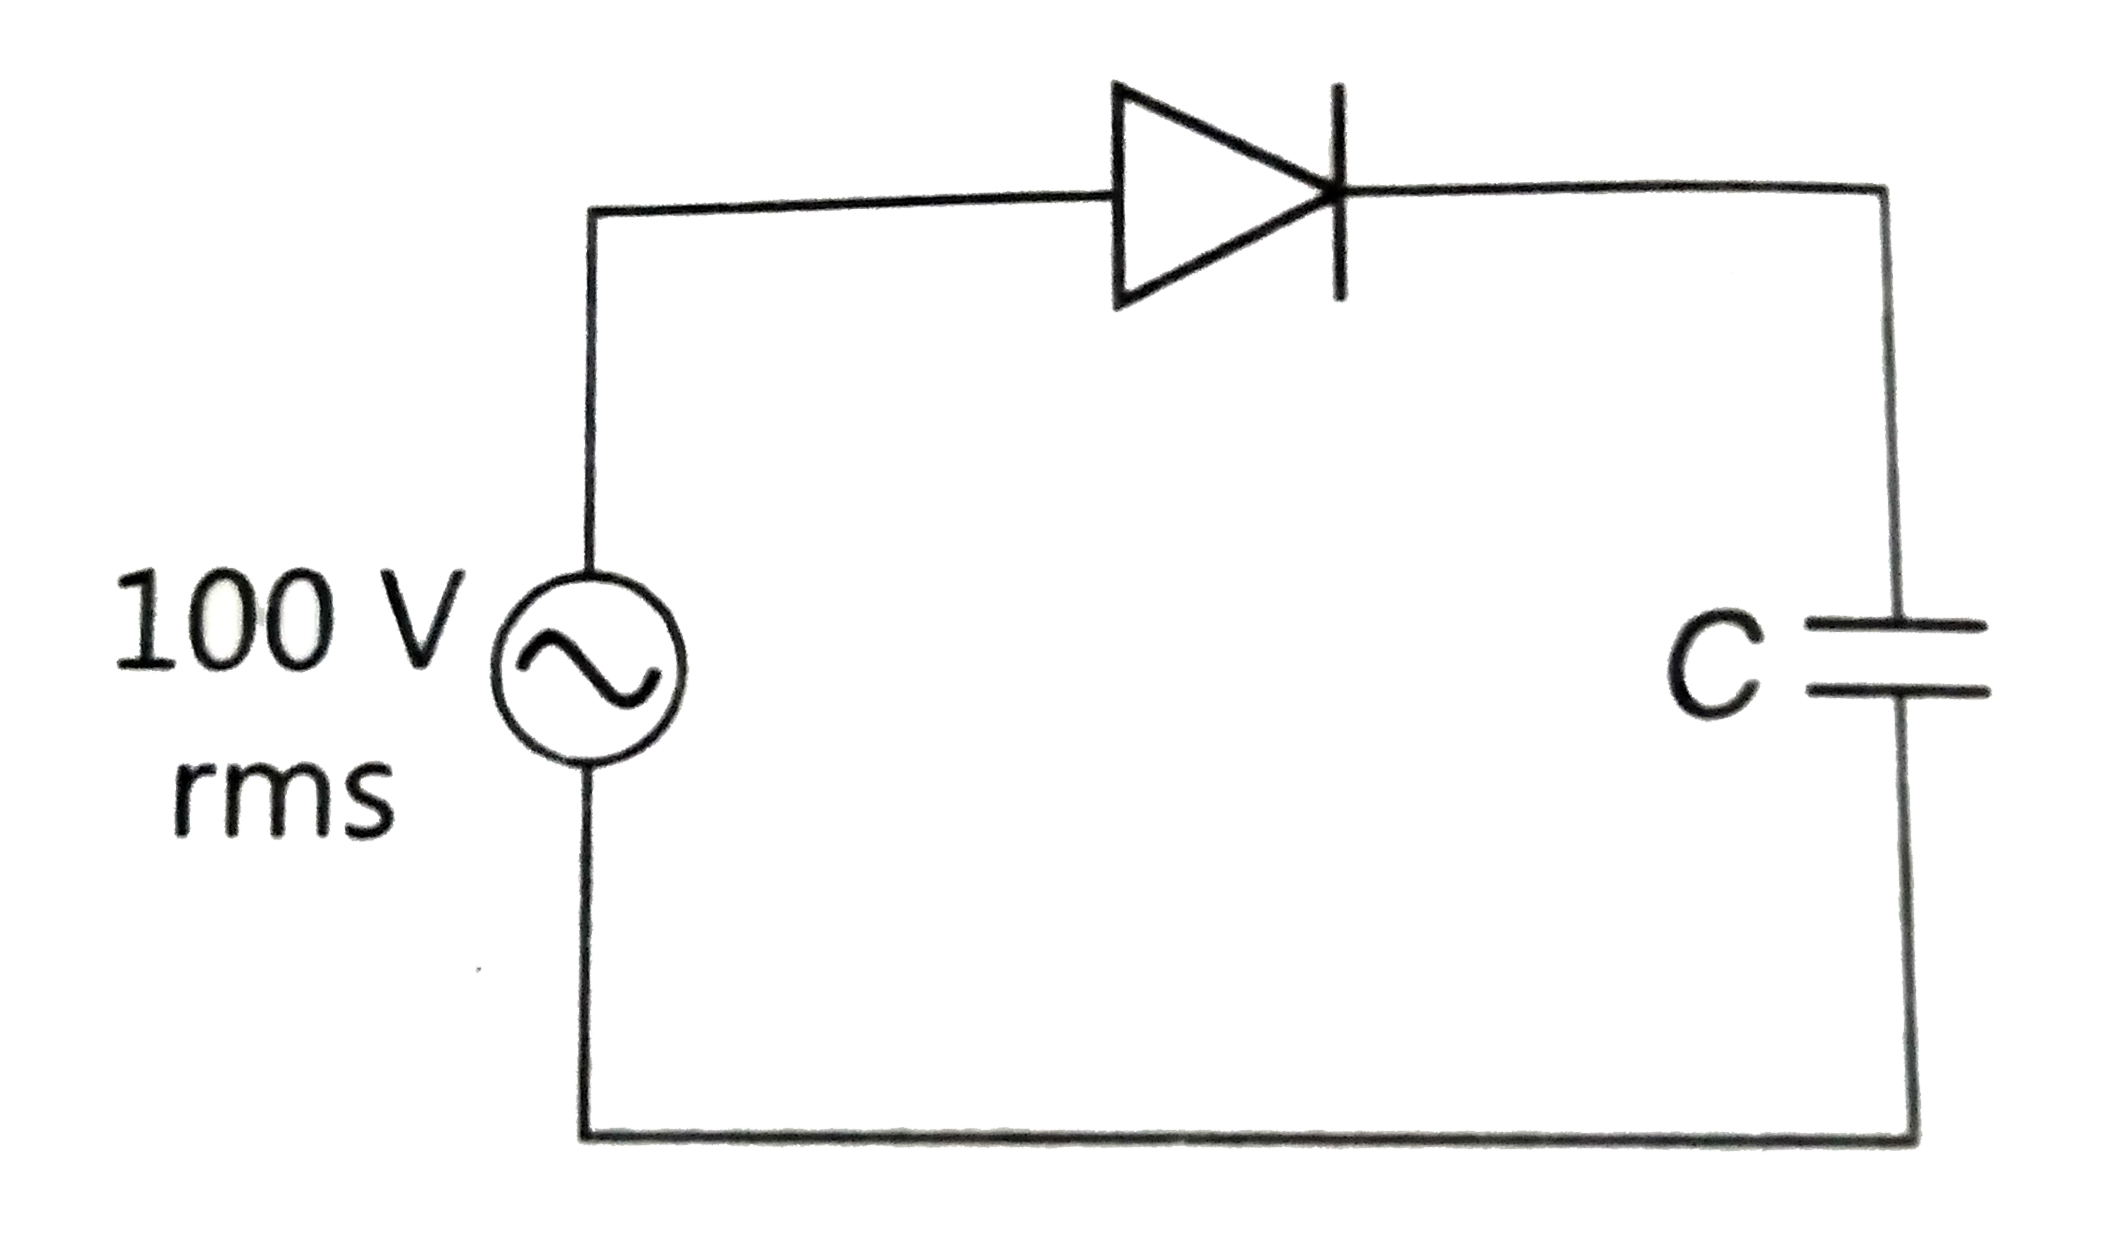
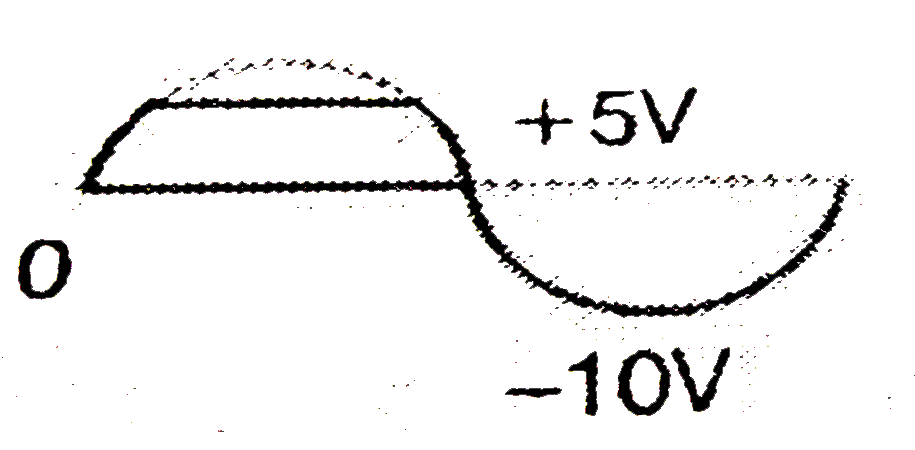
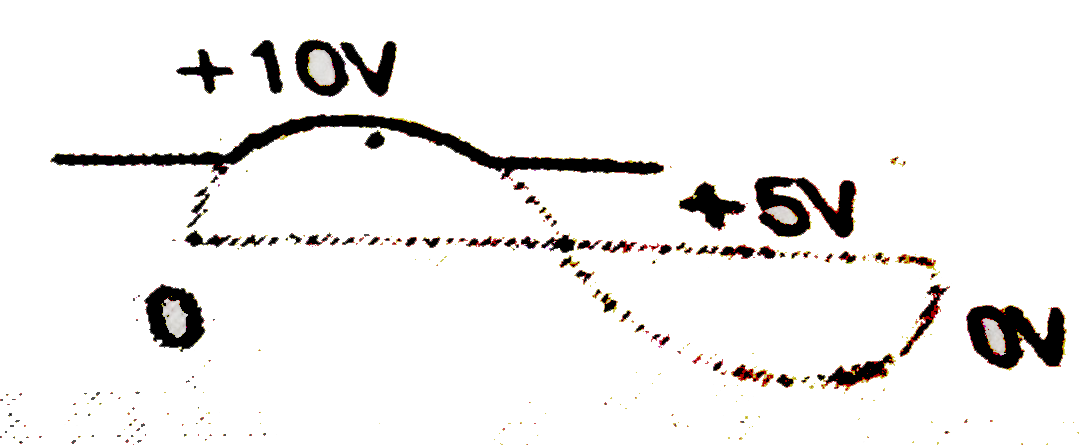
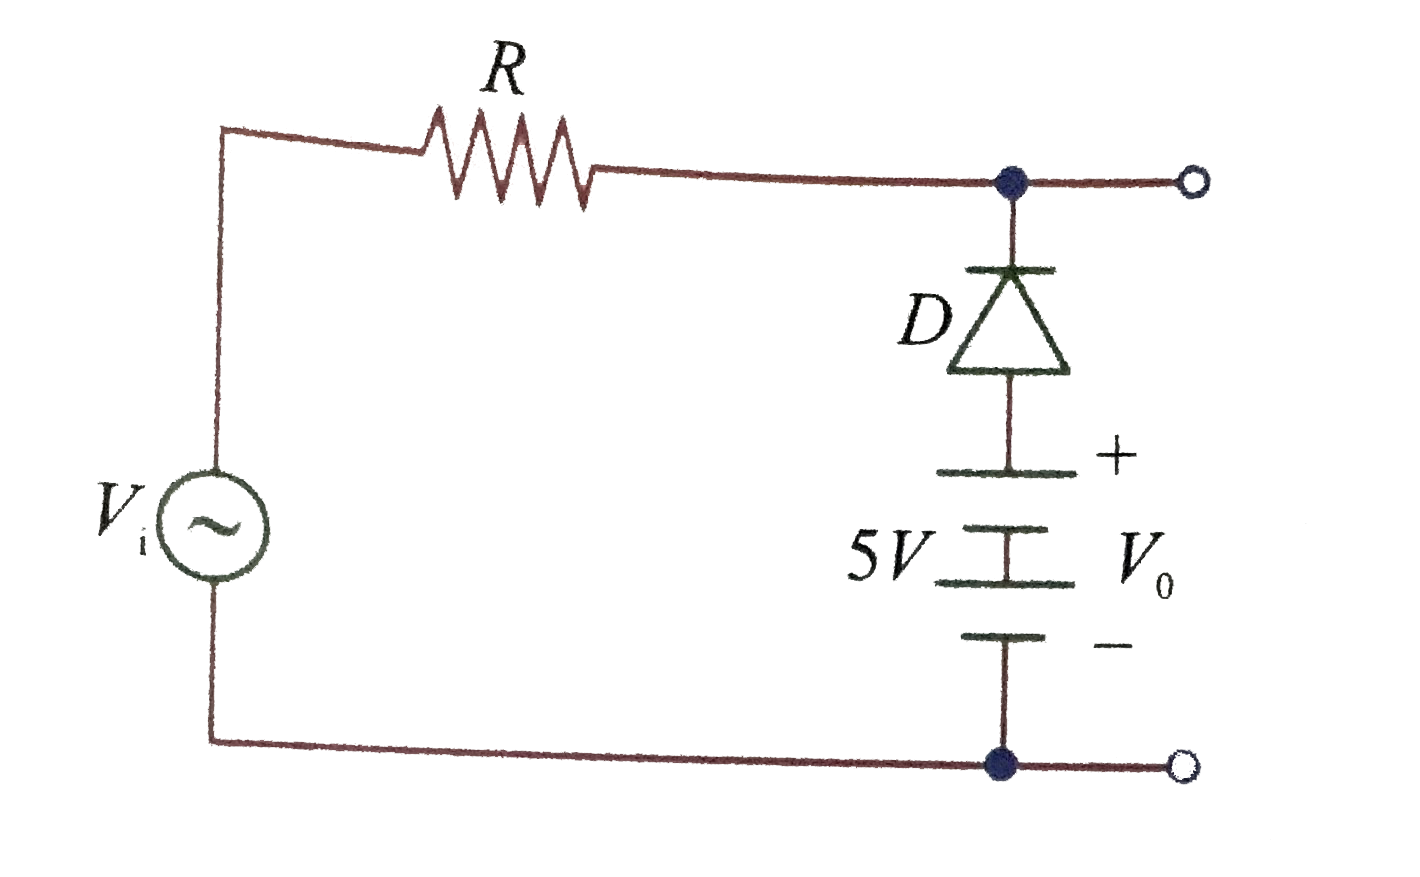
In the figure, D is an ideal diode and an alternating voltage of peak value 10 volts si connected as input V1. Which of the following figures represents the correct waveform of output voltage V0 ?
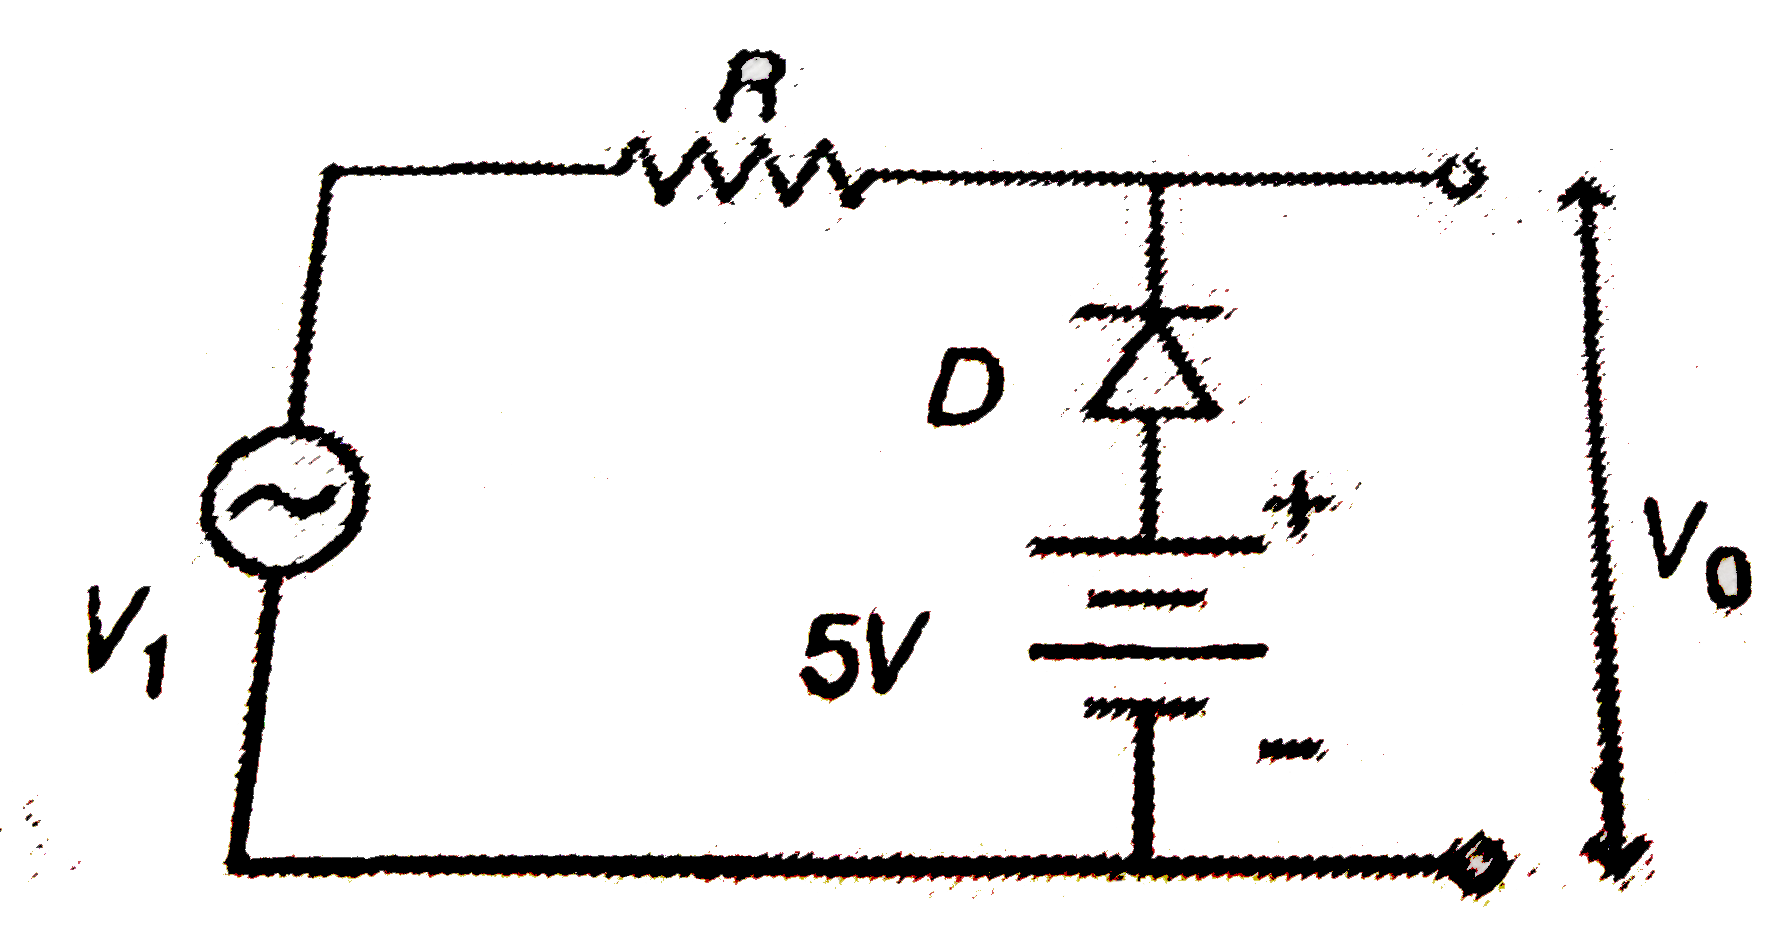
A
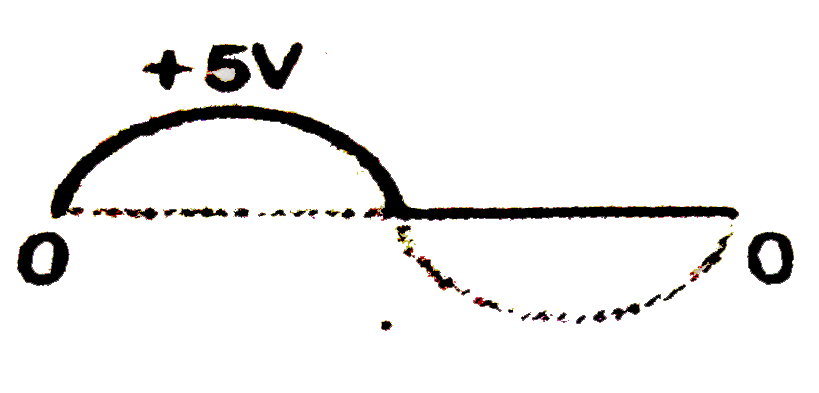
B
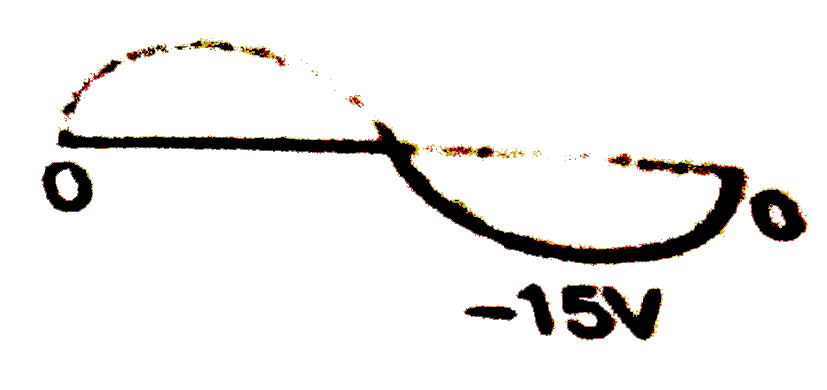
C
D
Text Solution
The correct Answer is:D
|
Topper's Solved these Questions
- SEMICONDUCTORS AND ELECTRONIC DEVICESBOOK - DC PANDEYCHAPTER - SEMICONDUCTORS AND ELECTRONIC DEVICESEXERCISE - More than One Option is Correct
3 Videos
- ROTATIONAL MOTIONBOOK - DC PANDEYCHAPTER - ROTATIONAL MOTIONEXERCISE - Integer Type Questions
17 Videos
- SIMPLE HARMONIC MOTIONBOOK - DC PANDEYCHAPTER - SIMPLE HARMONIC MOTIONEXERCISE - Integer type questions
14 Videos
Similar Questions
Knowledge Check
In the diagram D an ideal diode and an alternating voltage of peak value 10V is connected as input V1. Which of the following diagram represents the correct wavelength of output voltage Vθ ?
 .A
.A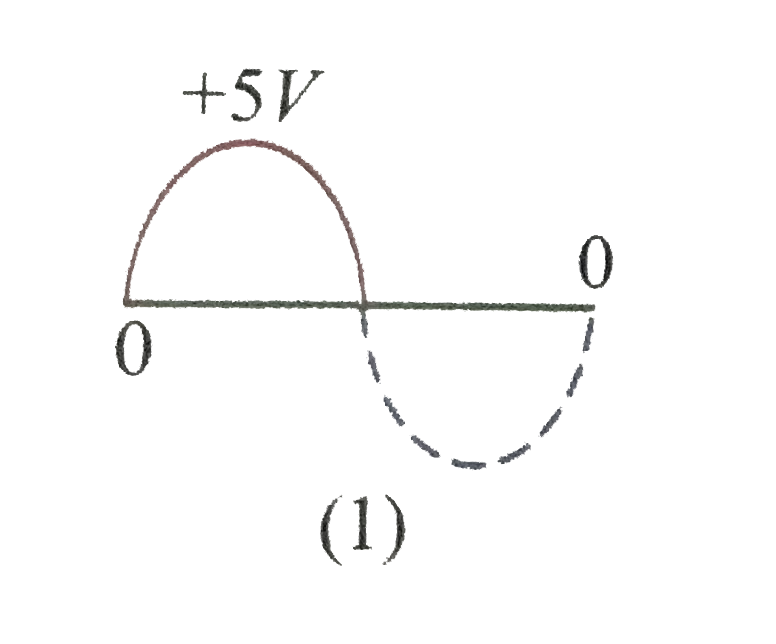 B
B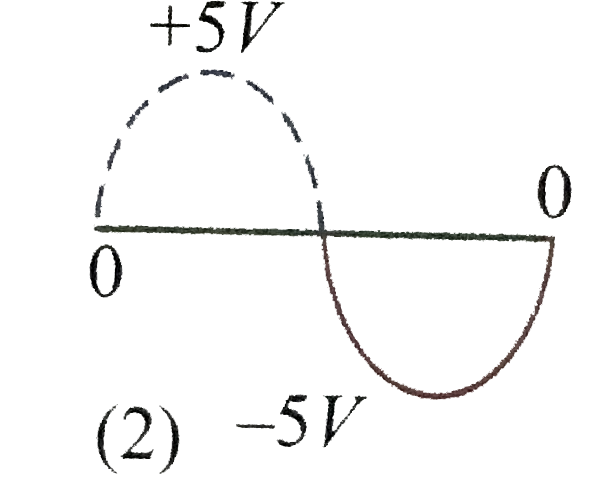 C
C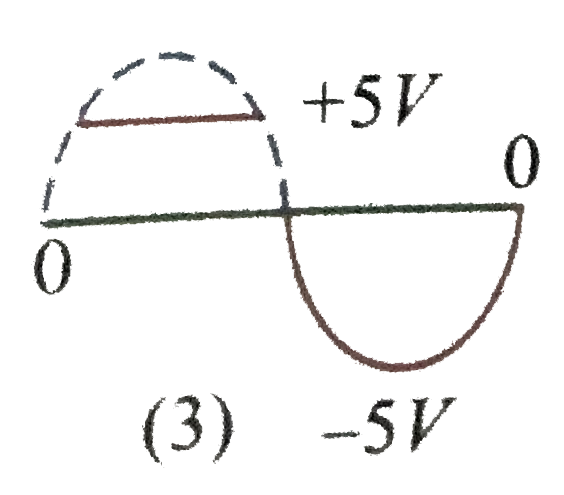 D
D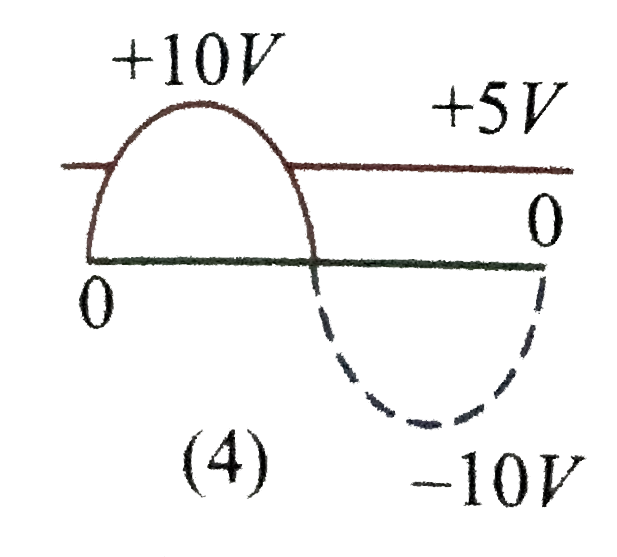
In the circuit shown in figure the maximum output voltage V0 is
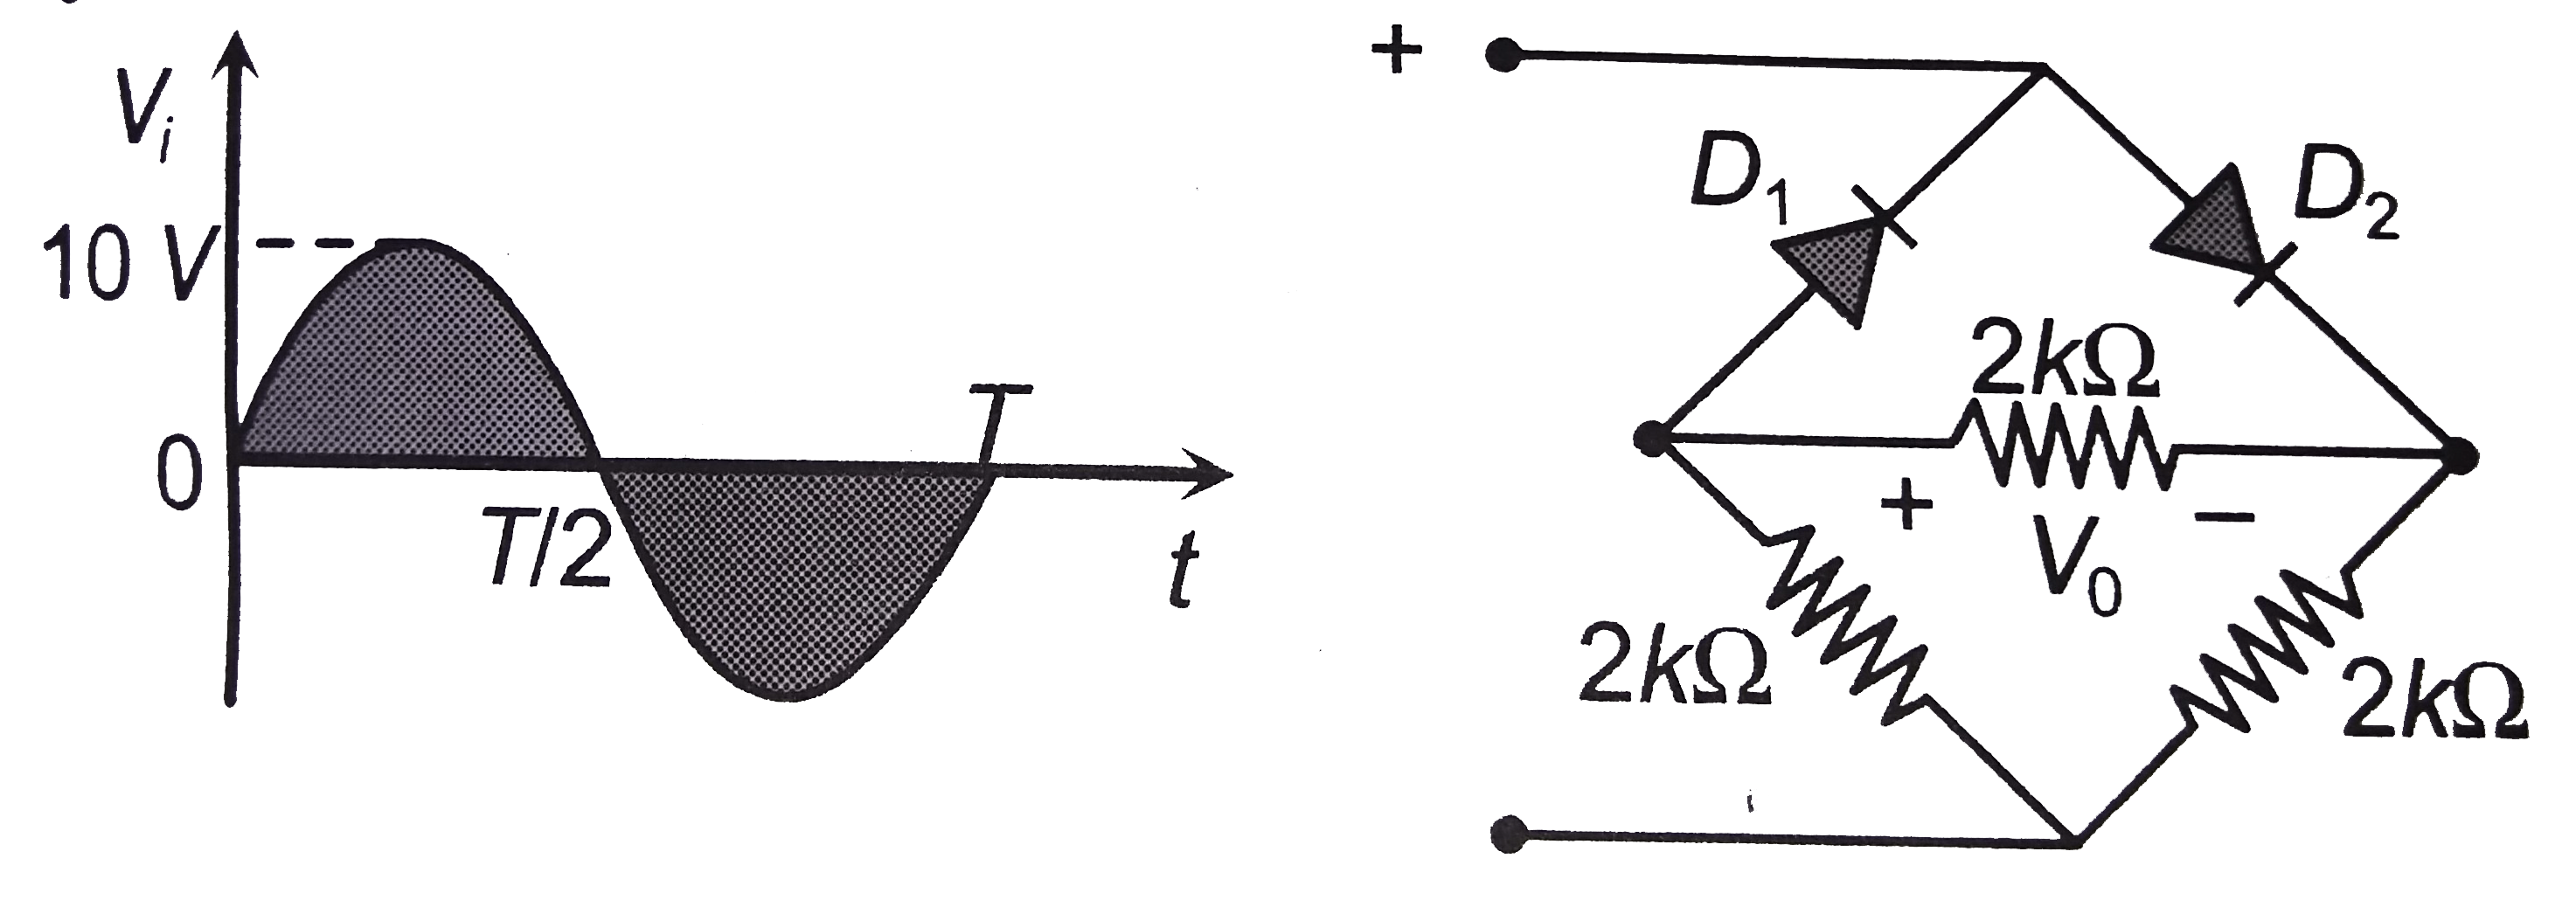 A0VB5VC10VD5√2V
The figure below shows a circuit and its input voltage vi as function of time t.
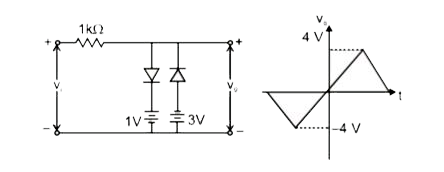
Assuming the diodes to be ideal, which of the following graphs depicts the output voltage v0 as function of time t ?A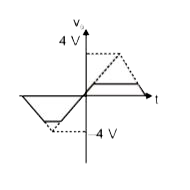 B
B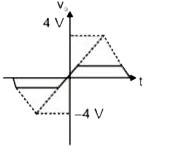 C
C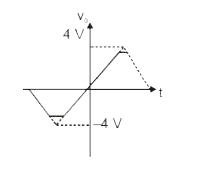 D
D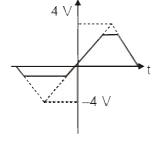
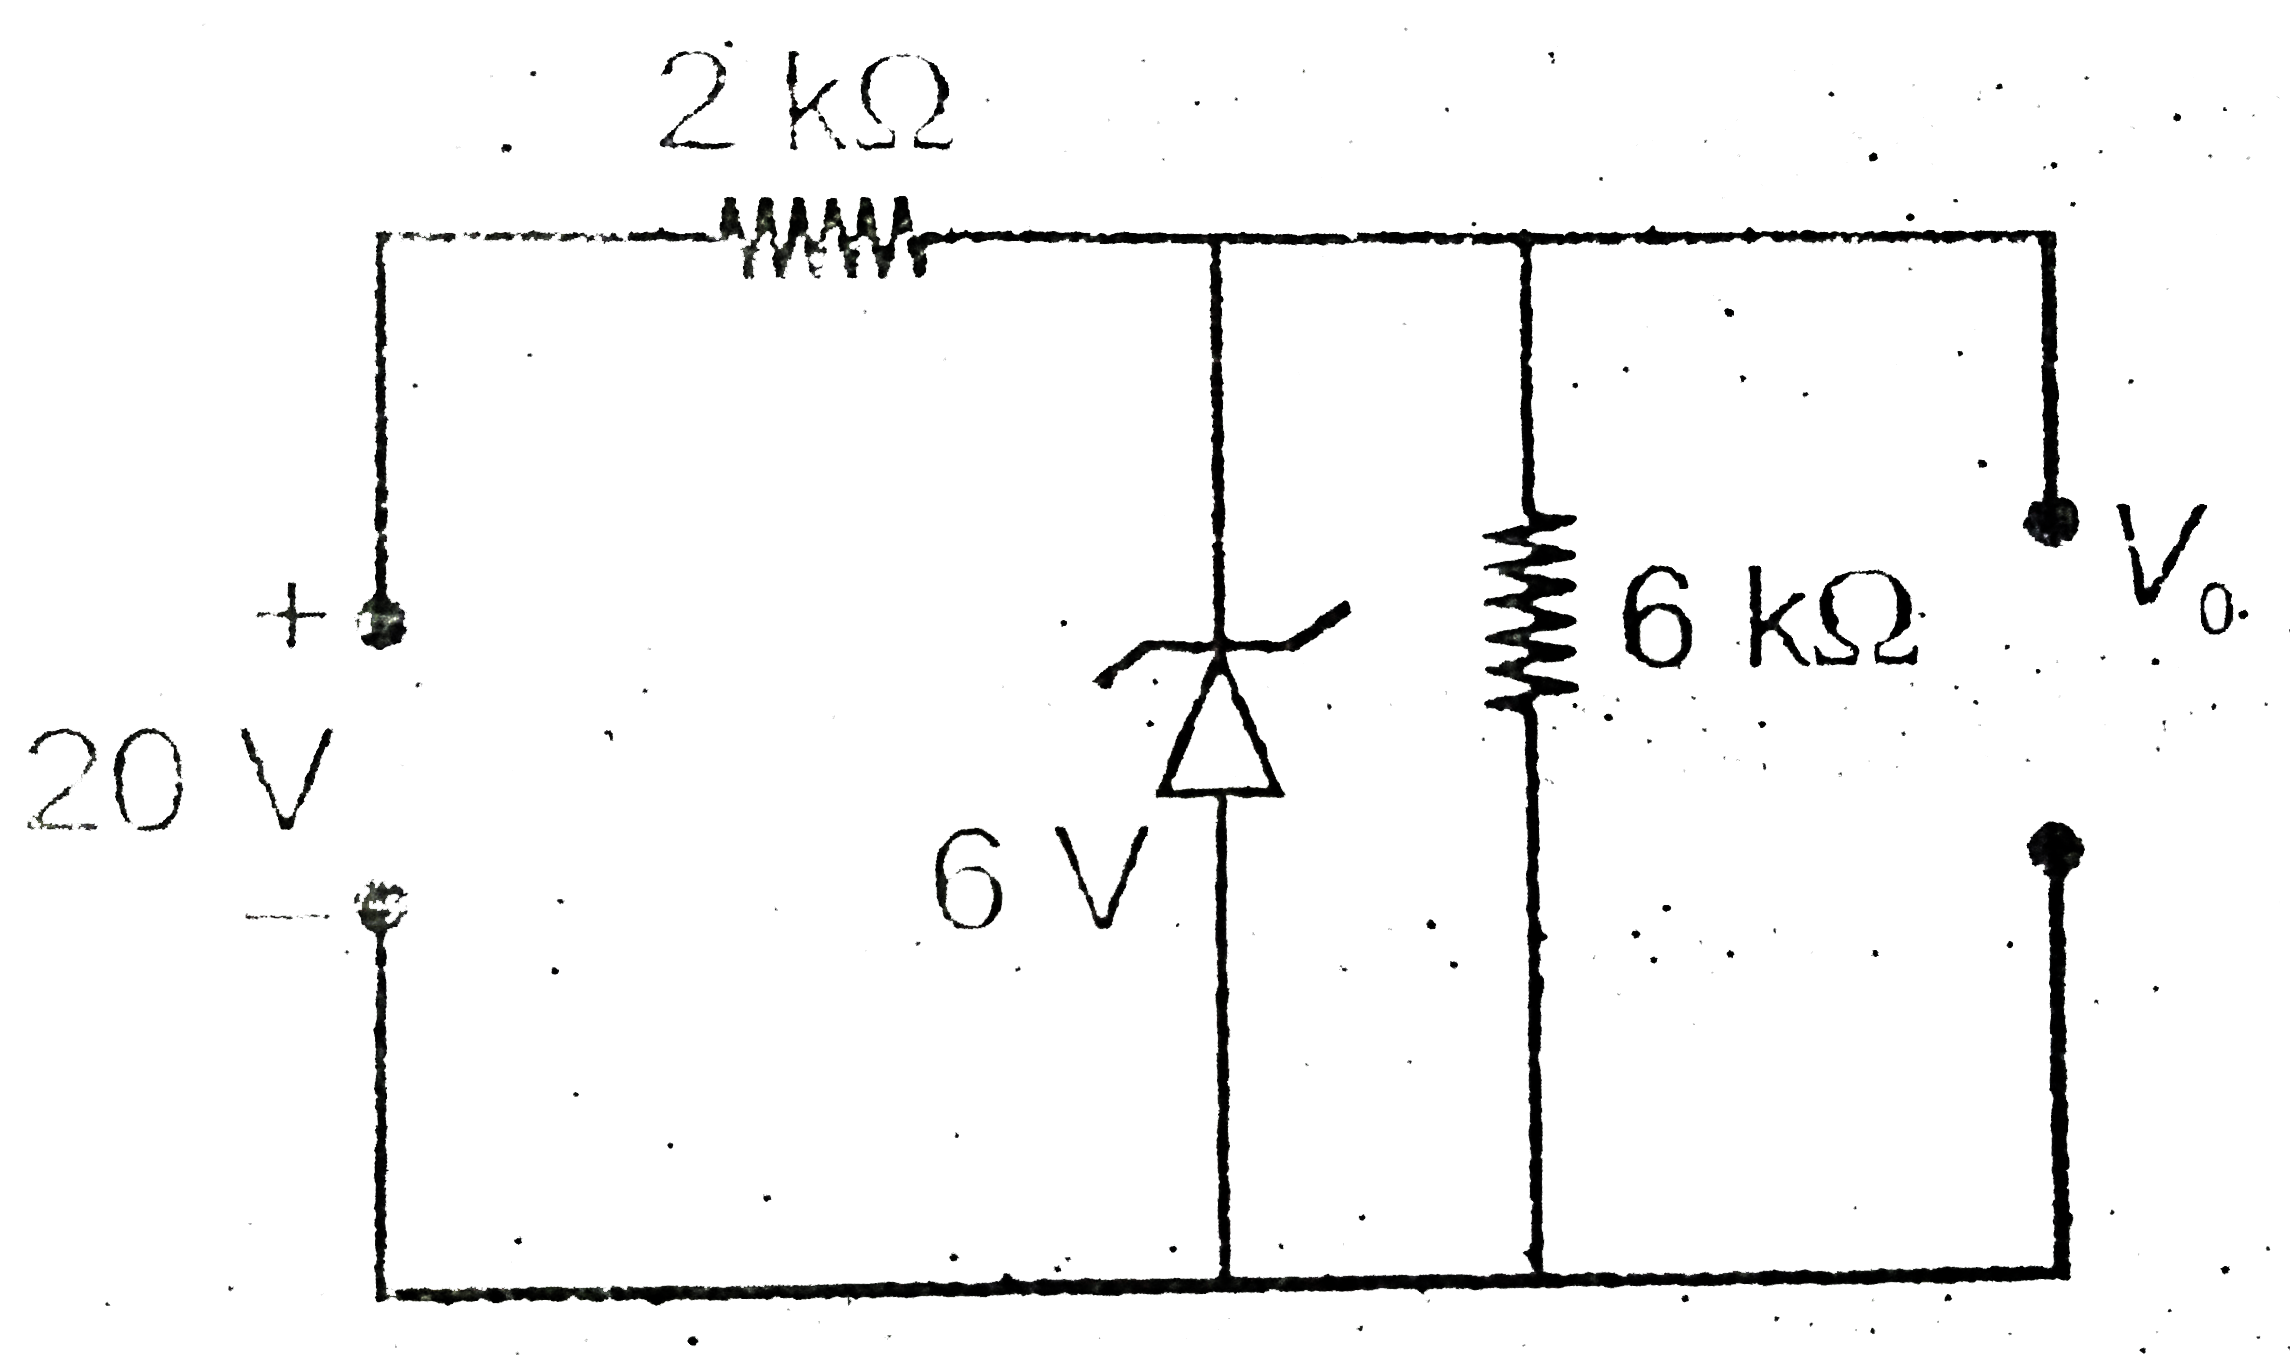
What is the value of output voltage V0 in the circuit shown in the figure ?
View SolutionAlternating voltage (V) is represented by the equation
whrere Vm is the peak voltage
View SolutionAlternating voltage (V) is represented by the equation
whrere Vm is the peak voltage
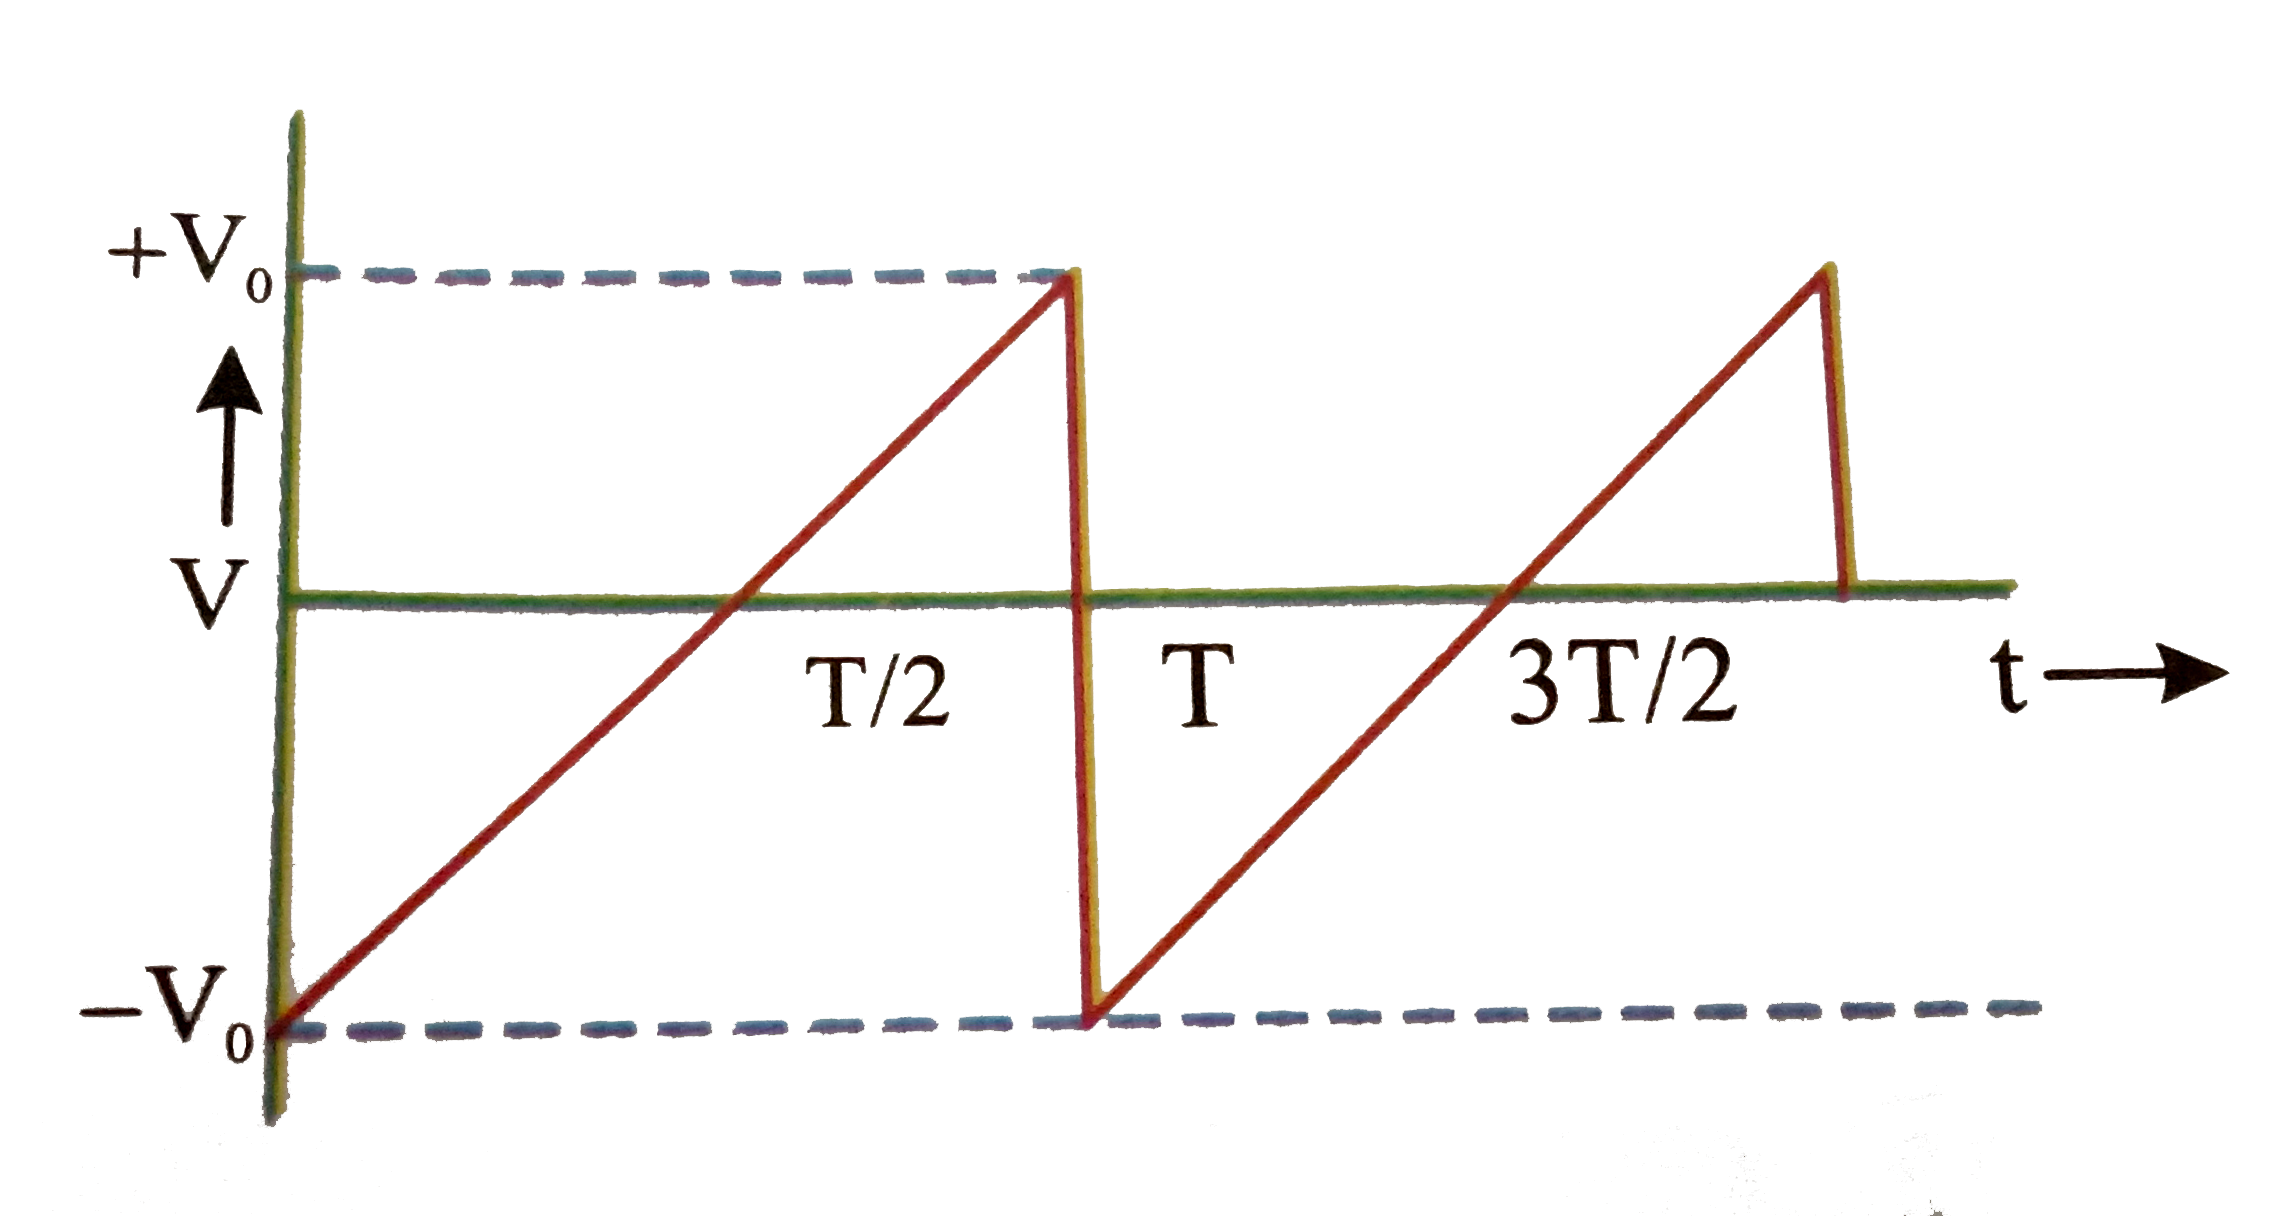
View SolutionThe average value for the saw-tooth voltage of peak value of V0 over half the cycle as shown in figure is
View SolutionAn alternating voltage is represented by
V=80sin(100πt)cos(100πt) volt,
What is the peak voltage?
View Solution

