From v−t graph shown in figure. We can draw the following conclusions
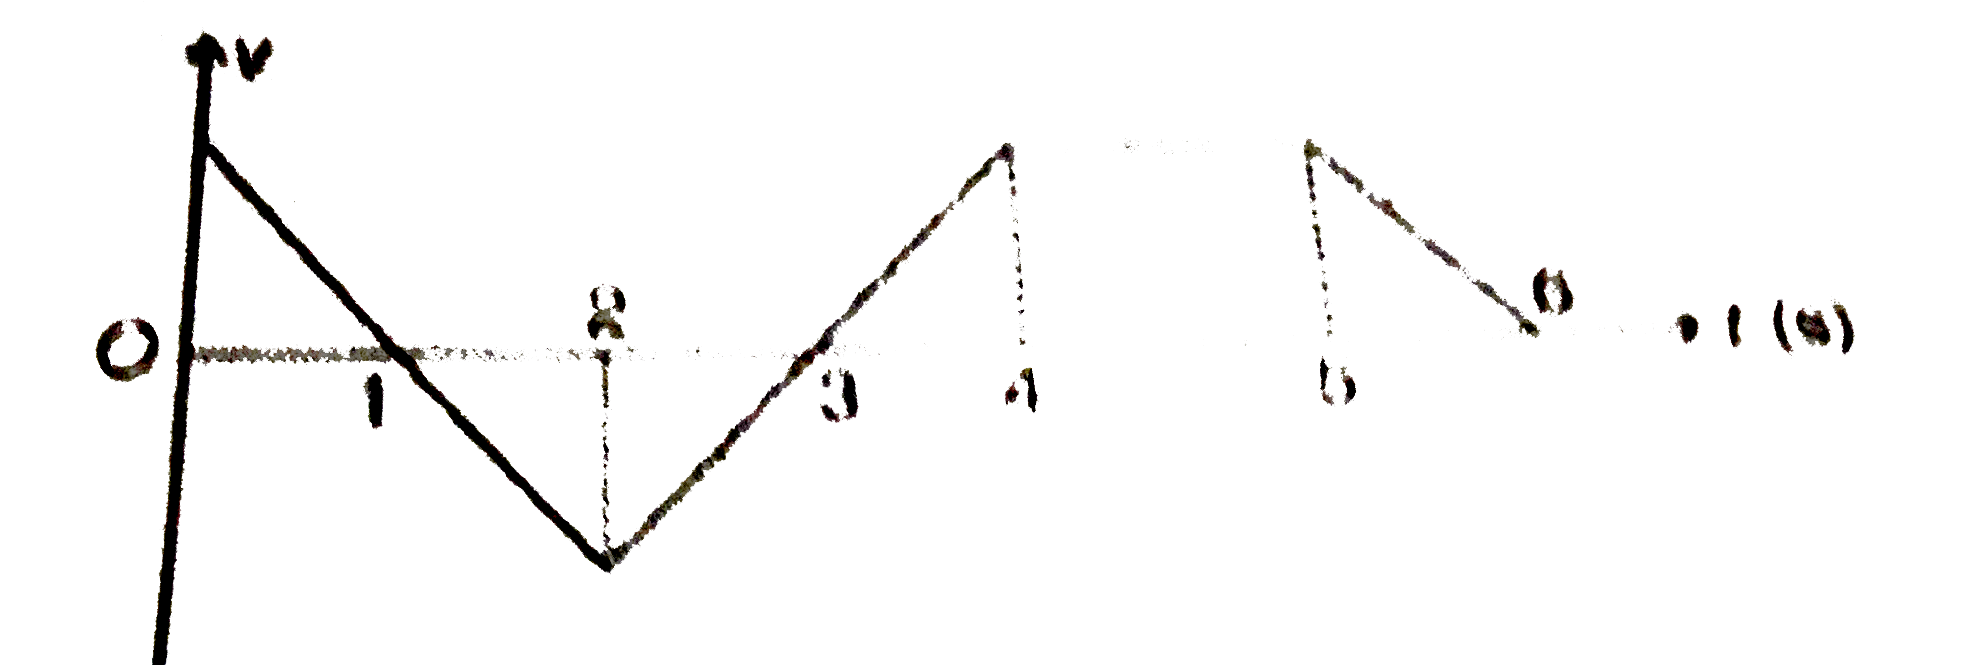
between t=1s to t=2s speed of particle is decreasing
between t=2s to t=3s speed of particle is increasing
between t=5s to t=6 acceleration of particle is negative
between t=0 to t=4s particle changes its directioin of motion twice
The correct Answer is:C, D
Step by step video, text & image solution for From v-t graph shown in figure. We can draw the following conclusions by Physics experts to help you in doubts & scoring excellent marks in Class 11 exams.
Topper's Solved these Questions
- BOOK - DC PANDEYCHAPTER - KINEMATICS 1EXERCISE - COMPREHENSION_TYPE19videos
KINEMATICS 1
- BOOK - DC PANDEYCHAPTER - KINEMATICS 1EXERCISE - MATCH THE COLUMN10videos
KINEMATICS 1
- BOOK - DC PANDEYCHAPTER - KINEMATICS 1EXERCISE - INTEGER_TYPE15videos
KINEMATICS 1
- BOOK - DC PANDEYCHAPTER - KINEMATICSEXERCISE - INTEGER_TYPE11videos
KINEMATICS
- BOOK - DC PANDEYCHAPTER - LAWS OF MOTIONEXERCISE - Medical entrances gallery39videos
LAWS OF MOTION
Similar Questions
Knowledge Check
- Question 1 - Select One
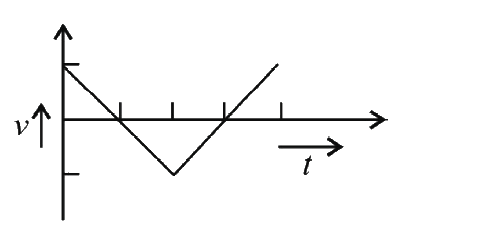
The graph in figure shows the velocity v versus time t for a body. Which of the graphs shown in figure represents the corresponding acceleration versus time graphs ?
 A
A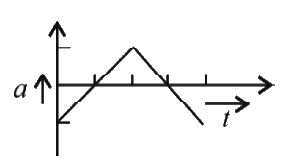 B
B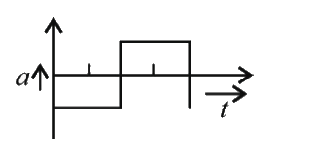 C
C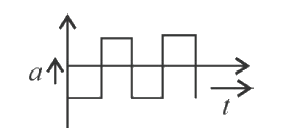 D
D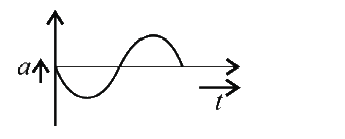
- Question 2 - Select One
The acceleration (a)-time(t) graph for a particle moving along a straight from rest is shown in figur. Which of the following graph is the best representation of its velocity (v) with time (t) ?
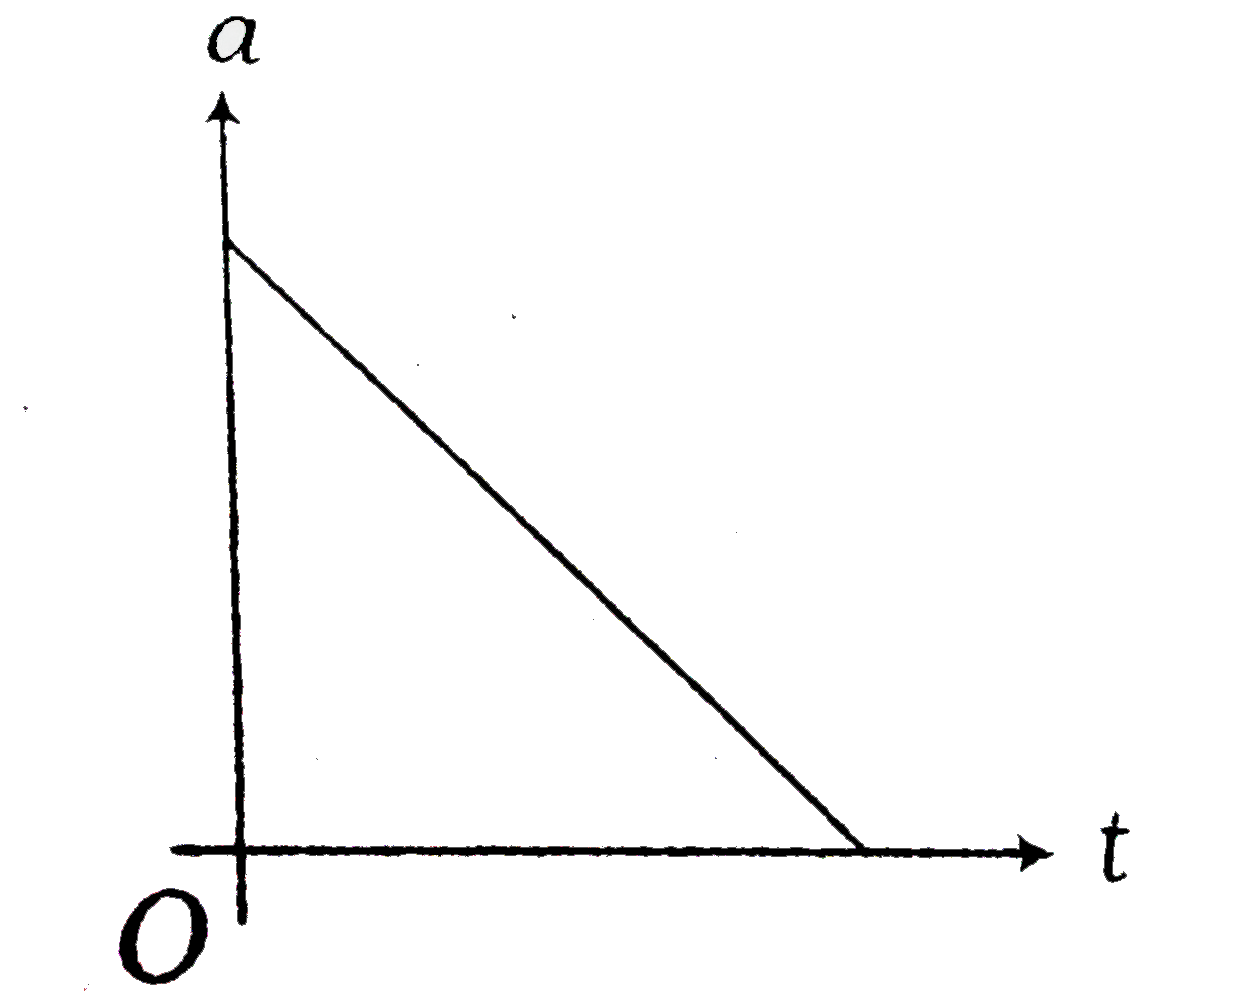 A
A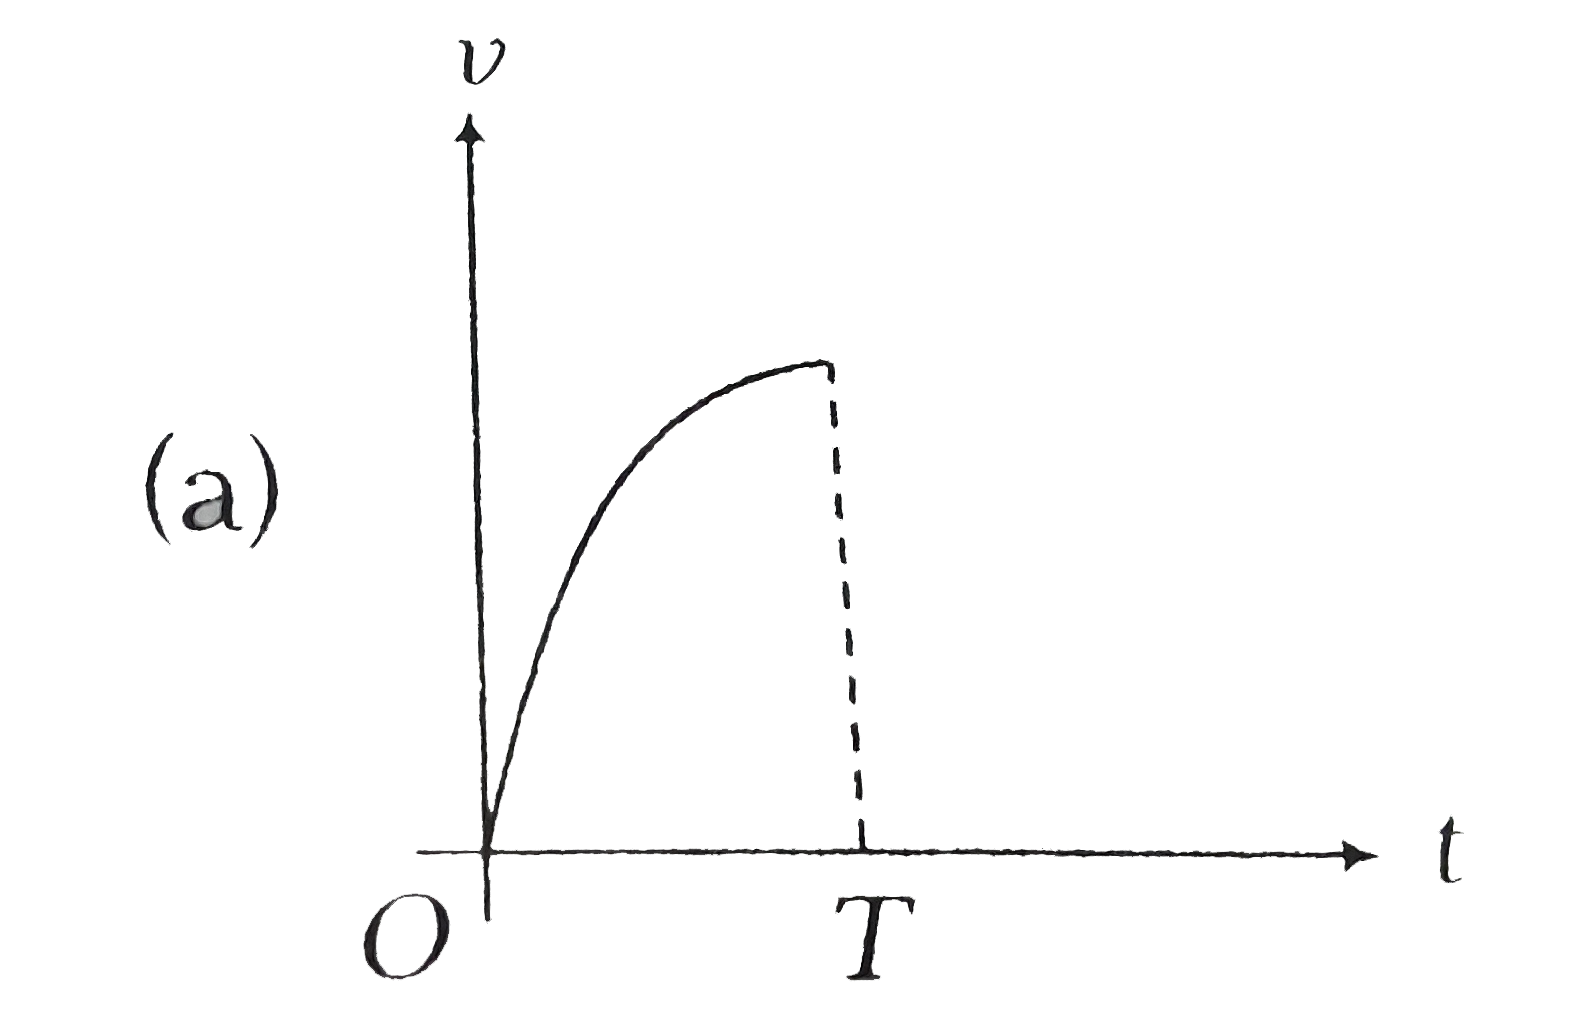 B
B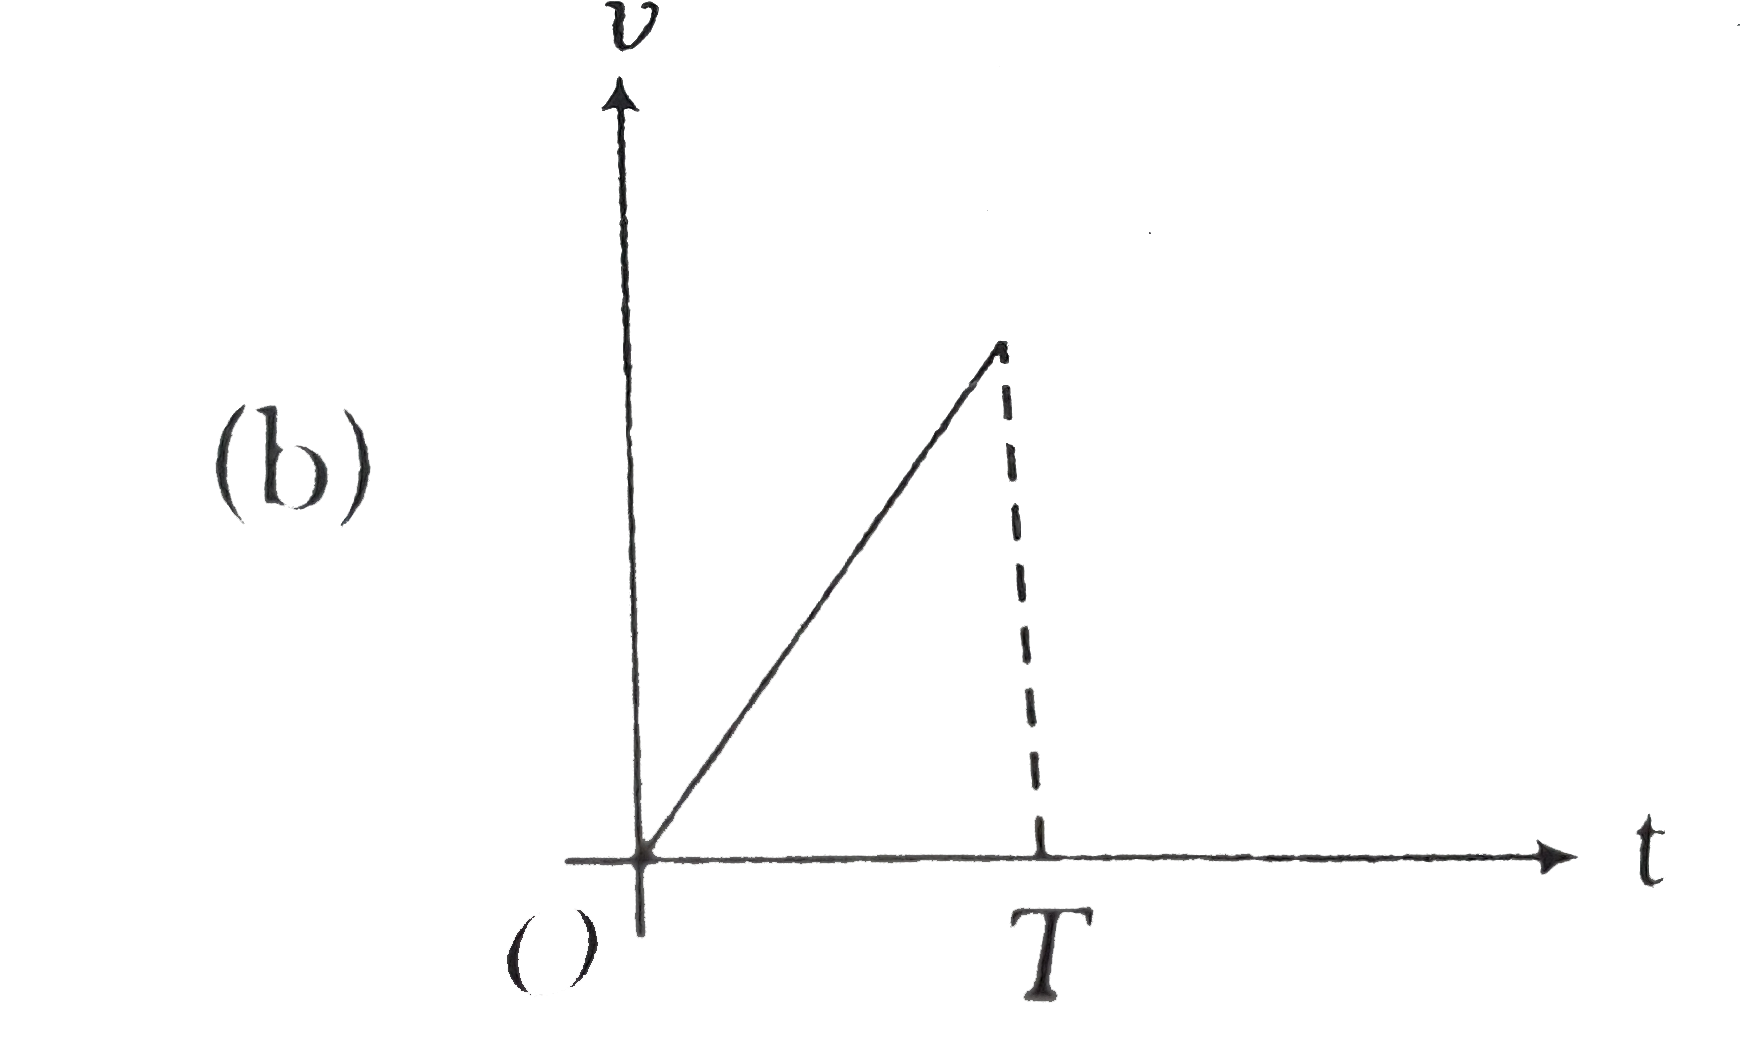 C
C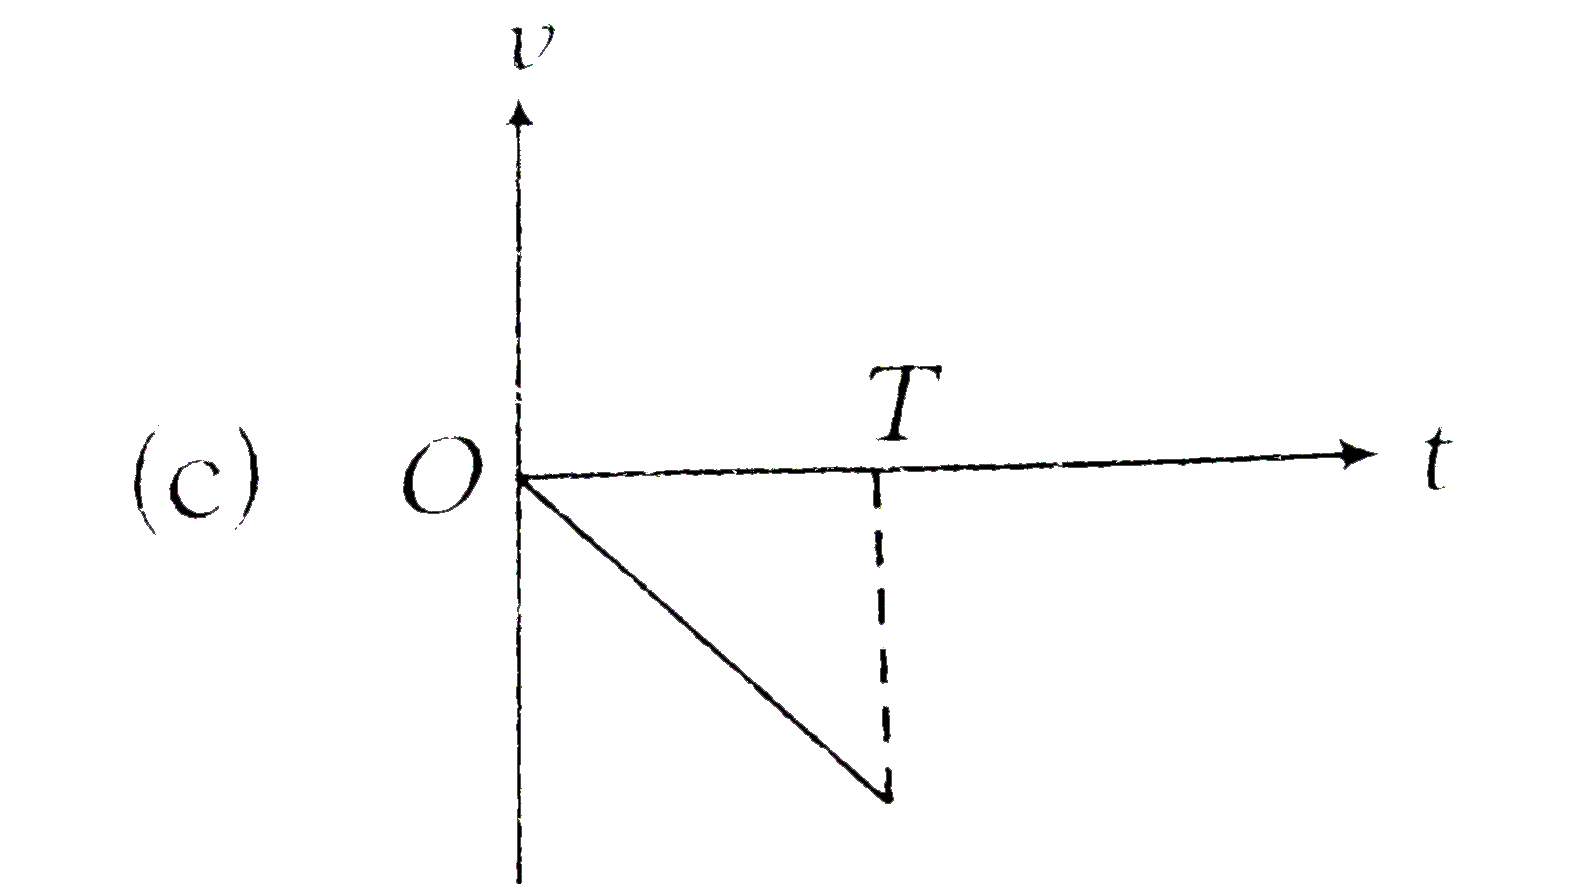 D
D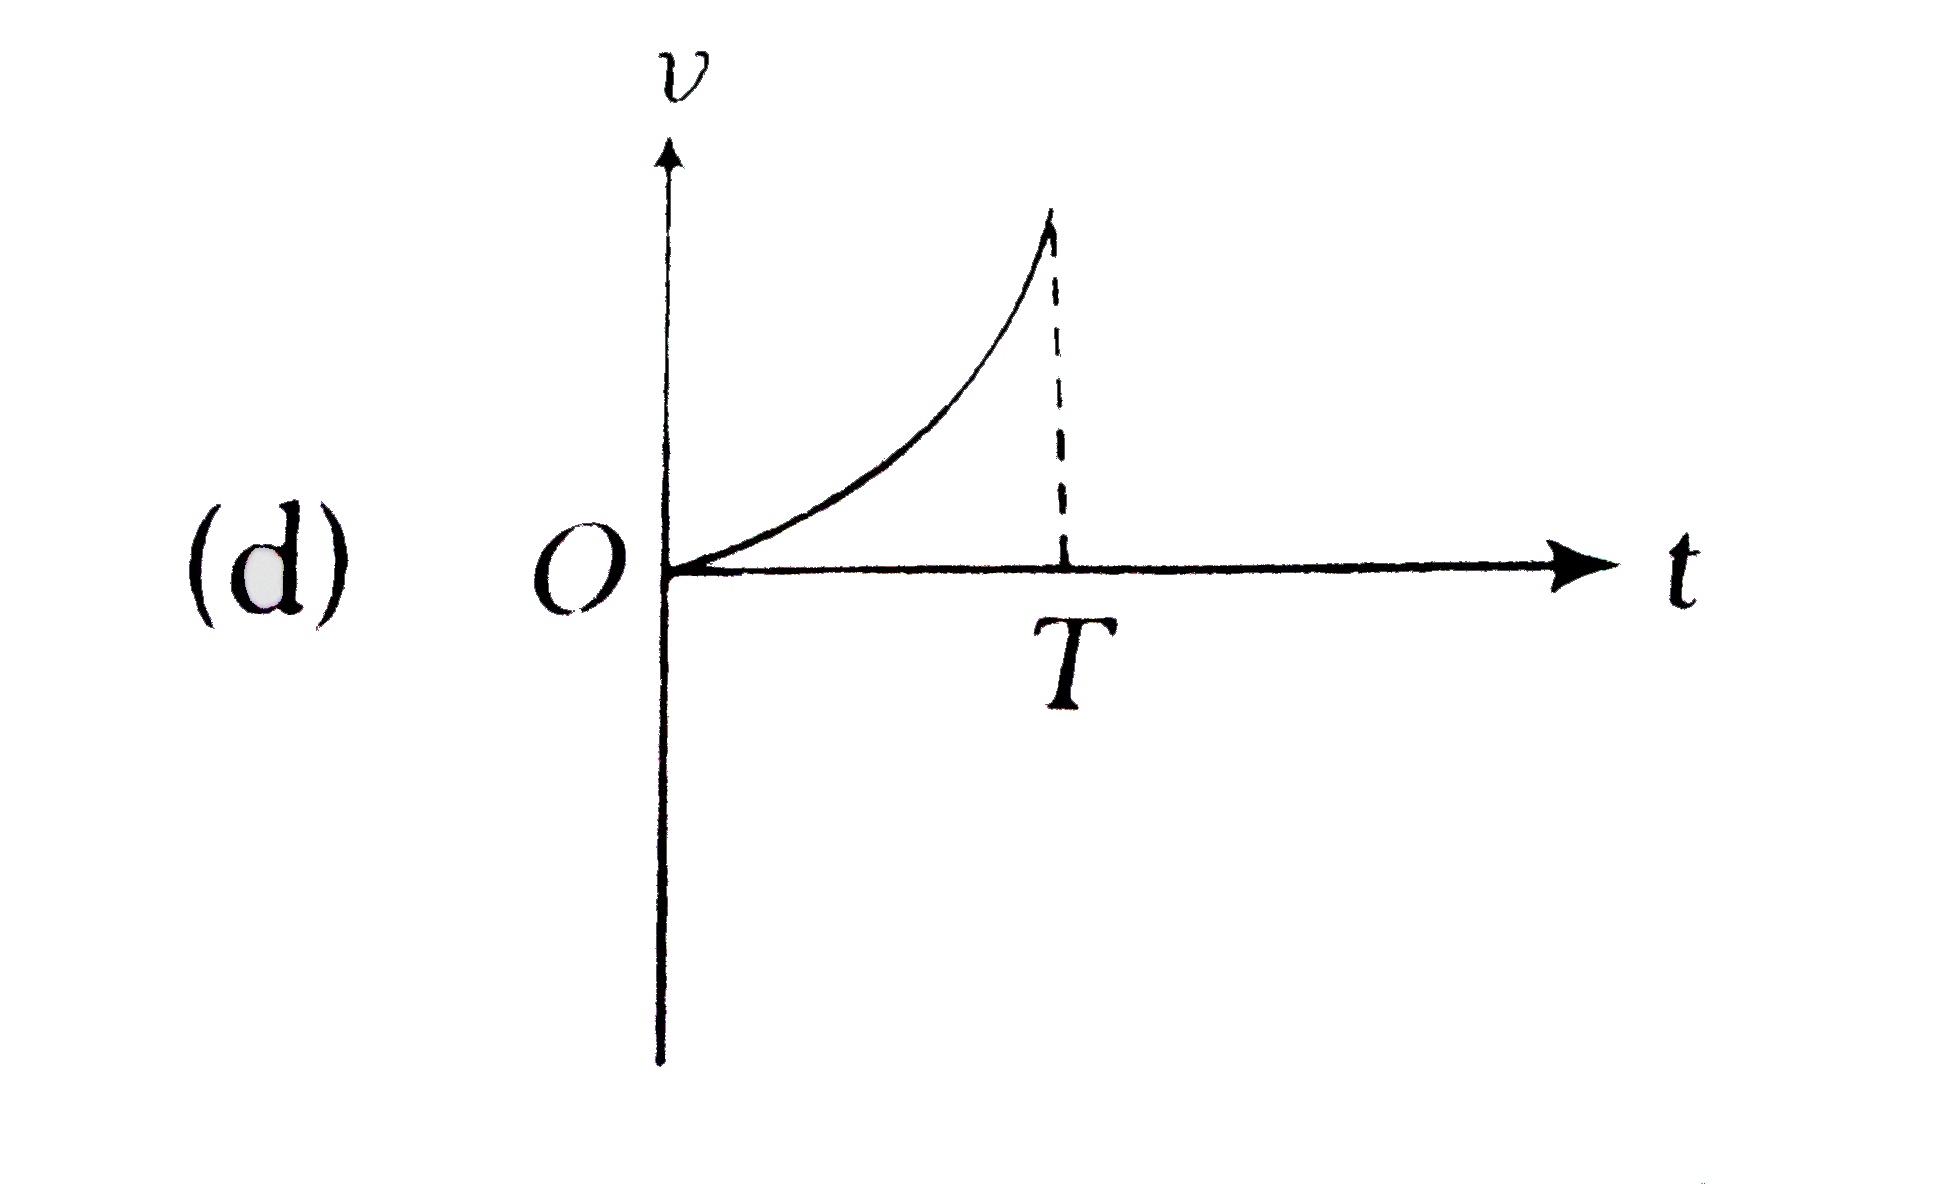
- Question 3 - Select One
For the acceleration - time (a - t) graph shown in figure, the change in velocity of particle from t = 0 to t = 6 s is
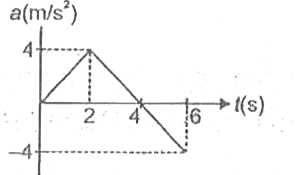 A10 m/sB4 m/sC12 m/sD8 m/s
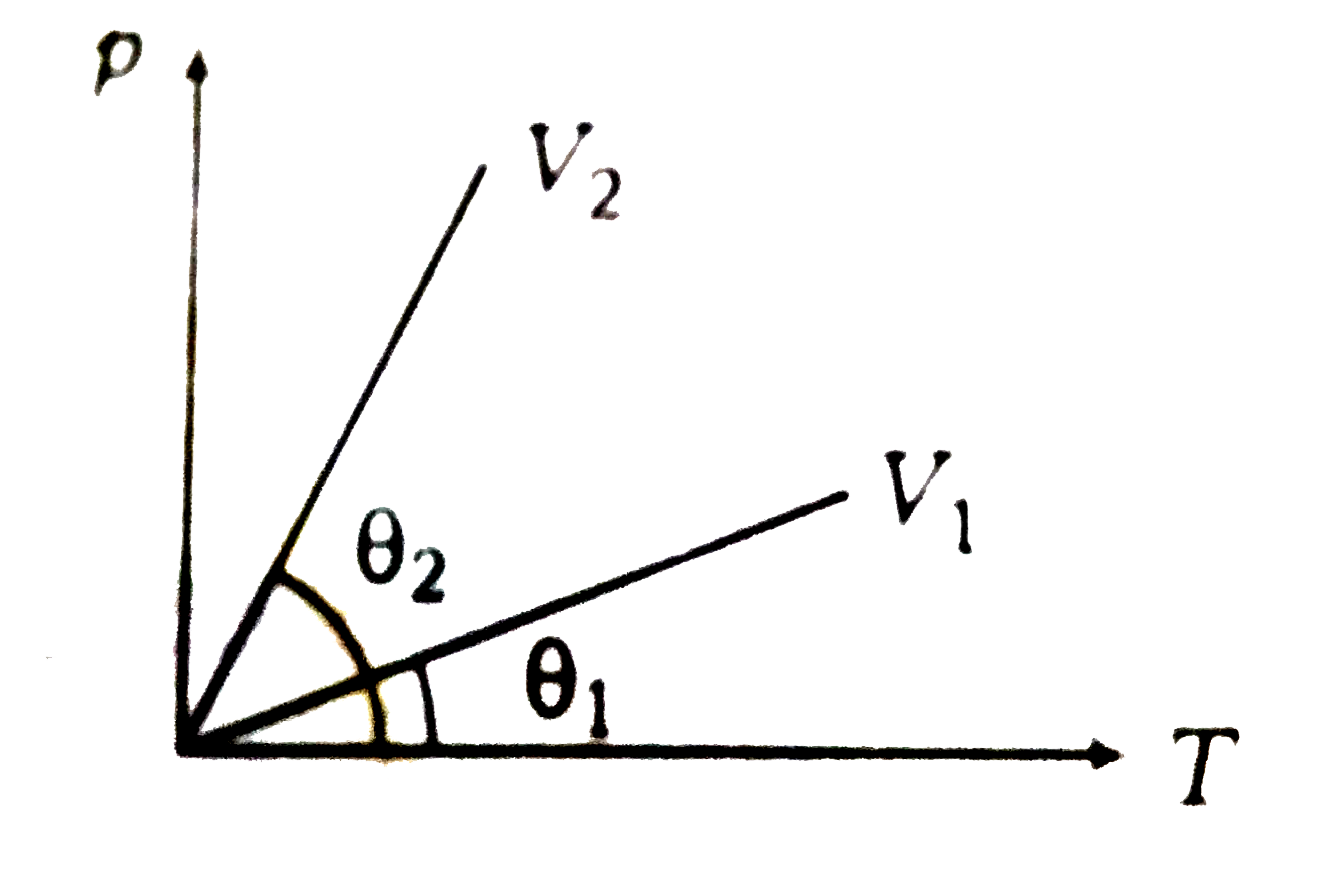
In the ρ-T graph shown in figure, match the following.
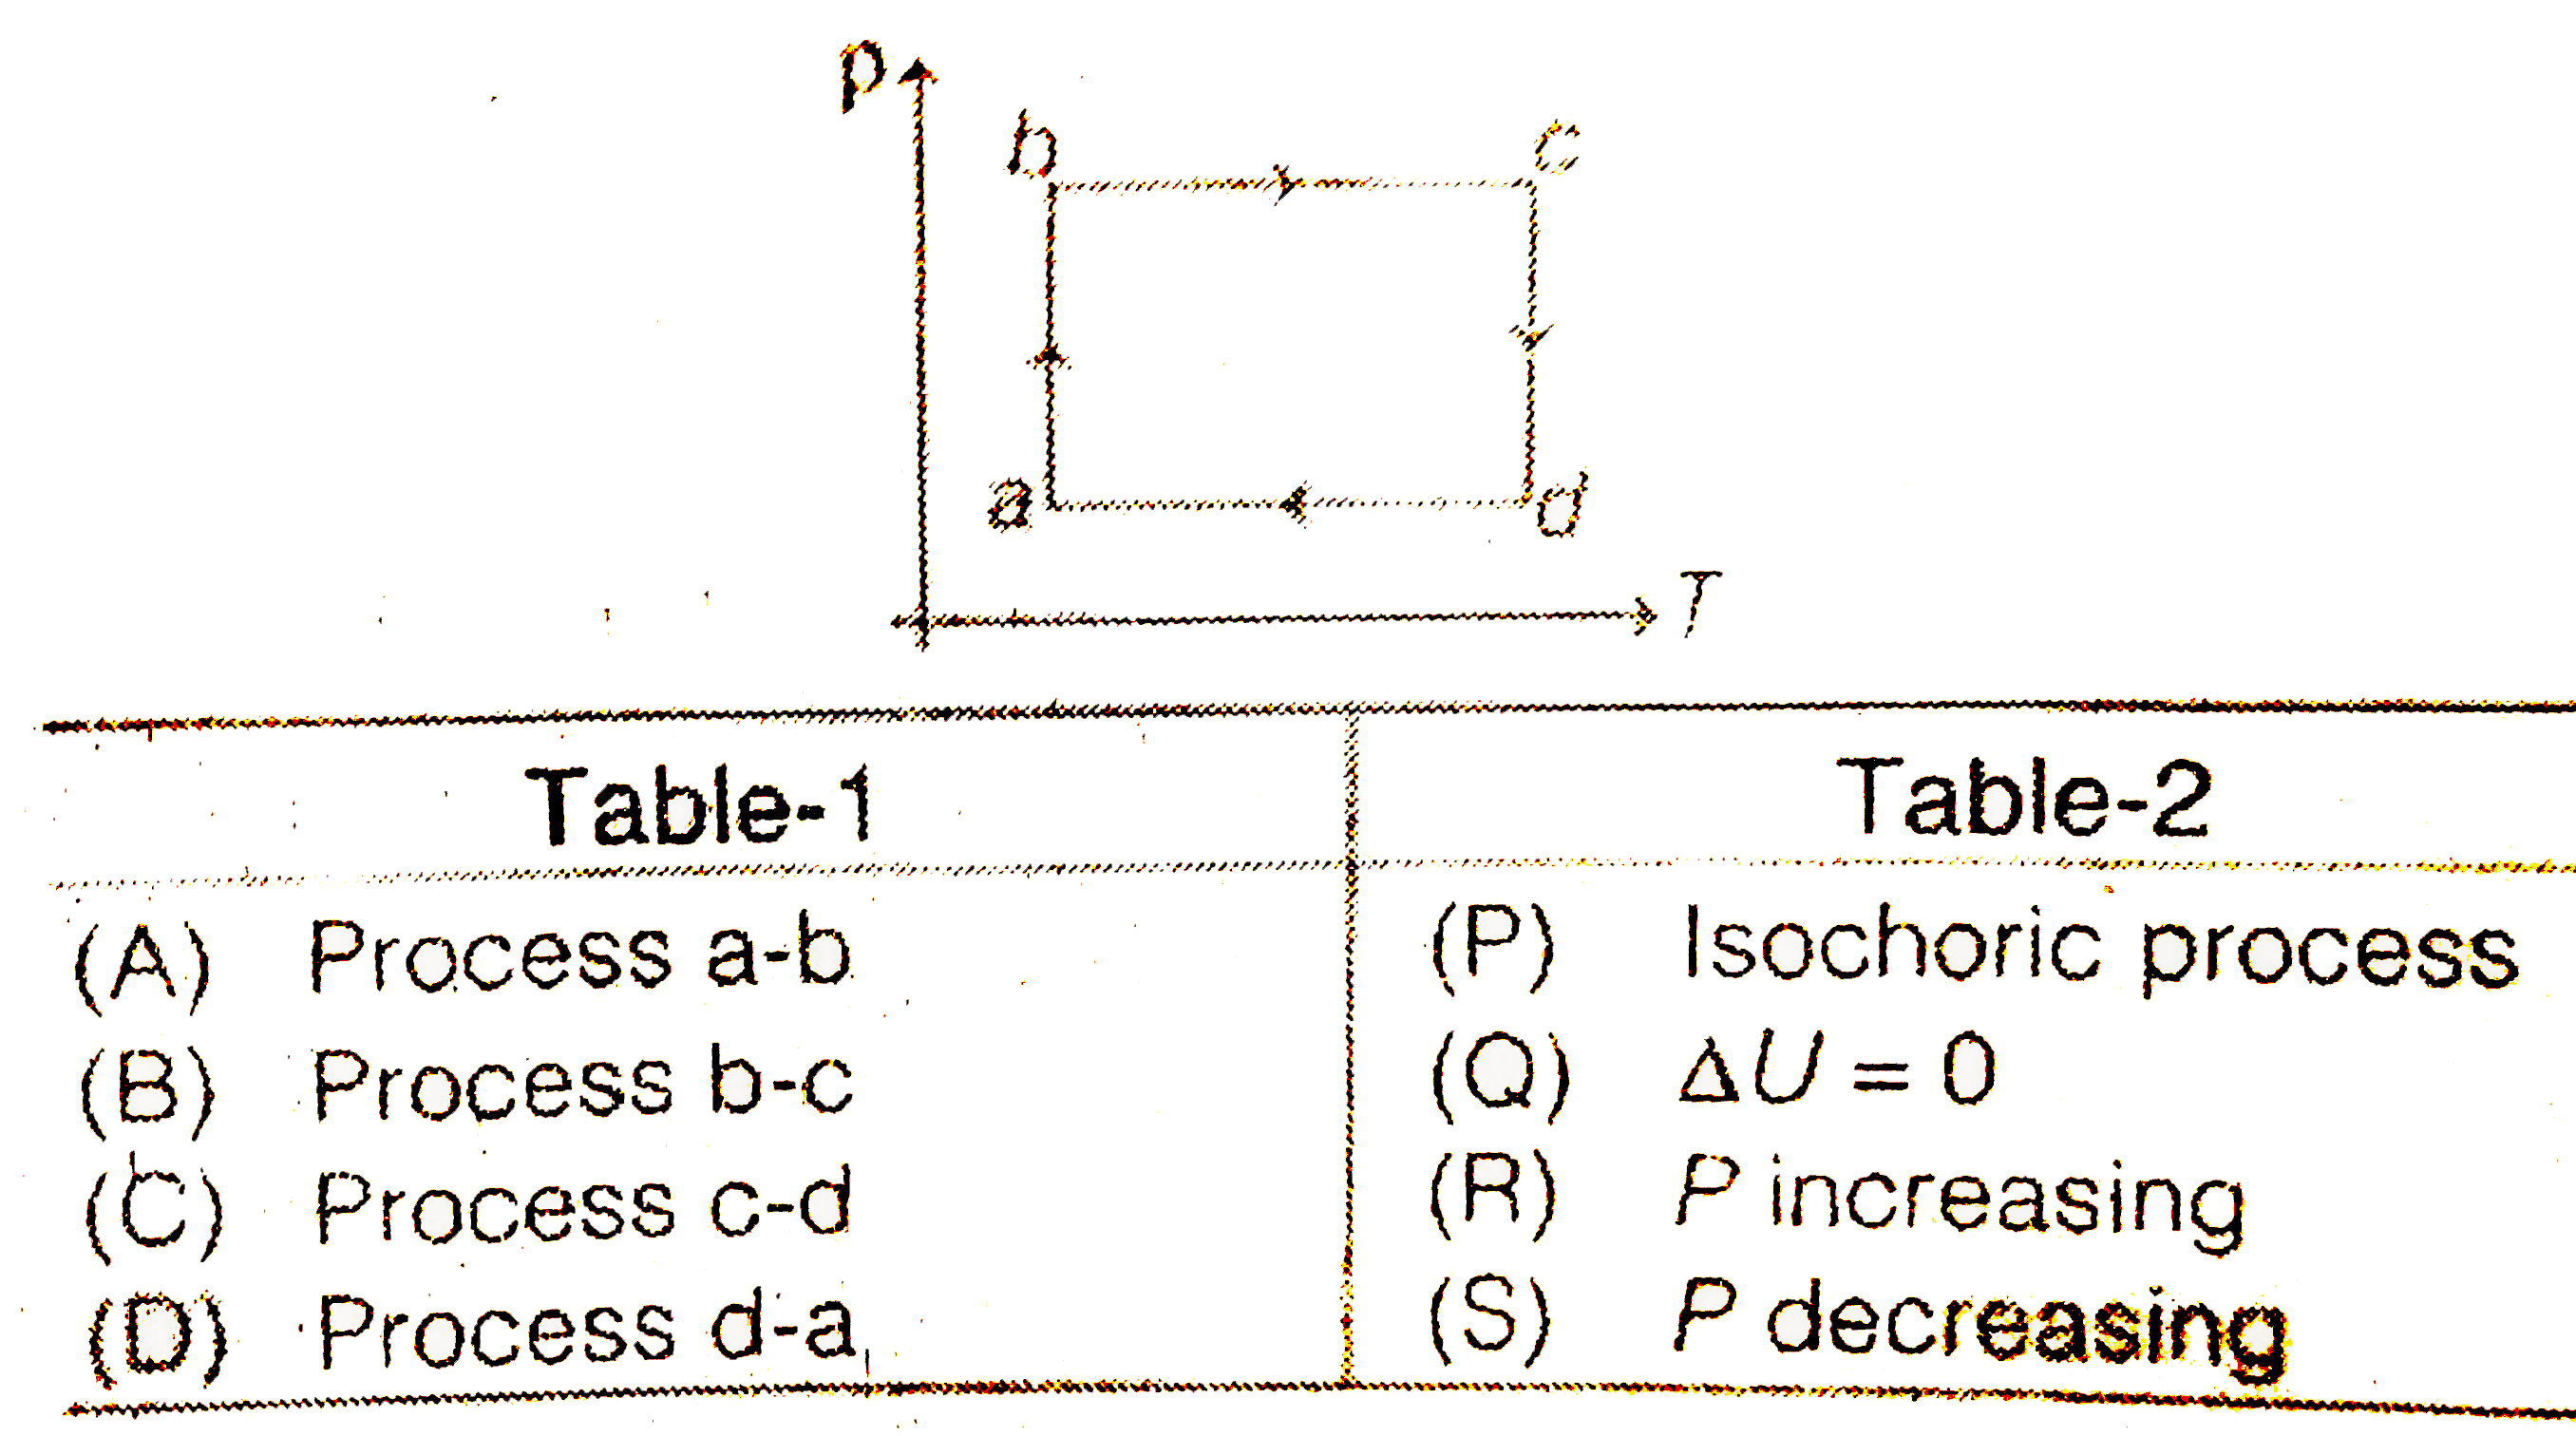 View Solution
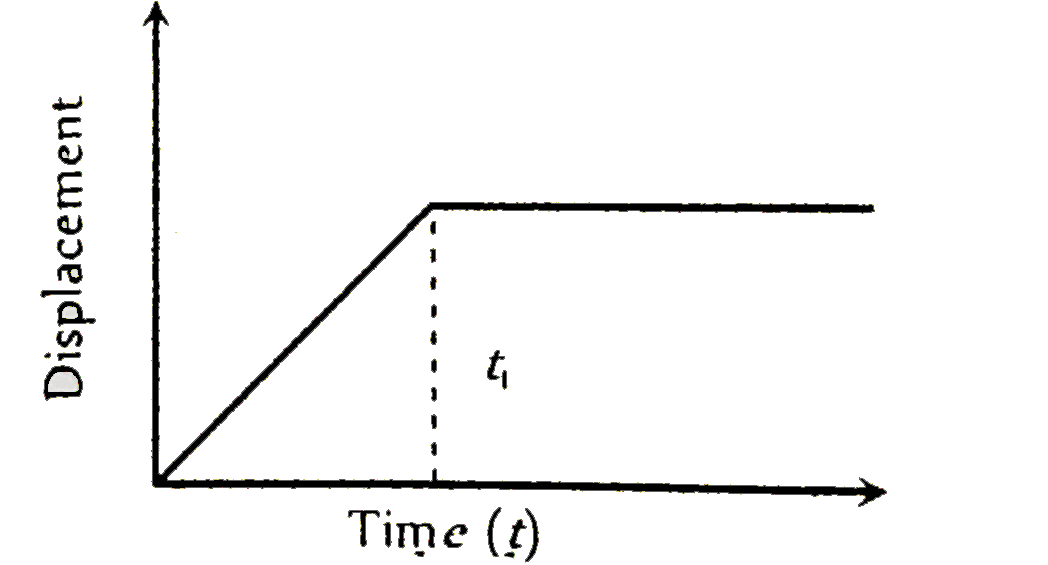
The x -t graph shown in figure represents
 View Solution
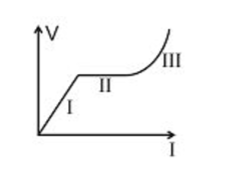
Voltage V v/s I graph is shown in the figure.
 View Solution
Which of the velocity-time (v - 1) graphs shown in figure can possibly represent one-dimensional motion of a particle? (A) (B)
View SolutionFrom the p-T graph want conclusion can be drawn?
 View Solution


