U.r graph of a particle performing SHM is as shown in figure. What conclusion cannot be drawn from the graph?
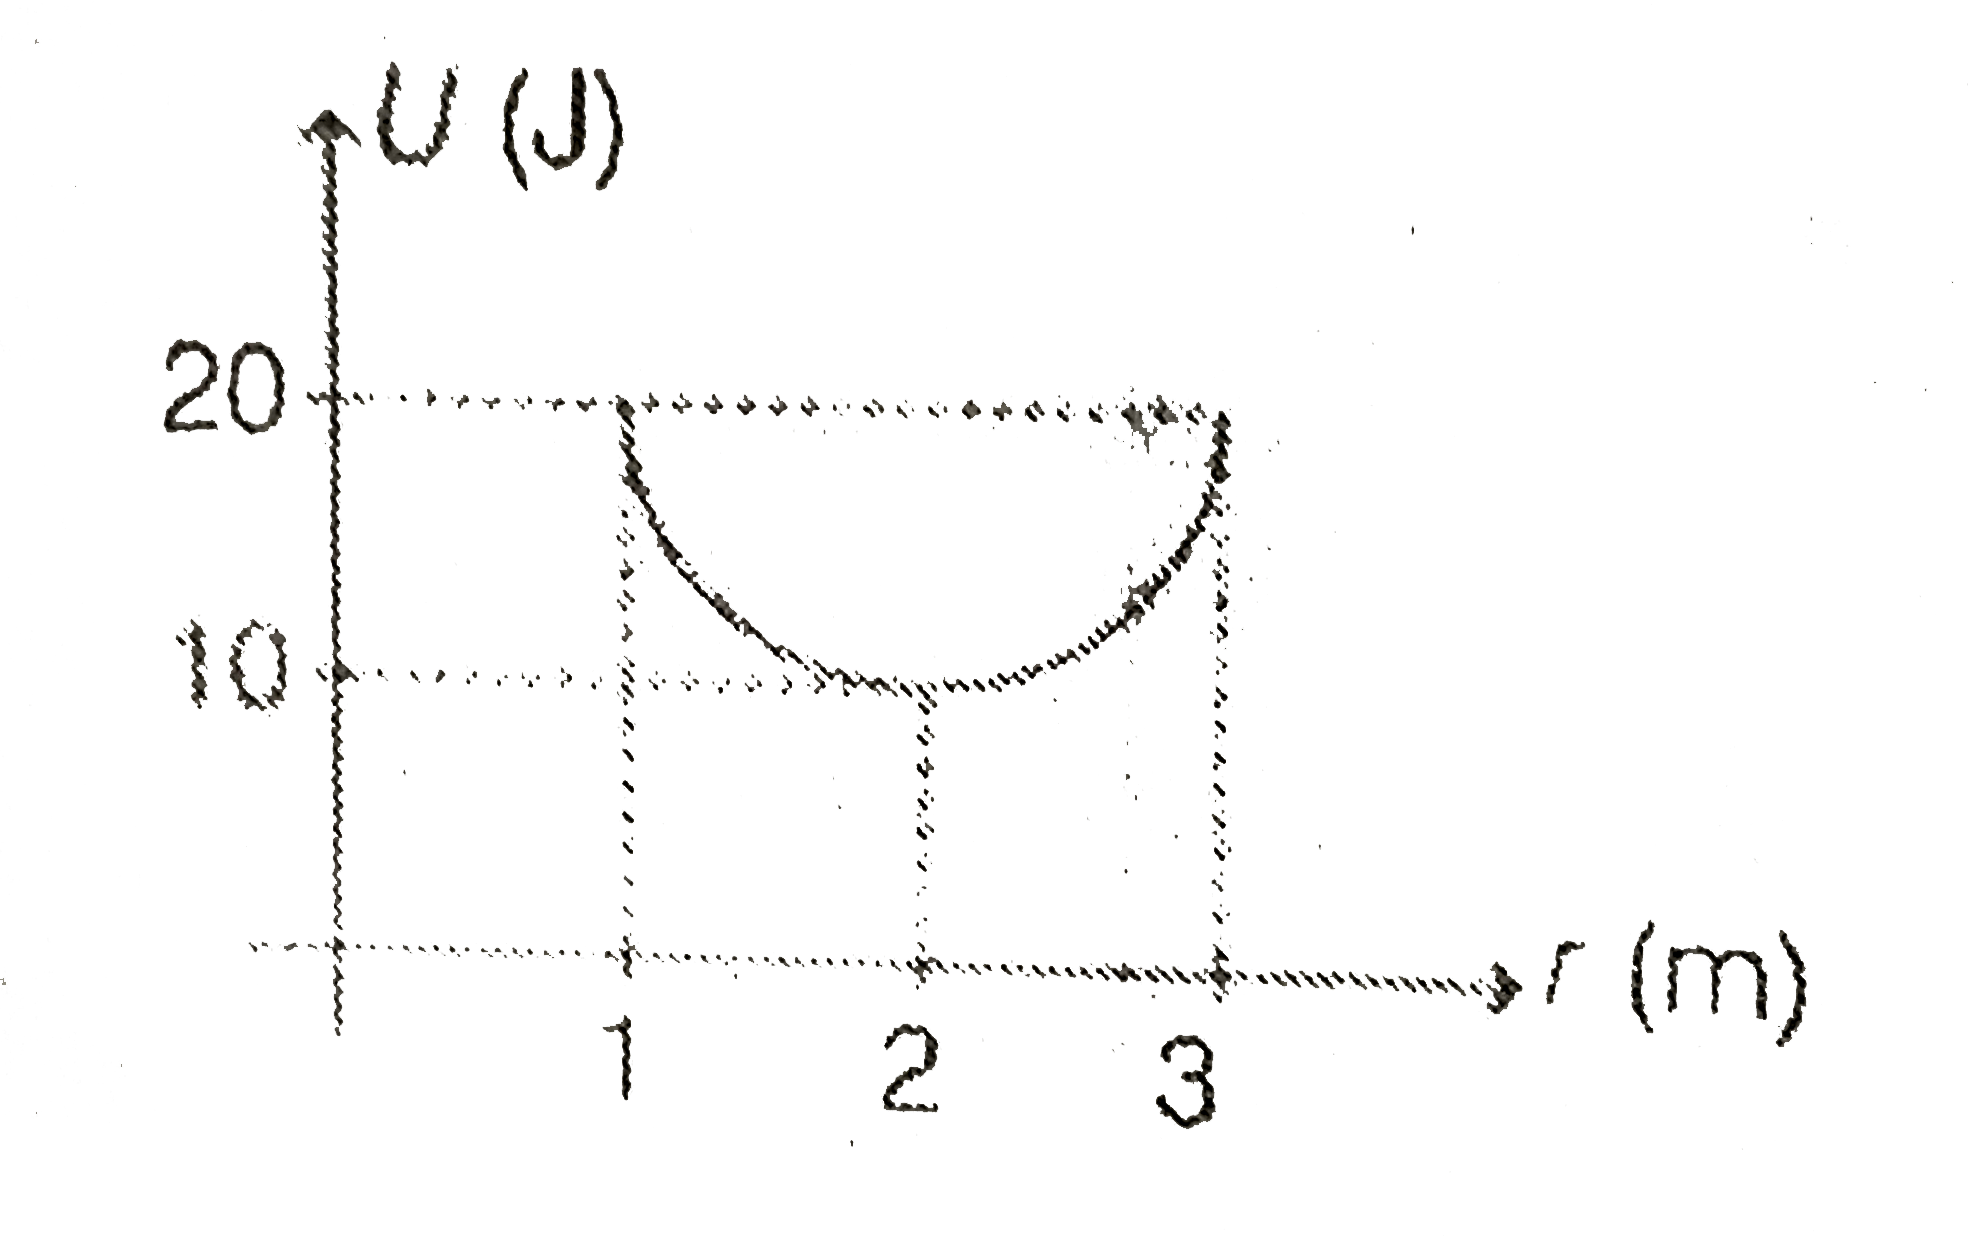
Mean position of the particle is at r=2m
Potential energy of the particle at mean position is 10 J
Amplitude of oscillation is 1m
None of the above.
The correct Answer is:C
Step by step video, text & image solution for U.r graph of a particle performing SHM is as shown in figure. What conclusion cannot be drawn from the graph? by Physics experts to help you in doubts & scoring excellent marks in Class 11 exams.
Updated on:21/07/2023Topper's Solved these Questions
- SIMPLE HARMONIC MOTIONBOOK - DC PANDEYCHAPTER - SIMPLE HARMONIC MOTIONEXERCISE - More than one option is correct
50 Videos
- SIMPLE HARMONIC MOTIONBOOK - DC PANDEYCHAPTER - SIMPLE HARMONIC MOTIONEXERCISE - Comprehension types
18 Videos
- SIMPLE HARMONIC MOTIONBOOK - DC PANDEYCHAPTER - SIMPLE HARMONIC MOTIONEXERCISE - Only one question is correct
48 Videos
- SEMICONDUCTORS AND ELECTRONIC DEVICESBOOK - DC PANDEYCHAPTER - SEMICONDUCTORS AND ELECTRONIC DEVICESEXERCISE - More than One Option is Correct
3 Videos
- SOLVD PAPERS 2017 NEET, AIIMS & JIPMERBOOK - DC PANDEYCHAPTER - SOLVD PAPERS 2017 NEET, AIIMS & JIPMEREXERCISE - Solved paper 2018(JIPMER)
38 Videos
Similar Questions
Knowledge Check
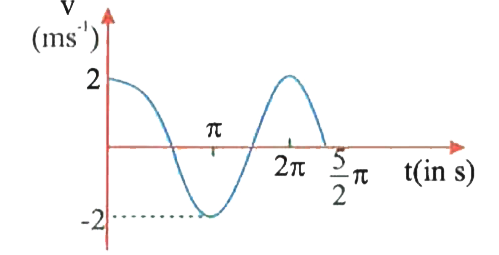
v−t graph of a particle in SHM is as shown is figure. Choose the wrong option.
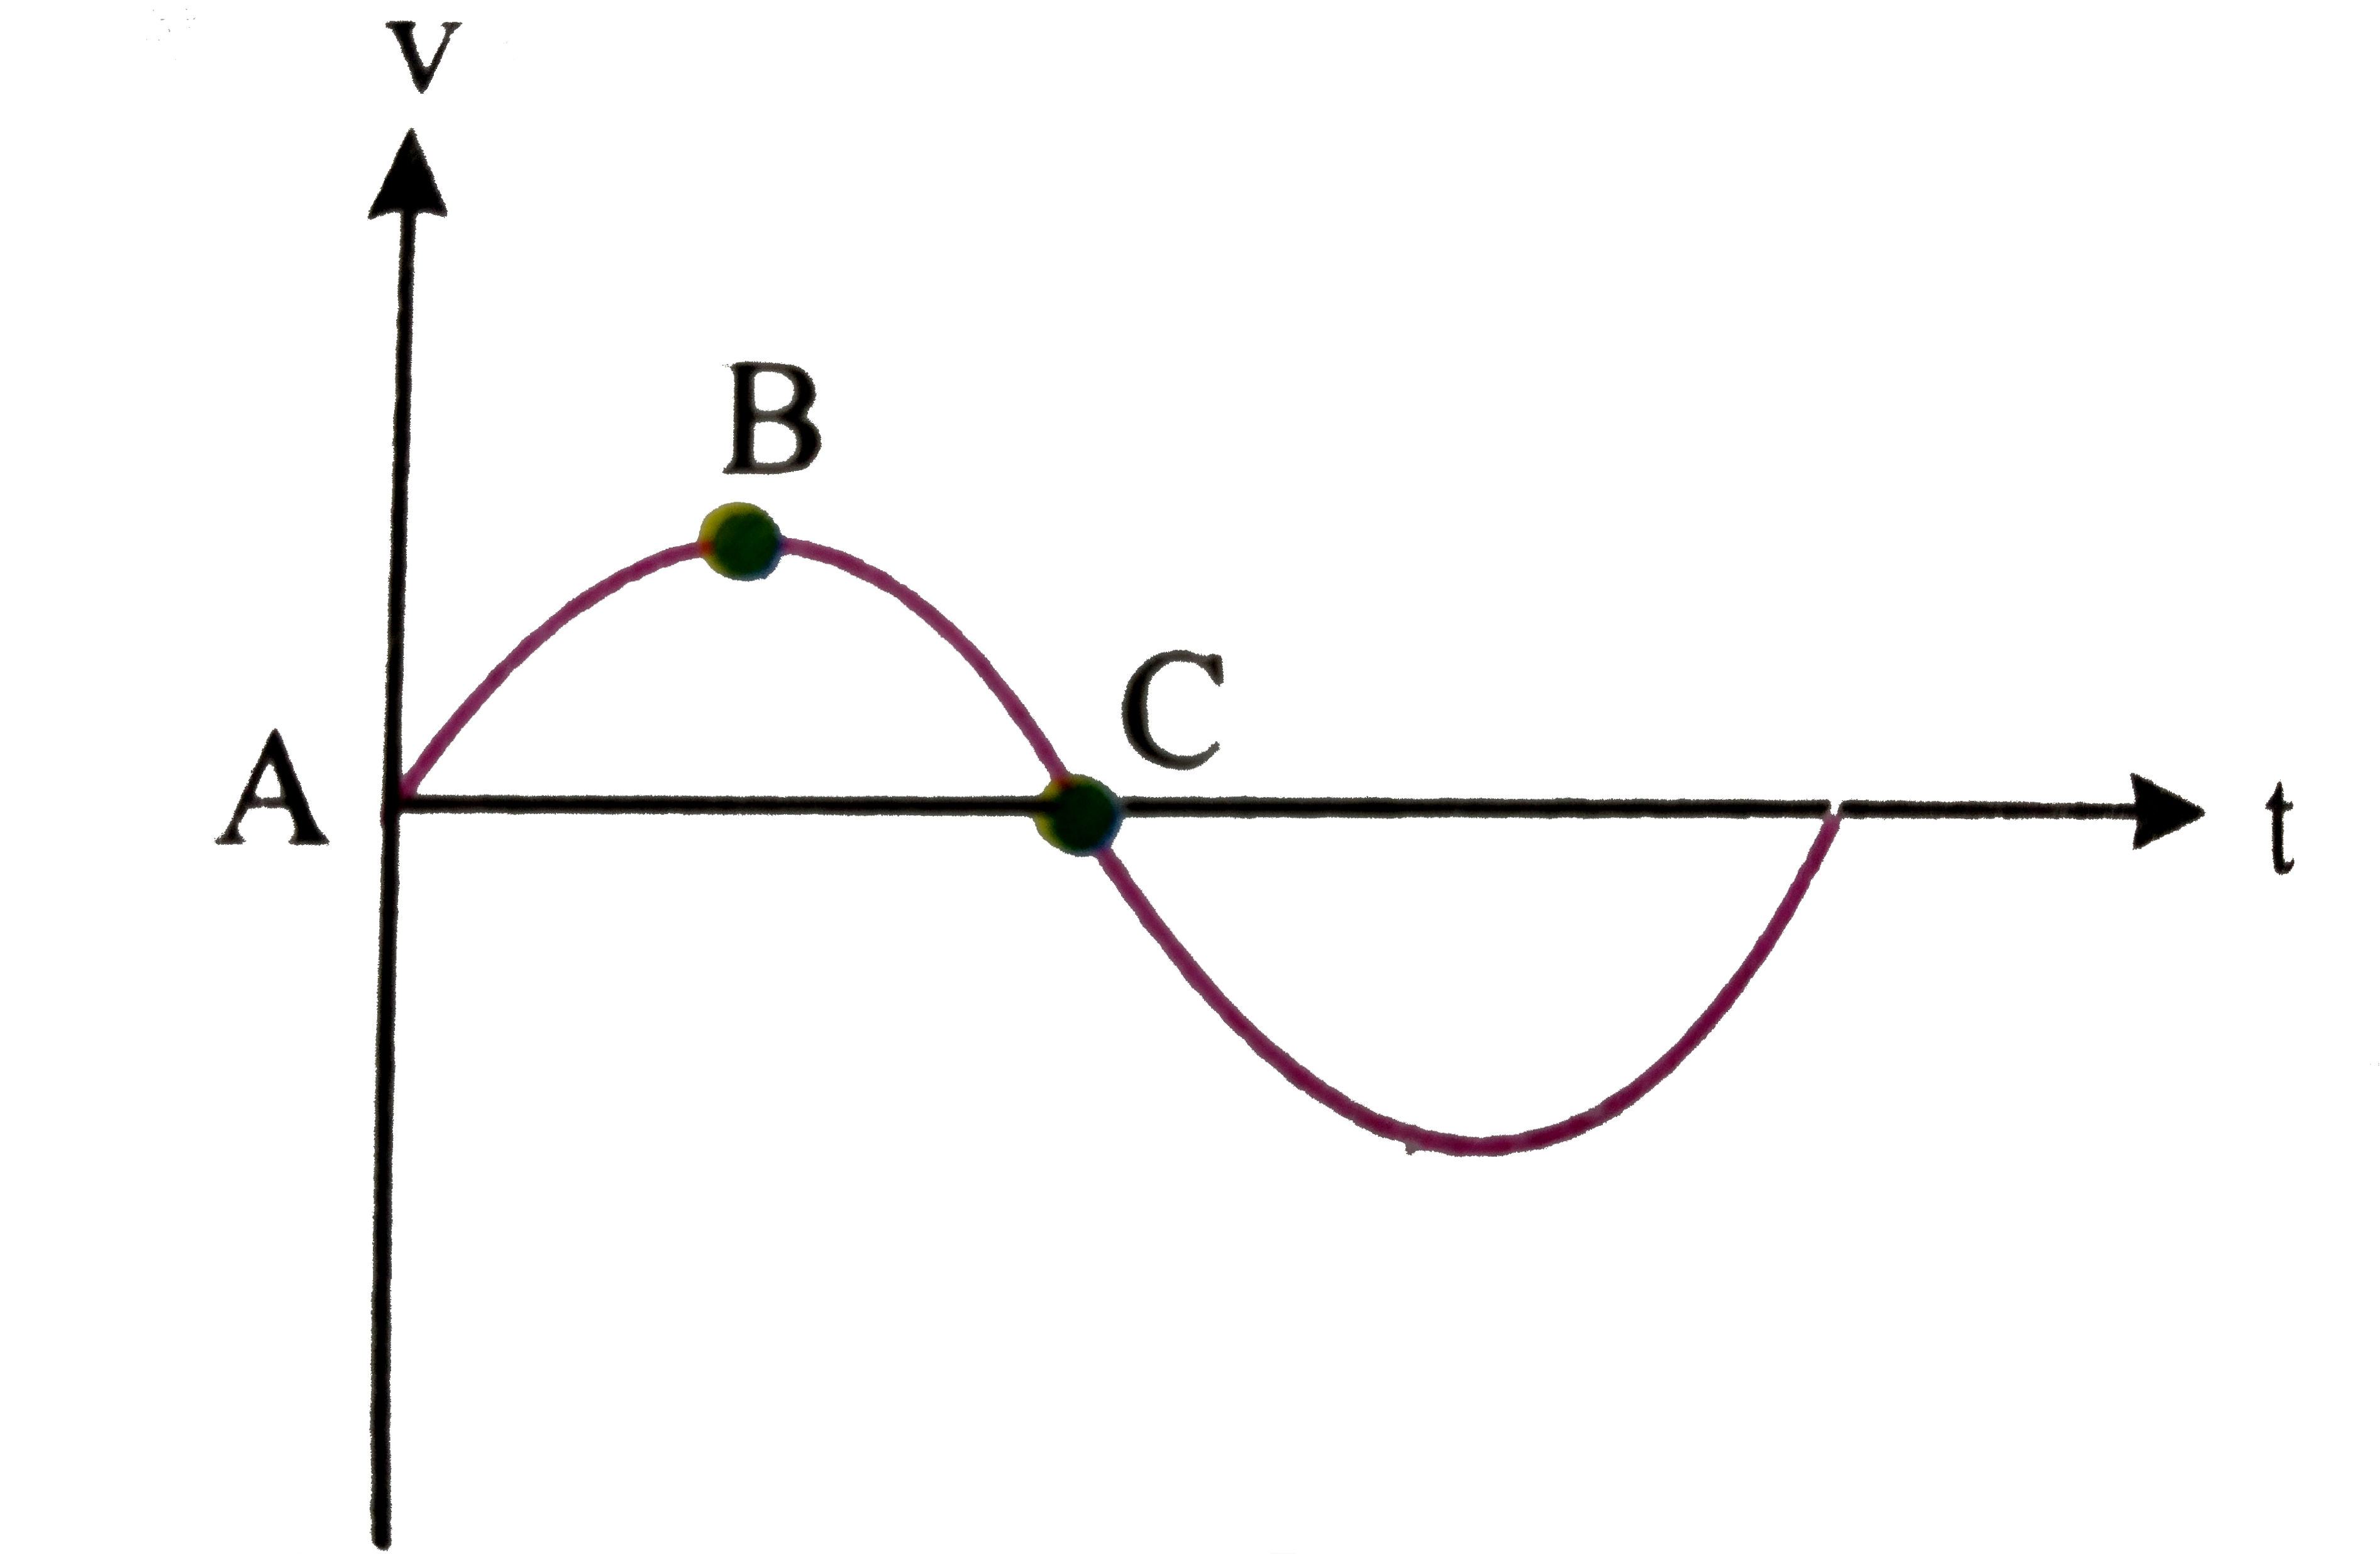 Aat A particle is at mean position and moving towards position directionBat Bacceleration of particle is zeroCat C acceleration of particle is maximum and in position directionDnone of the above
The x-t graph of a particle undergoing SHM is as shown in figure. The acceleration of the particle at t=2/3 is
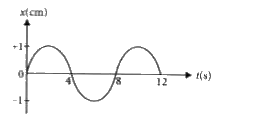 A√332π2cms−2B−π232cms−2Cπ232cms−2D−√332π2cms−2
The velocity − time graph of a particle is as shown in figure
 AIt moves with a constant acceleration throughoutBIt moves with an acceleration of constant magnitude but changing direction at the end of every two secondCThe displacement of the particle is zeroDThe velocity becomes zero at t=4 second
The acceleration versus displacement graph of a particle performing SHM is shown in figure. The time period of oscillation of particle in second is
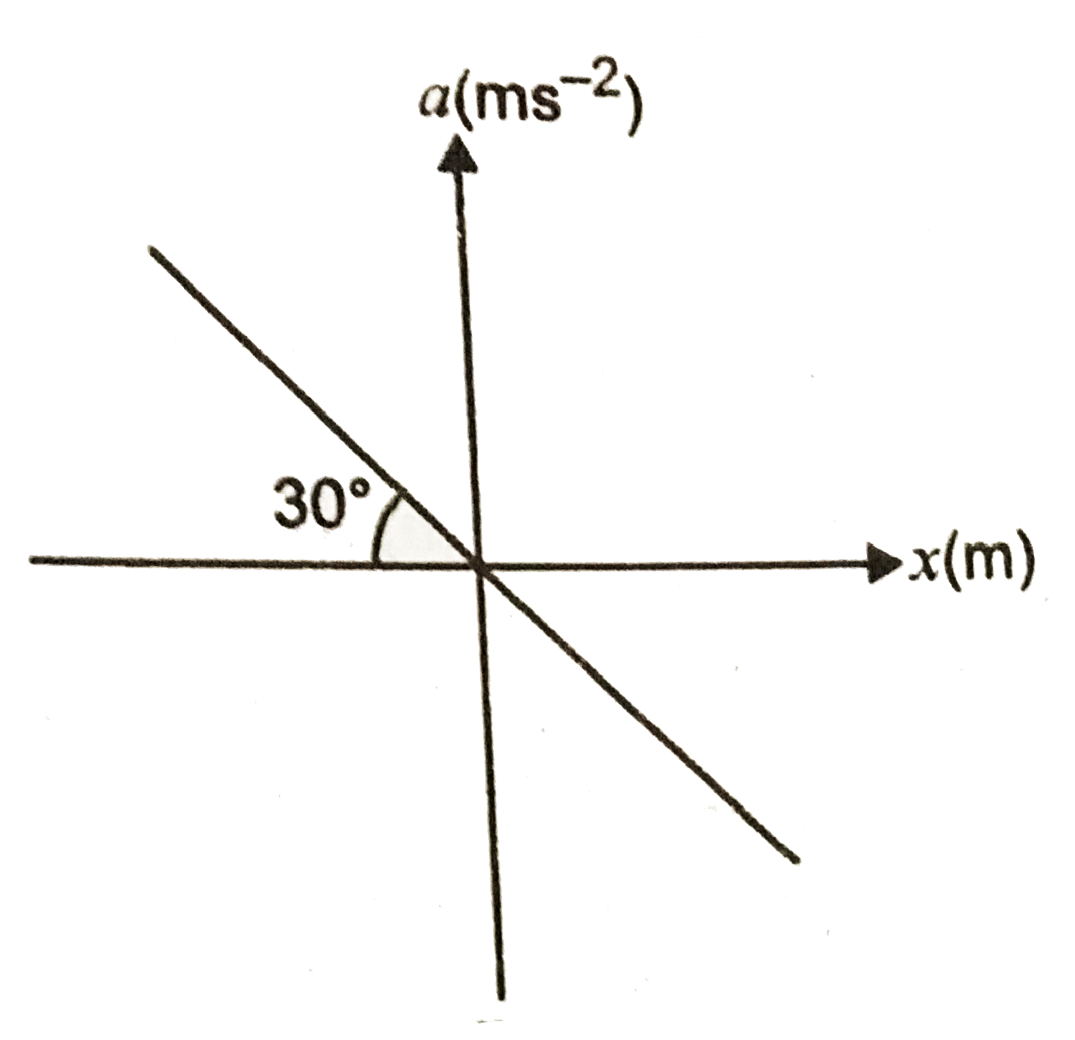
View SolutionThe displacement time graph of a particle executing S.H.M. is as shown in the figure
The corresponding force-time graph of the particle is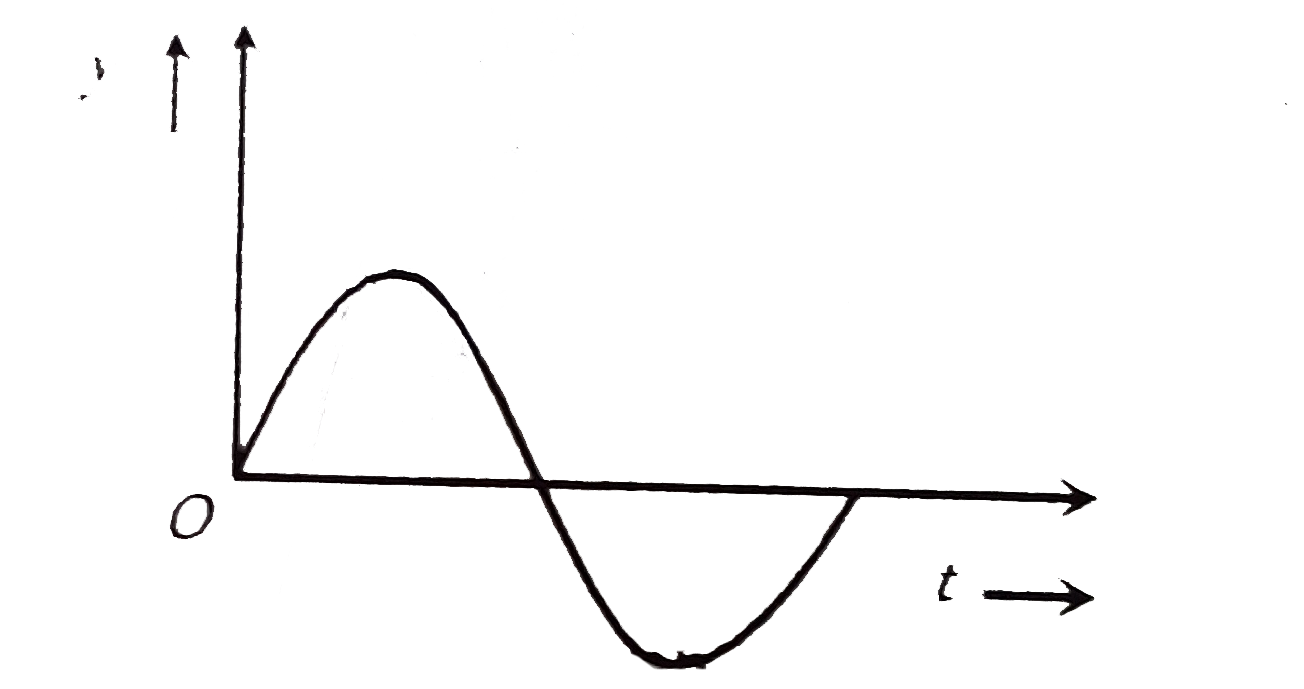
View SolutionThe displacement time graph of a particle executing SHM is as shown in the figure
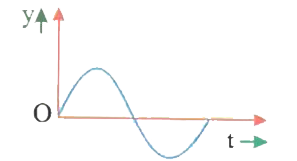
The corresponding force-time graph of the particle is
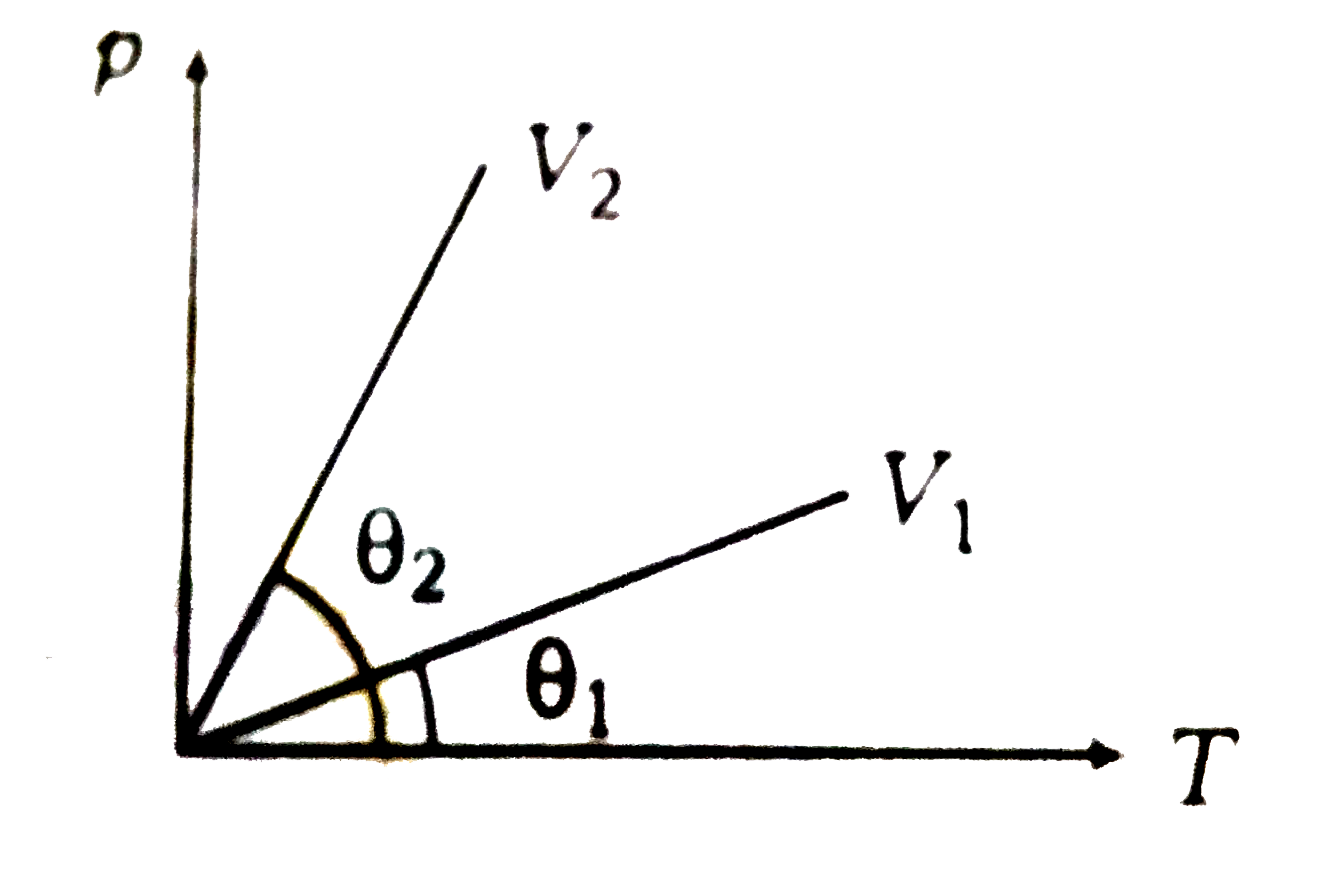
View SolutionFrom the p-T graph want conclusion can be drawn?
View SolutionThe velocity-time graph of a particle executing SHM is as shown in the figure. The amplitude and maximum acceleration of the particle respectively are
View Solution

