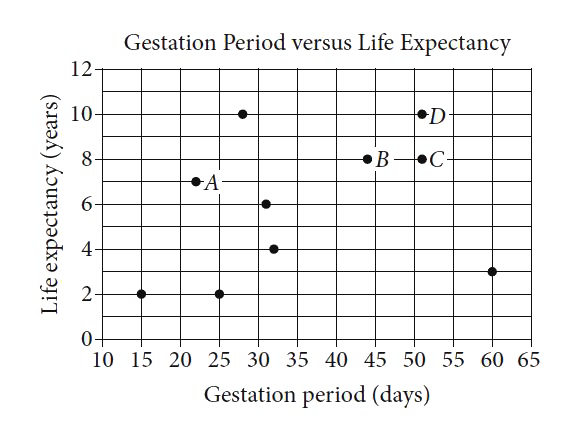
A curator at a wildlife society created the scatterplot above to examine the relationship between the gestation period and life expectancy of 10 species of animals
Of the labeled points, which represents the animal for which the ratio of life expectancy to gestation period is greatest?
A
B
C
D
The correct Answer is:A
The ratio of life expectancy to gestation period for the animal represented by point A is approximately 7 years 23 days, or about0.3 years/day, which is greater than the ratio for the animals represented by the other labeled points (the ratios for points B, C, and D, in units of years of life expectancy per day of gestation, are approximately 844,851and1051 respectively, each of which is less than 0.2 years/day). Choices B, C, and D are incorrect and may be the result of errors in calculating the ratio or in reading the graph.
Similar Questions
The inequation that best describes the graph given below is _________
View SolutionThe inequation that best describes the following graph is _________
View SolutionWhich inequations represent the shaded region in the given figure
View SolutionAt point P, the value of (dy)/(dx) is : ltimg src="https://d10lpgp6xz60nq.cloudfront.net/physics_images/ALN_PHY_R04_E01_025_Q01.png" width="80%"gt
View SolutionA system is shown in the figure. The time period for small oscillations of the two bolcks will be :- ltimg src="https://d10lpgp6xz60nq.cloudfront.net/physics_images/ALN_PHY_R02_E10_014_Q01.png" width="80%"gt
View Solution
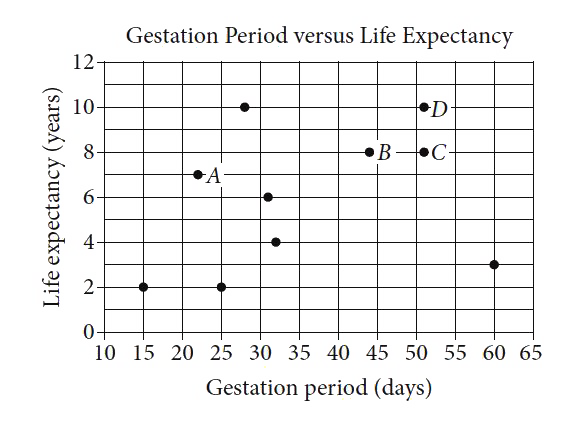
A curator at a wildlife society created the scatterplot above to examine the relationship between the gestation period and life expectancy of 10 species of animals
What is the life expectancy, in years, of the animal that has the longest gestation period?
View SolutionAt point P, the value of (dy)/(dx) is : ltimg src="https://d10lpgp6xz60nq.cloudfront.net/physics_images/ALN_PHY_R04_E01_025_Q01.png" width="80%"gt
View Solution
