The mass of living organisms in a lake is defined to be the biomass of the lake. If the biomass in a lake doubles each year, which of the following graphs could model the biomass in the lake as a function of time? (Note: In each graph below, O represents (0, 0).)
The correct Answer is:C
To determine which graph models the biomass of a lake that doubles each year, we can follow these steps:
Step 1: Understand the Concept of Doubling
The problem states that the biomass in the lake doubles each year. This means that if we denote the biomass at year t as B(t), we can express it mathematically as:
B(t)=B(0)×2t
where B(0) is the initial biomass at year t=0.
Step 2: Analyze Initial Conditions
Since the biomass cannot be negative or zero (as doubling zero would still yield zero), we conclude that the initial biomass B(0) must be a positive number. Thus, the graph must start above the origin (0,0).
Step 3: Eliminate Graphs
Now we can eliminate graphs based on the initial condition:
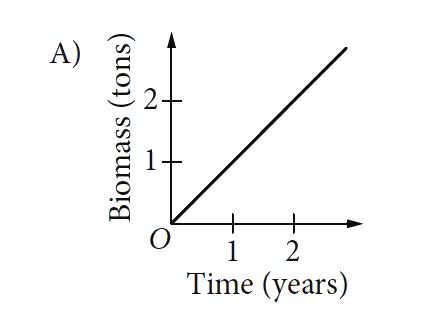
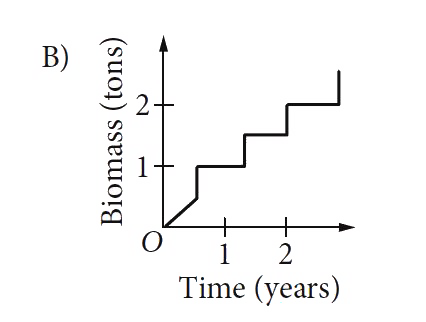
- Graphs A and B: If these graphs start at (0,0), they cannot represent the biomass since it cannot be zero. Therefore, we eliminate these two graphs.
Step 4: Check for Exponential Growth
Next, we need to check the remaining graphs (C and D) for exponential growth:
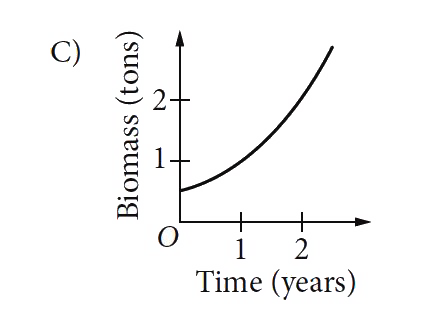
- Graph C: This graph should show a curve that rises steeply, indicating that the biomass is increasing exponentially as time progresses.
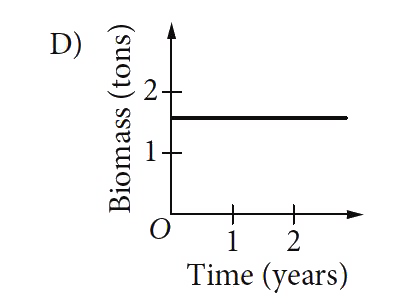
- Graph D: If this graph shows a constant value or linear growth, it would not represent the doubling condition.
Step 5: Conclusion
After analyzing the remaining graphs:
- Graph C starts at a positive value and shows exponential growth, which aligns with the condition of biomass doubling each year.
- Graph D does not show the expected exponential growth.
Thus, the correct graph that models the biomass in the lake as a function of time is Graph C.
The problem states that the biomass in the lake doubles each year. This means that if we denote the biomass at year t as B(t), we can express it mathematically as:
B(t)=B(0)×2t
where B(0) is the initial biomass at year t=0.
Since the biomass cannot be negative or zero (as doubling zero would still yield zero), we conclude that the initial biomass B(0) must be a positive number. Thus, the graph must start above the origin (0,0).
Now we can eliminate graphs based on the initial condition:
- Graphs A and B: If these graphs start at (0,0), they cannot represent the biomass since it cannot be zero. Therefore, we eliminate these two graphs.
Next, we need to check the remaining graphs (C and D) for exponential growth:
- Graph C: This graph should show a curve that rises steeply, indicating that the biomass is increasing exponentially as time progresses.
- Graph D: If this graph shows a constant value or linear growth, it would not represent the doubling condition.
After analyzing the remaining graphs:
- Graph C starts at a positive value and shows exponential growth, which aligns with the condition of biomass doubling each year.
- Graph D does not show the expected exponential growth.
Similar Questions
झील के पारिस्थितिक तंत्र में जैवभार का पिरामिड होता हैं-
View SolutionLakes rich in organic compounds are Oligotrophic lakes.
View SolutionWhich one of the following lakes is a salt water lake?
View SolutionIn a lake ecosystem, pyramid of biomass is:
View SolutionOrganisms living at the bottom of a lake are
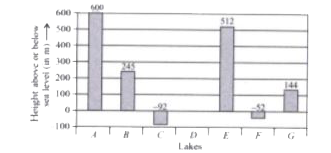
View SolutionThe given bar graph shows heights of lakes. Find the difference in elevation for Lake E and Lake C
View Solutionझील के पारिस्थितिक तंत्र में जैवभार का पिरामिड होता हैं-
View Solution
