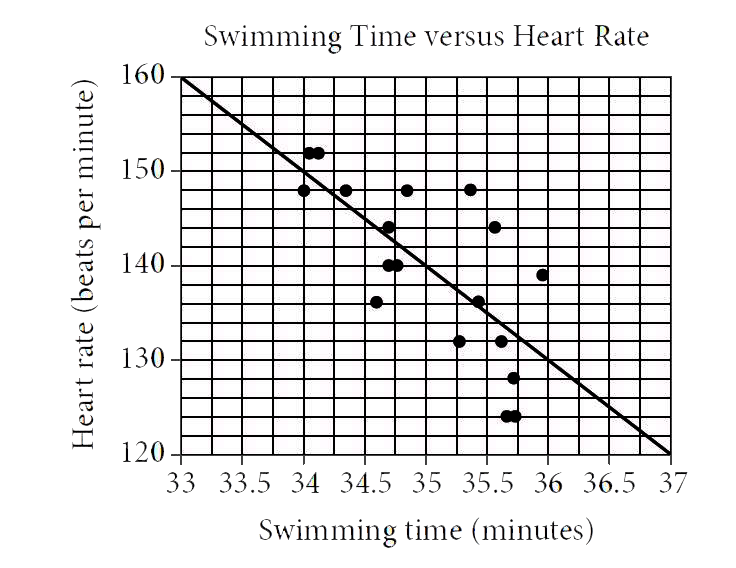
Michael swam 2,000 yards on each of eighteen days. The scatterplot above shows his swim time for and corresponding heart rate after each swim. The line of best fit for the data is also shown. For the swim that took 34 minutes, Michael’s actual heart rate was about how many beats per minute less than the rate predicted by the line of best fit?
1
2
3
4
The correct Answer is:B
Step by step video, text & image solution for Michael swam 2,000 yards on each of eighteen days. The scatterplot above shows his swim time for and corresponding heart rate after each swim. The line of best fit for the data is also shown. For the swim that took 34 minutes, Michael’s actual heart rate was about how many beats per minute less than the rate predicted by the line of best fit? by Maths experts to help you in doubts & scoring excellent marks in Class 12 exams.
Similar Questions
The inequation that best describes the following graph is _________
02:10View SolutionThe equation of straight line shown in figure is :
ltimg src="https://d10lpgp6xz60nq.cloudfront.net/physics_images/ALN_PHY_R04_E01_020_Q01.png" width="80%"gt01:59View SolutionWhat is the distance OA for the square shown in figure :- ltimg src="https://d10lpgp6xz60nq.cloudfront.net/physics_images/ALN_PHY_R05_E01_015_Q01.png" width="80%"gt
01:19View Solution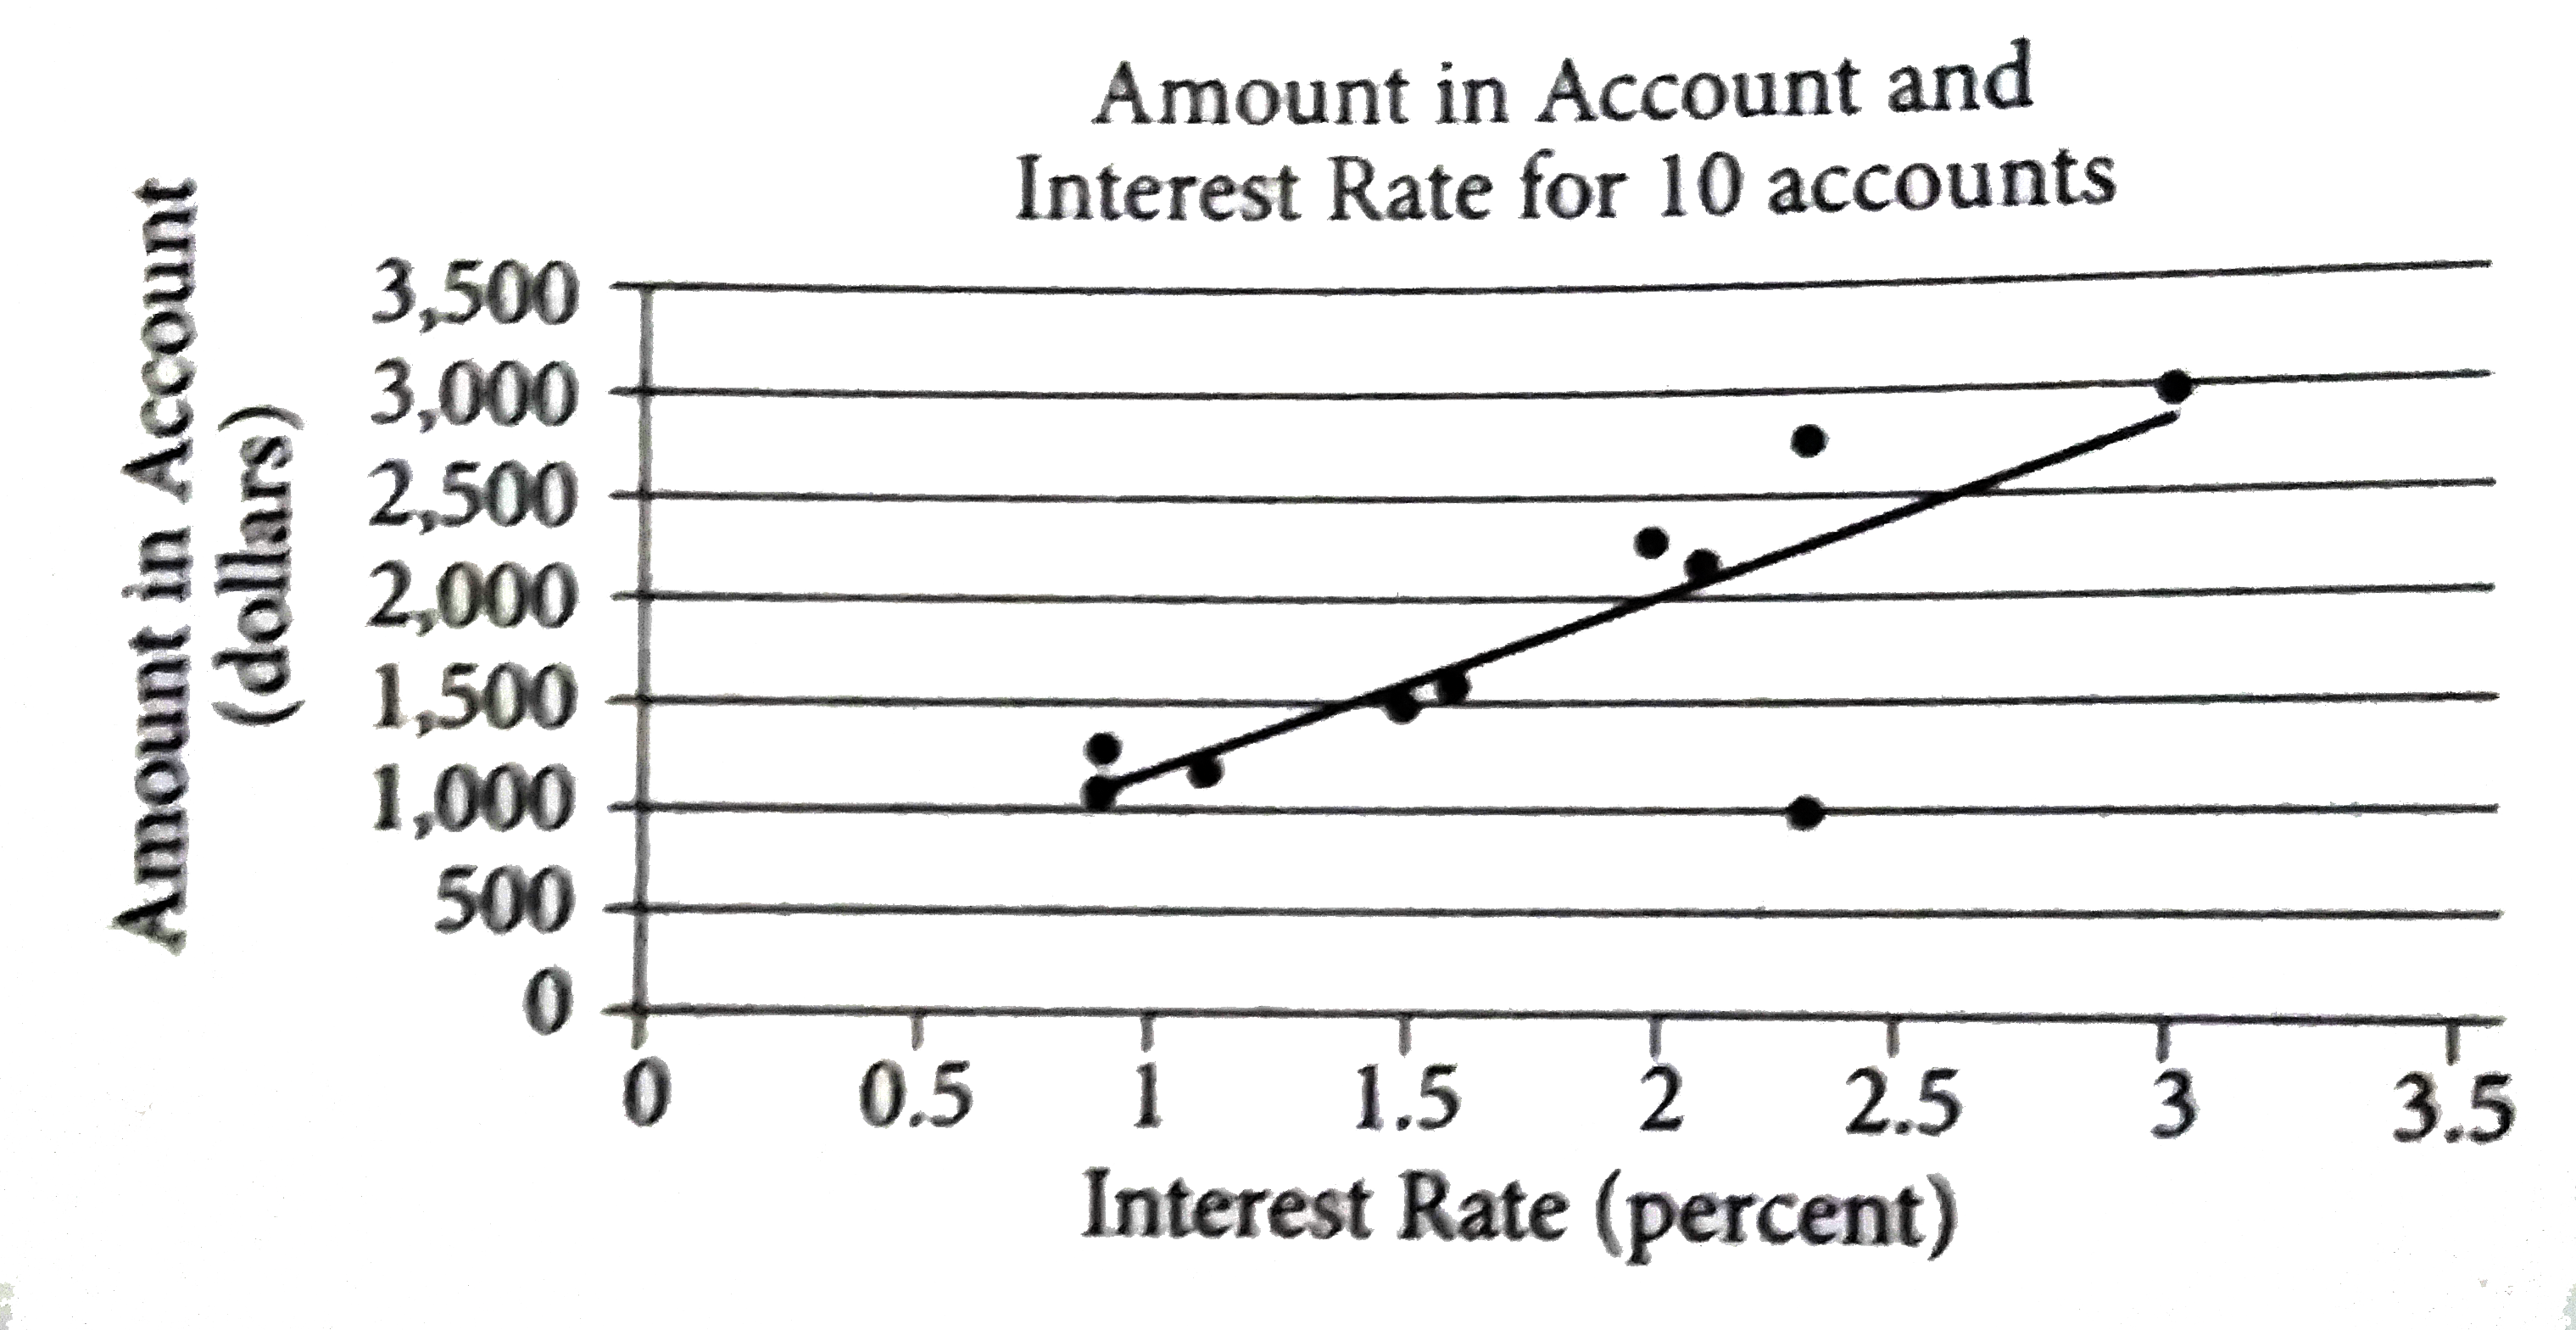
The scatterplot above shows data for ten accounts opened by a company , along with the line of best fit. For the account that contains the least amount of money, which of the following is closest to the difference of the actual amount and the amount predicted by the line of best fit?View SolutionTen 25- year - old men were asked how many hours per week they exercise and their resting heart rate was taken in beats per minute (BPM). The results are shown as points in the scatterplot below, and the line of best fit is drawn.
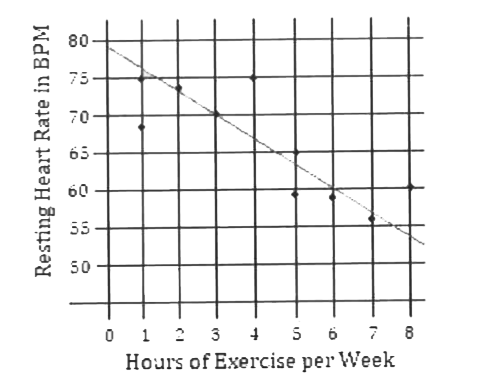
How many of hte men have a resting heart rate that differs by more than 5 BPM from the resting heart rate predicted by the line of best fit?08:50View SolutionTen 25- year - old men were asked how many hours per week they exercise and their resting heart rate was taken in beats per minute (BPM). The results are shown as points in the scatterplot below, and the line of best fit is drawn.
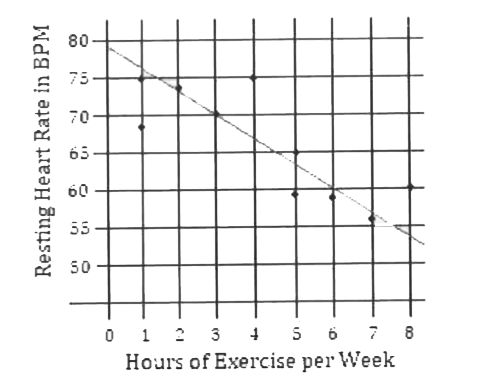
Based on the line of best fit, what is hte predicted resting heart rate for someone that exercises three and a half hours per week?06:28View SolutionTen 25- year - old men were asked how many hours per week they exercise and their resting heart rate was taken in beats per minute (BPM). The results are shown as points in the scatterplot below, and the line of best fit is drawn.
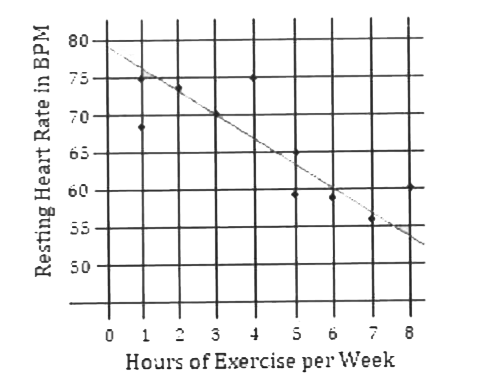
Which of the following is the best interpretation of the slope of the line of best fit in the context of this problem?03:19View Solution

