John runs at different speeds as part of his training program. The graph shows his target heart rate at different times during his workout. On which interval is the target heart rate strictly increasing then strictly decreasing?
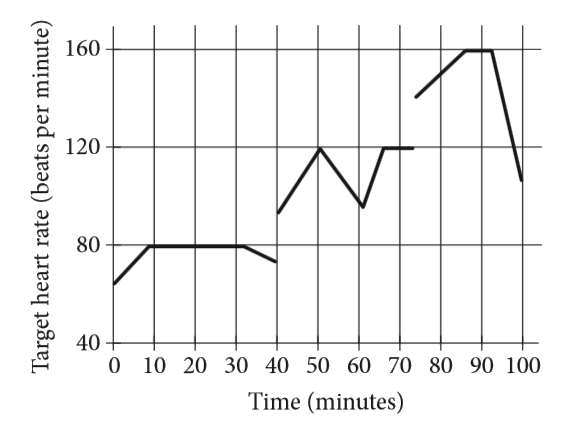
Between 0 and 30 minutes
Between 40 and 60 minutes
Between 50 and 65 minutes
Between 70 and 90 minutes
The correct Answer is:B
Step by step video, text & image solution for John runs at different speeds as part of his training program. The graph shows his target heart rate at different times during his workout. On which interval is the target heart rate strictly increasing then strictly decreasing? by Maths experts to help you in doubts & scoring excellent marks in Class 12 exams.
Similar Questions
A circus wishes to develop a new clown act. Fig. (1) shows a diagram of the proposed setup. A clown will be shot out of a cannot with velocity v0 at a trajectory that makes an angle θ=45∘ with the ground. At this angile, the clown will travell a maximum horizontal distance. The cannot will accelerate the clown by applying a constant force of 10,000N over a very short time of 0.24s. The height above the ground at which the clown begins his trajectory is 10m.
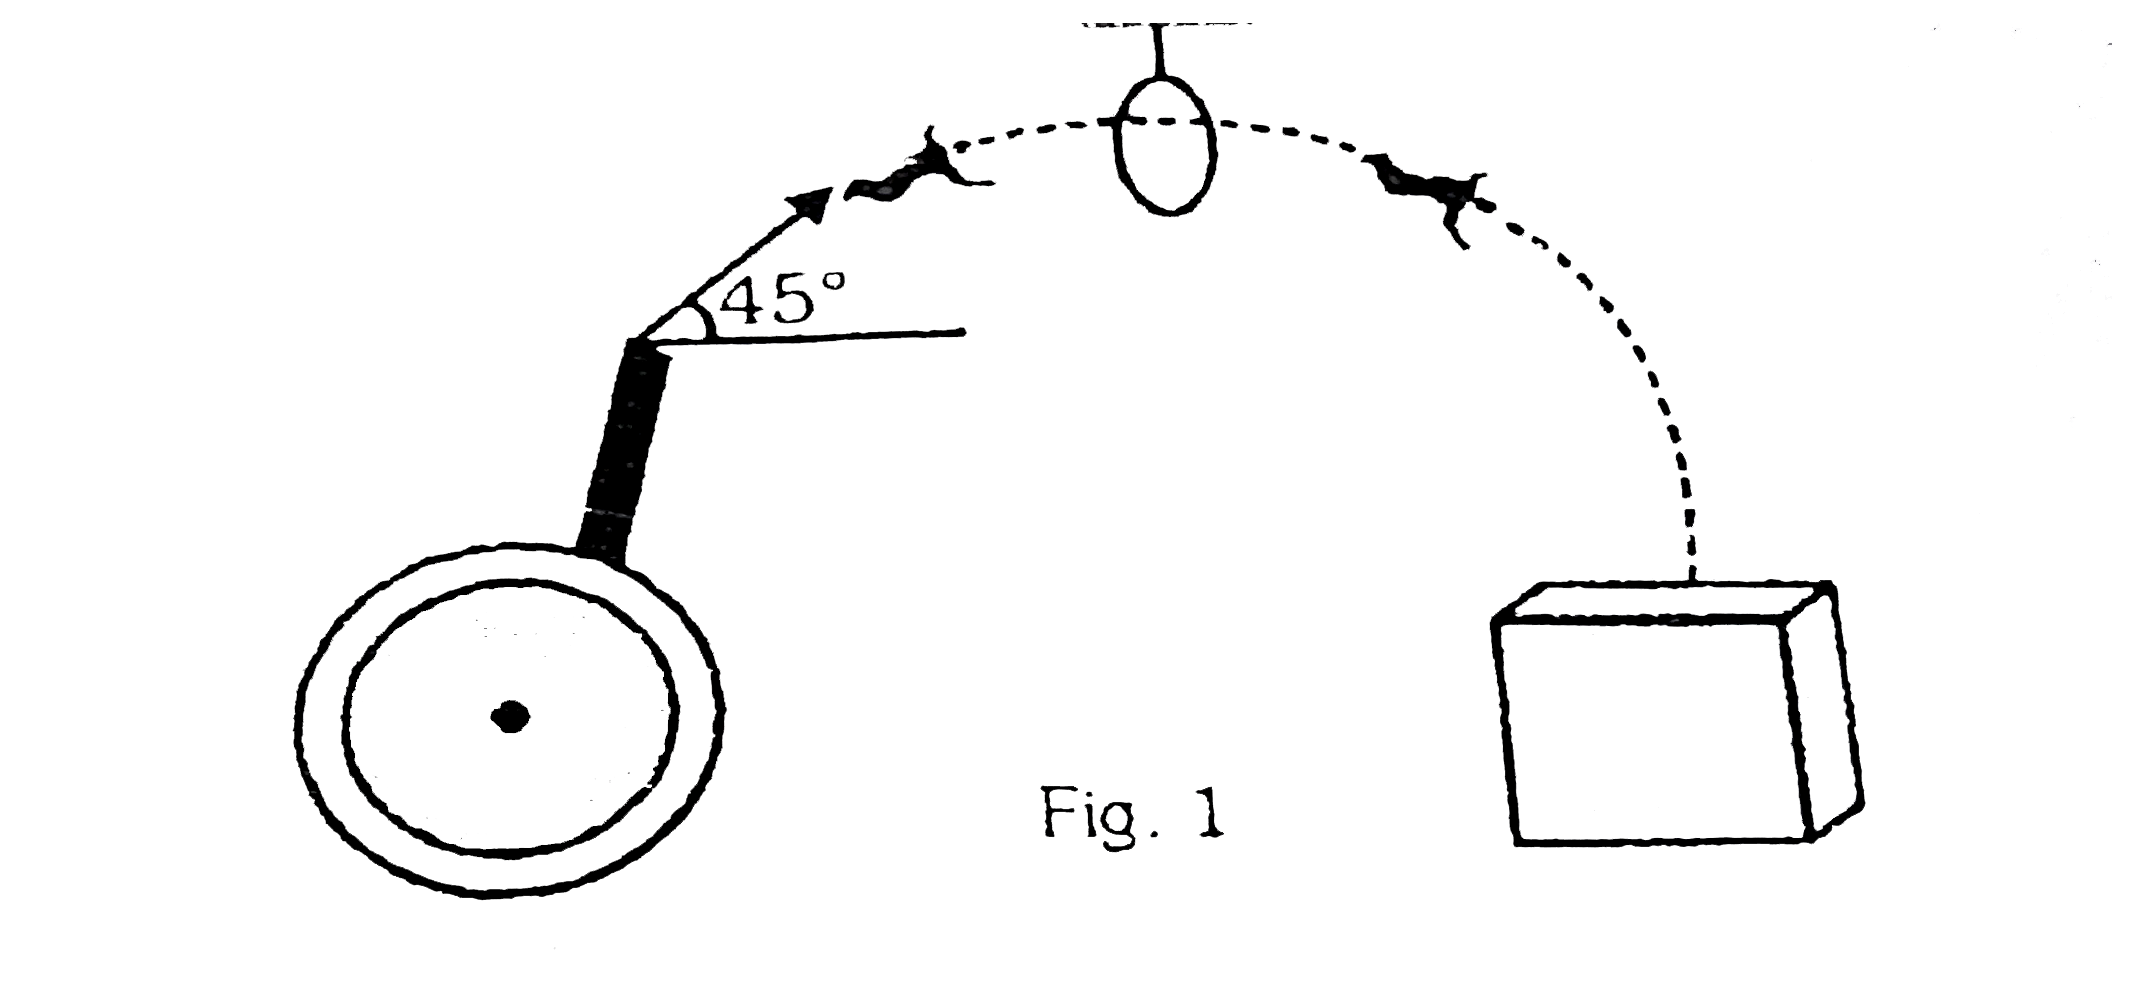
A large hoop is to be suspended from the celling by a massless cable at just the right place so that the clown will be able to dive through it when he reaches a maximum height above the ground. After passing through the hoop he will then continue on his trajectory until arriving at the safety net. Fig (2) shows a graph of the vertical component of the clown's velocity as a function of time between the cannon and the hoop. Since the velocity depends on the mass of the particular clown performing the act, the graph shows data for serveral different masses.
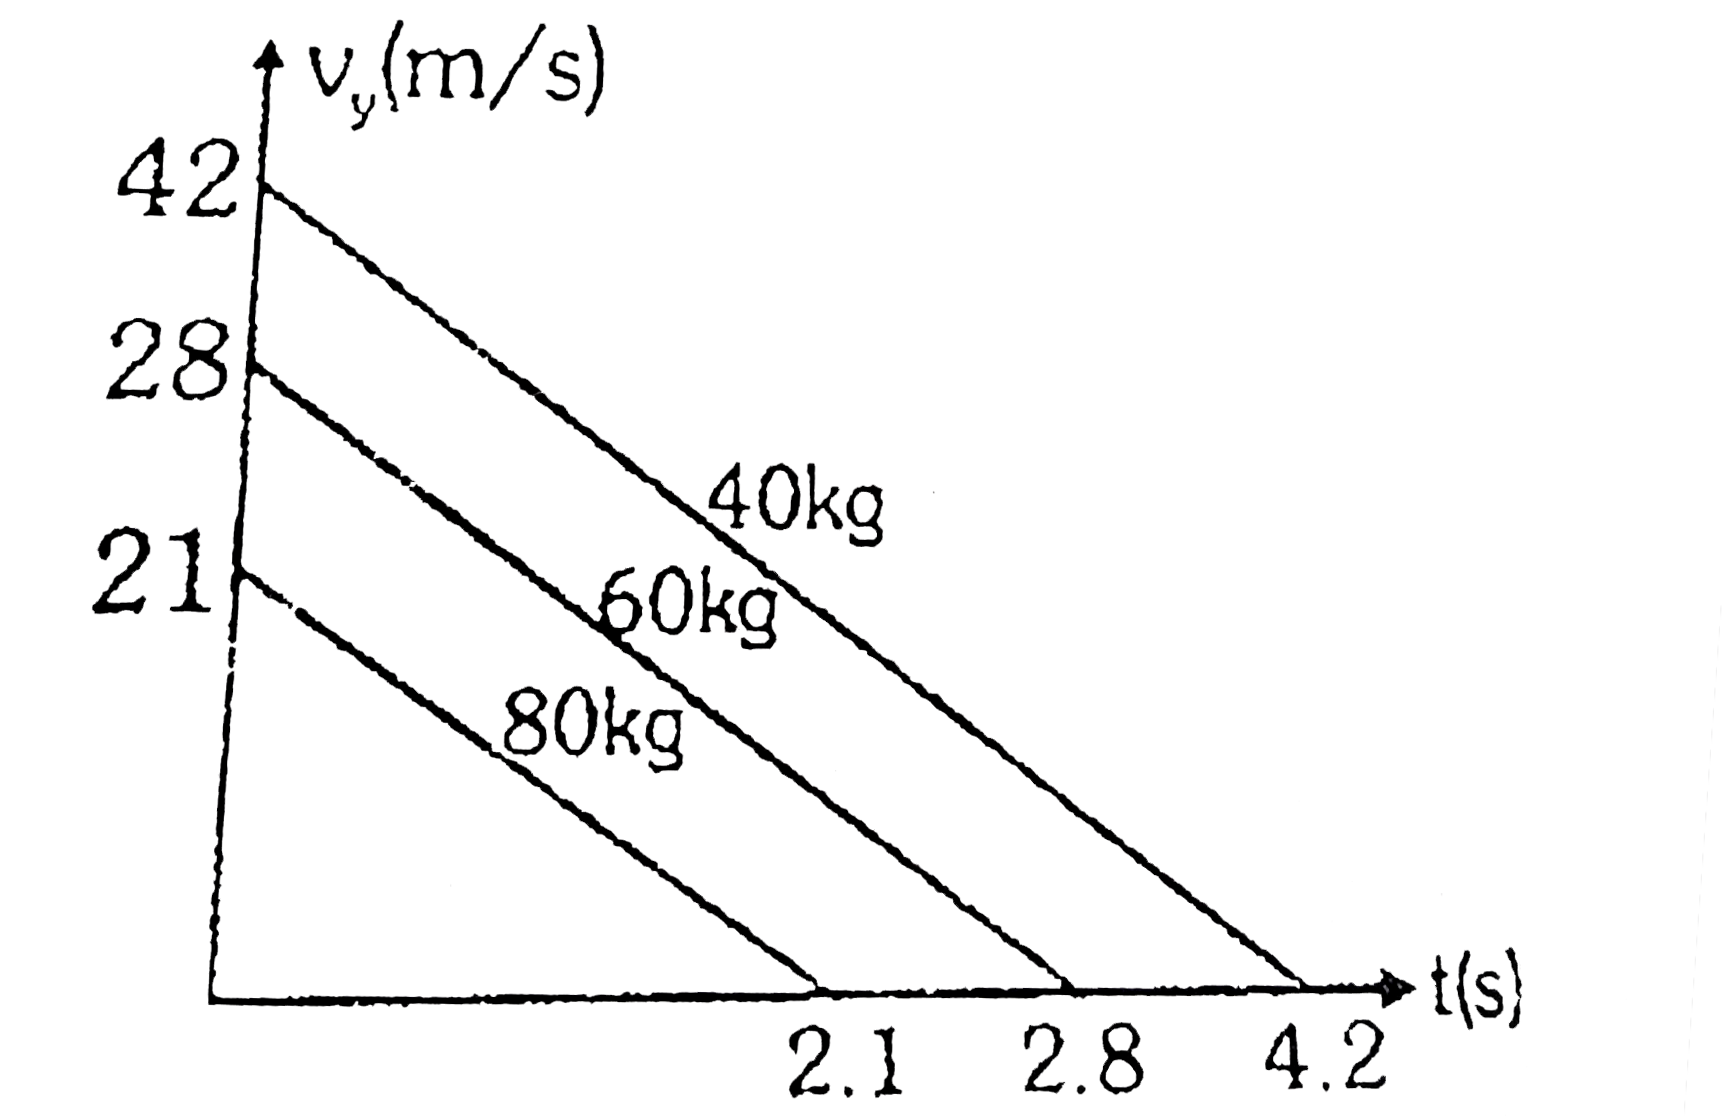
If a clown holds on to hoop instead of passing through it, what is the position of the cable so that he doesn't hit his head on the ceiling as he swings upward?View SolutionGenerally, we consider that during slowing of a moving automobile, its retardation is constant, but in practice this is seldom the case. Under many circumstances, especially at high speed, we usually apply the brakes slowly at first and then more strongly as the car slows. The braking force therefore depends on the time during the interval over which the car is slowing and acceleration changes with time.
ax(t)=vA−vxdt=Fx(t)m
∫vxv0xdVx=∫10Fx(t)mdt
∴Vx=V0x+1m∫10Fx(t)dt
x(t)=x0+∫10Vx(t)dt
An example for the same is discussed here.
A car of mass m = 1000 kg is moving with 25 m/s. The driver begins to apply the brakes so that the magnitude of the braking force increases linearly with time at a rate of 2000 N/s.
Read the above passage carefully and answer the following questions.
How much time passes before the car comes to rest?View Solution
Knowledge Check
- Question 1 - Select One
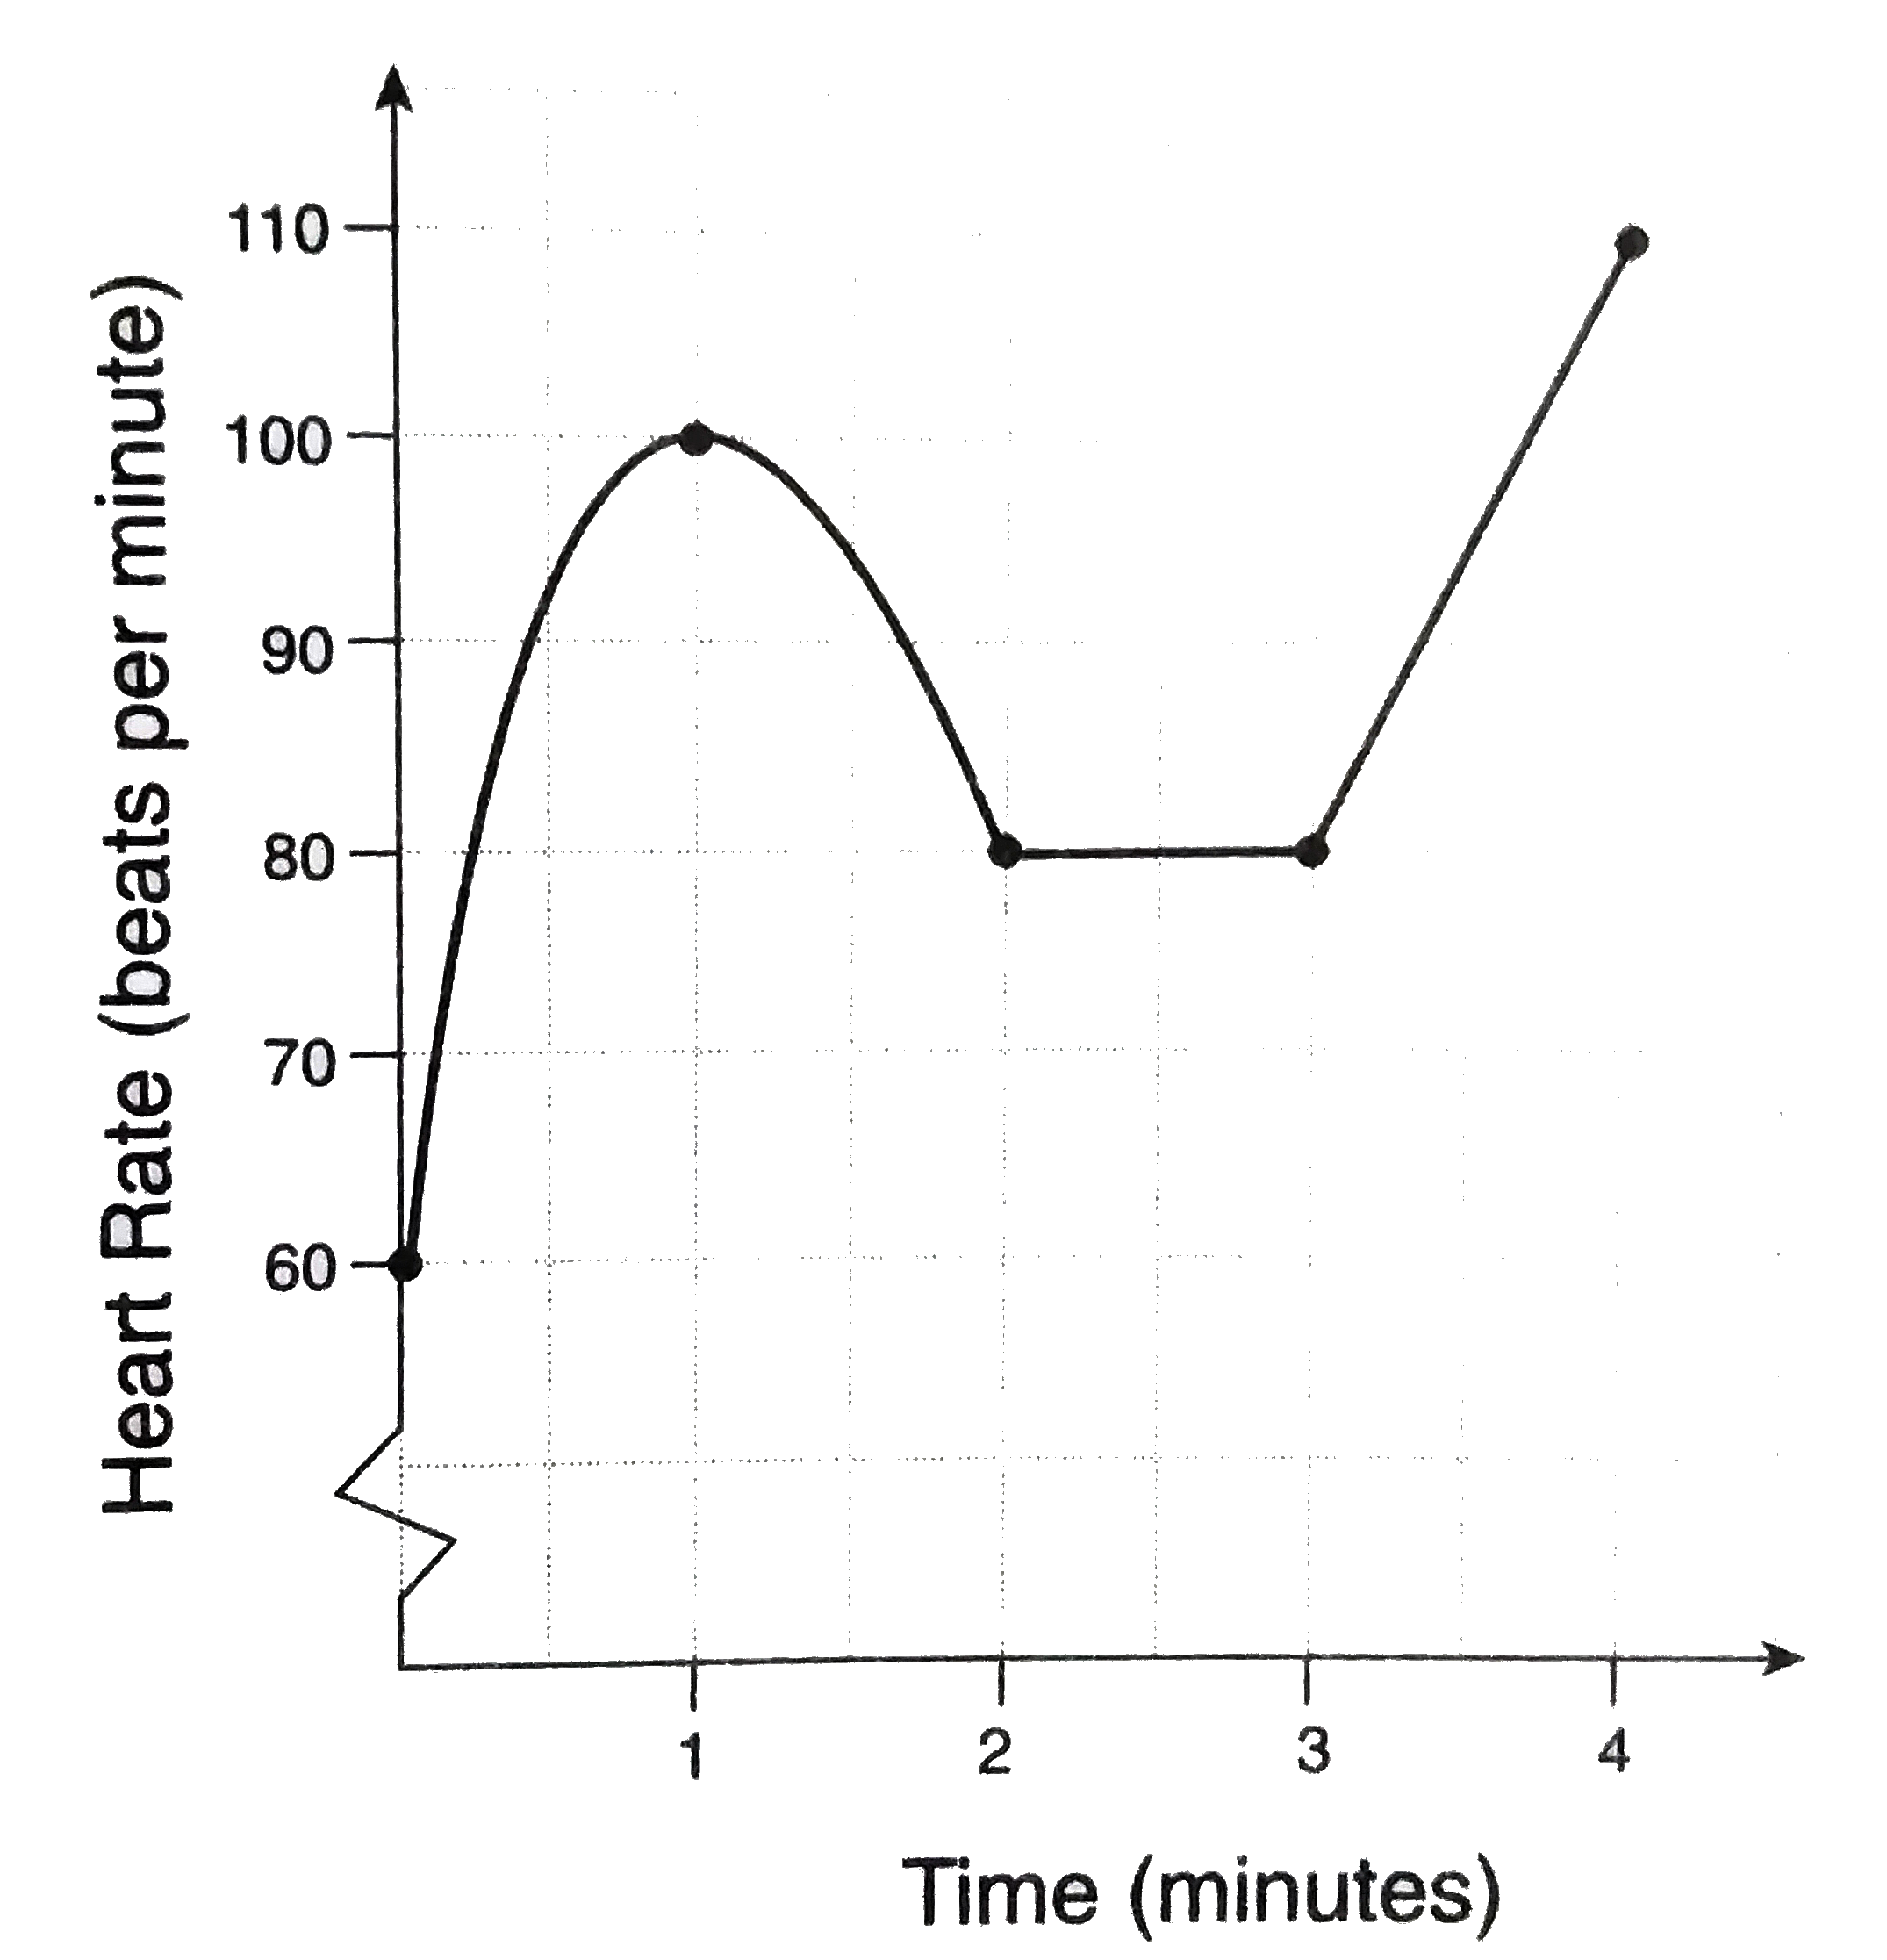
Question 13 and 14 refer to the gaph above which shows the heart rate, in veats per minutes, of a jogger during a 4-minutes interval.
Q. The greatest percent of increase in the jogger's heart rate occured over what interval of time, in minutes?A0 to 1B1 to 2C2 to 3D3 to 4 - Question 2 - Select One
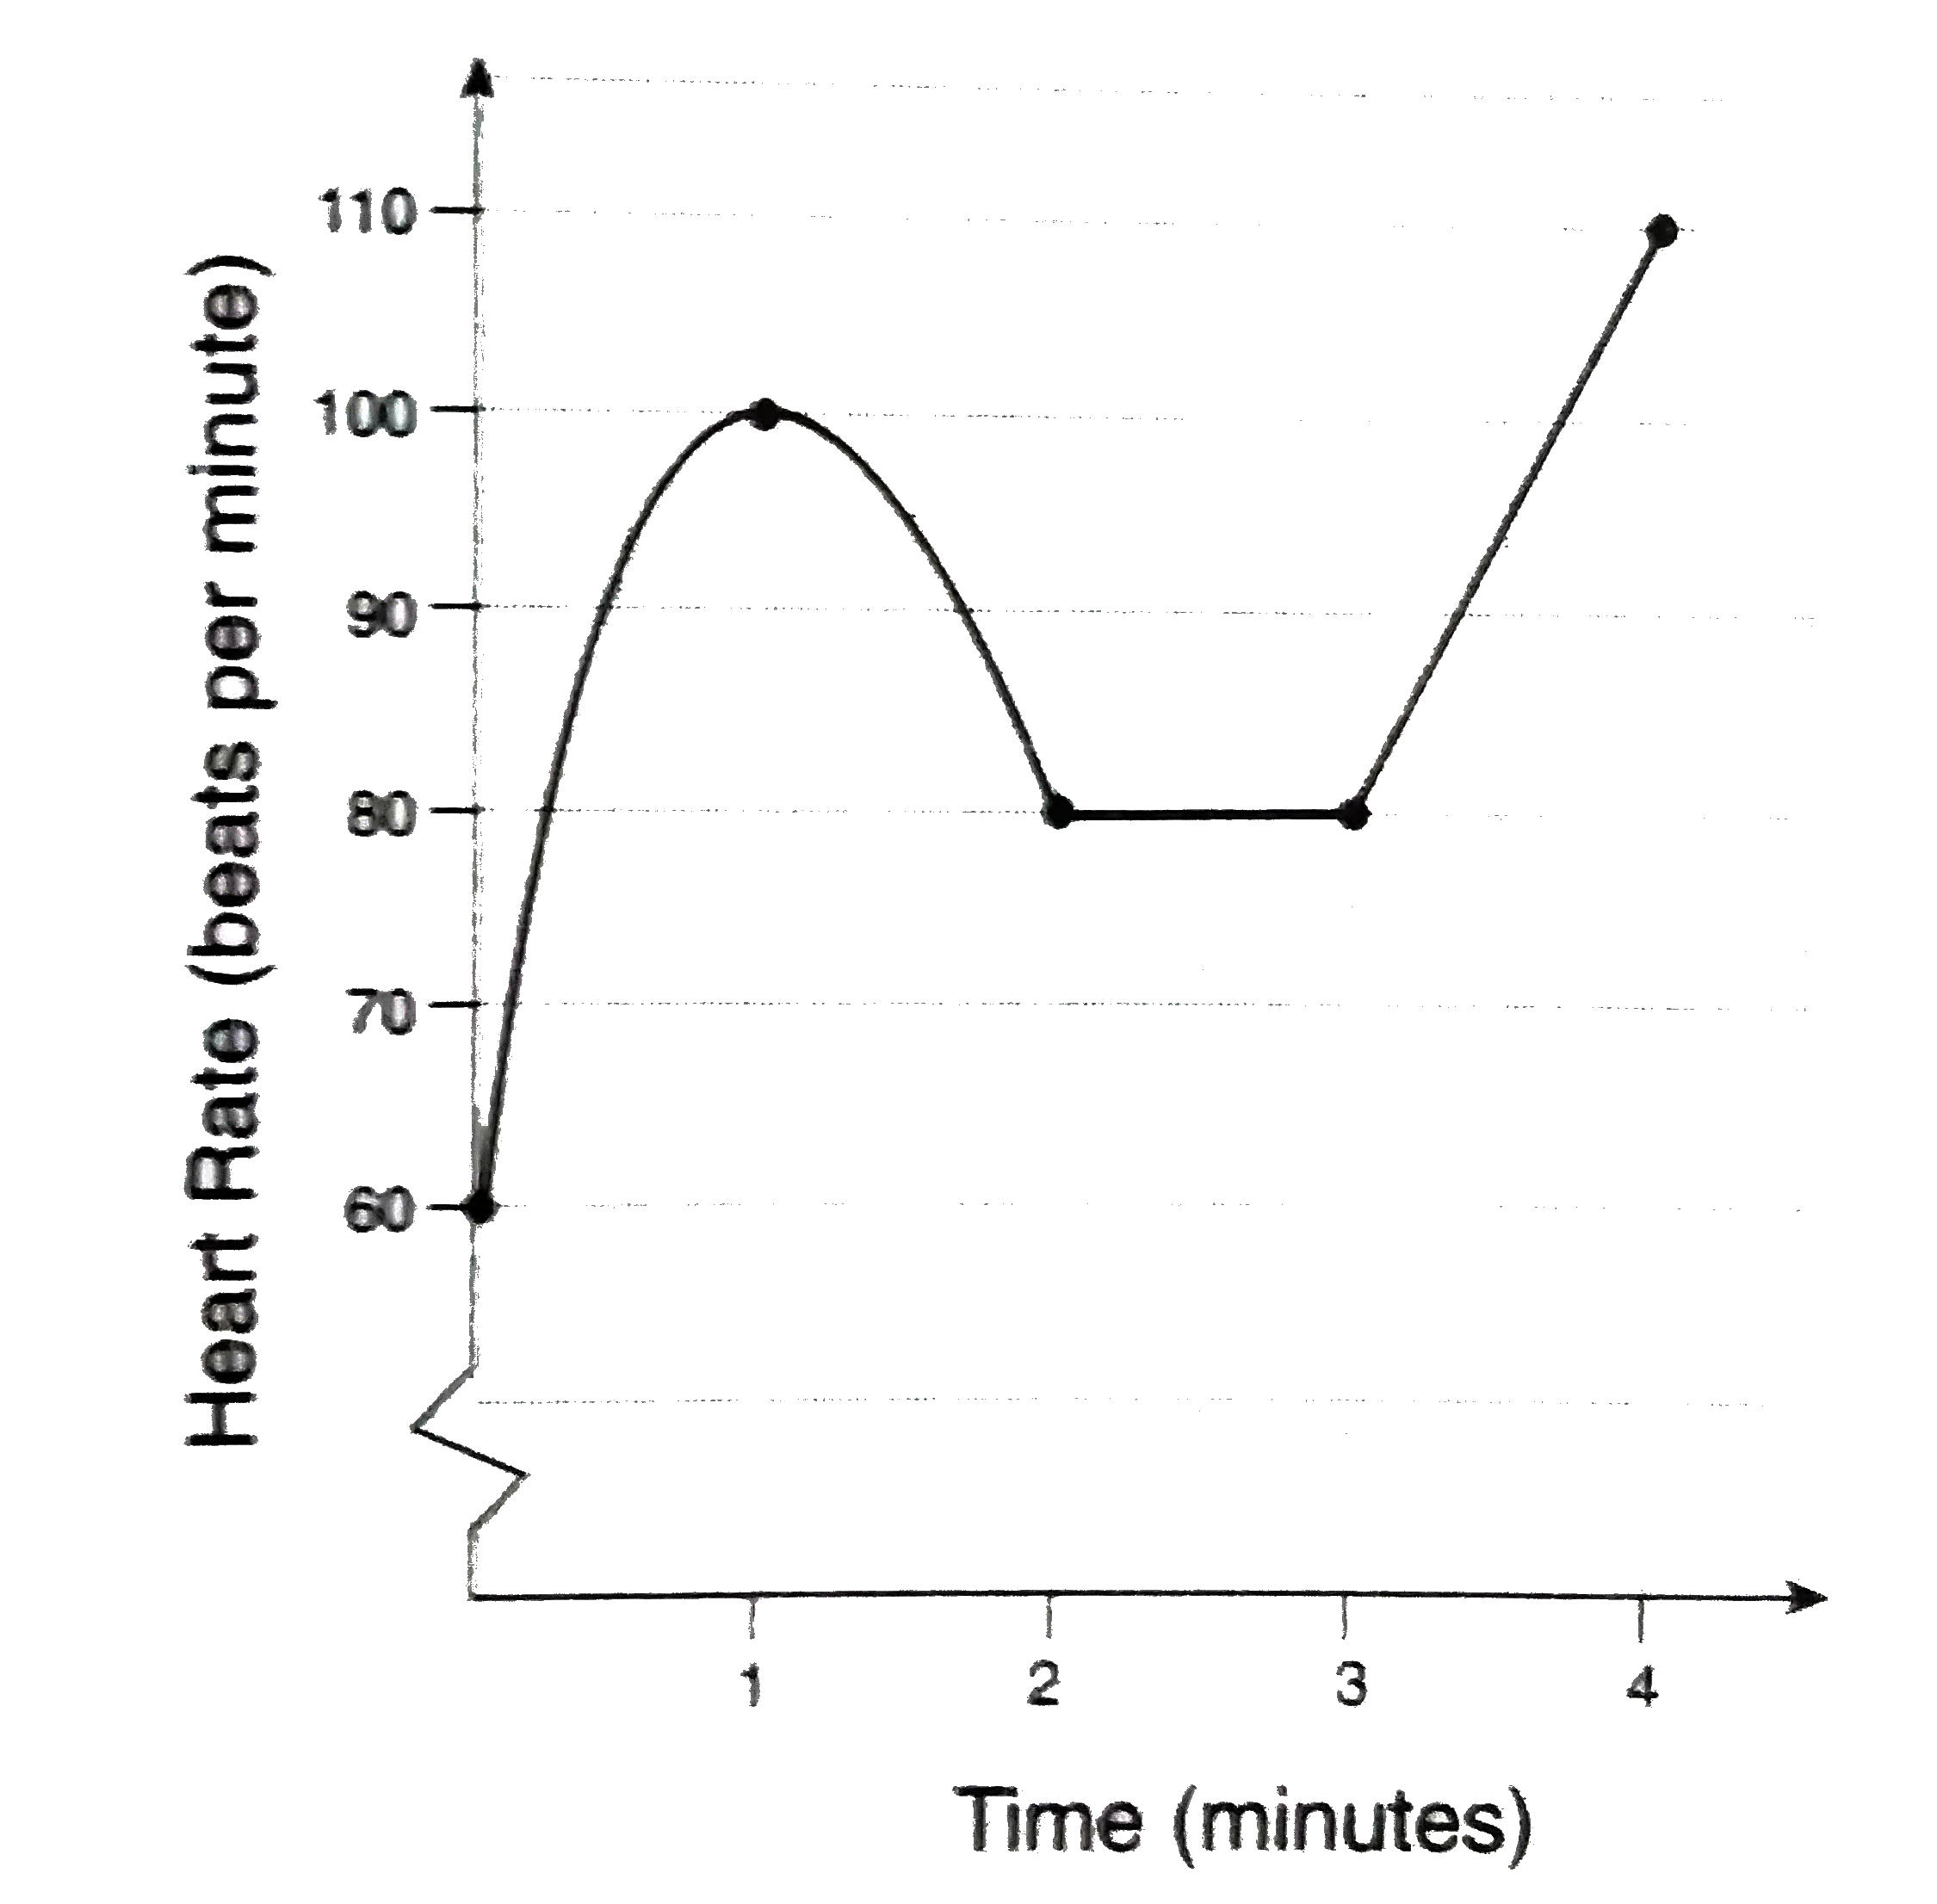
Question 13 and 14 refer to the gaph above which shows the heart rate, in veats per minutes, of a jogger during a 4-minutes interval.
Q. Overr what interval of time, in minutes, was the jogger's heart rate changing at a constant rate?A0 to 1B1 to 2C2 to 3D3 to 4 - Question 3 - Select One
Mr. Martinson is building a concrete patio in his backyard and deciding where to buy the materials and rent the tools needed for the project. The table below shows the materials’ cost and daily rental costs for three different stores.
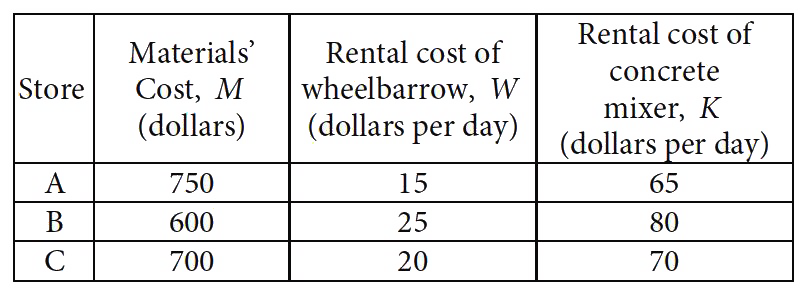
The total cost, y, for buying the materials and renting the tools in terms of the number of days, x, is given by y=M+(W+K)x .
If the relationship between the total cost, y, of buying the materials and renting the tools at Store C and the number of days, x, for which the tools are rented is graphed in the xy-plane, what does the slope of the line represent?AThe total cost of the projectBThe total cost of the materialsCThe total daily cost of the projectDThe total daily rental costs of the tools
Generally, we consider that during slowing of a moving automobile, its retardation is constant, but in practice this is seldom the case. Under many circumstances, especially at high speed, we usually apply the brakes slowly at first and then more strongly as the car slows. The braking force therefore depends on the time during the interval over which the car is slowing and acceleration changes with time.
ax(t)=vA−vxdt=Fx(t)m
∫vxv0xdVx=∫10Fx(t)mdt
∴Vx=V0x+1m∫10Fx(t)dt
x(t)=x0+∫10Vx(t)dt
An example for the same is discussed here.
A car of mass m = 1000 kg is moving with 25 m/s. The driver begins to apply the brakes so that the magnitude of the braking force increases linearly with time at a rate of 2000 N/s.
Read the above passage carefully and answer the following questions.
Find the velocity of the car at t = 10 sec.View SolutionA courier-person cycles from a town to a neighbouring suburban area to deliver aparcel to a merchant. His distance from the town at different times is shown by thefollowing graph.(a) What is the scale taken for the time axis?(b) How much time did the person take for the travel?(c) How far is the place of the merchant from the town?(d) Did the person stop on his way? Explain.(e) During which period did he ride fastest?
View Solution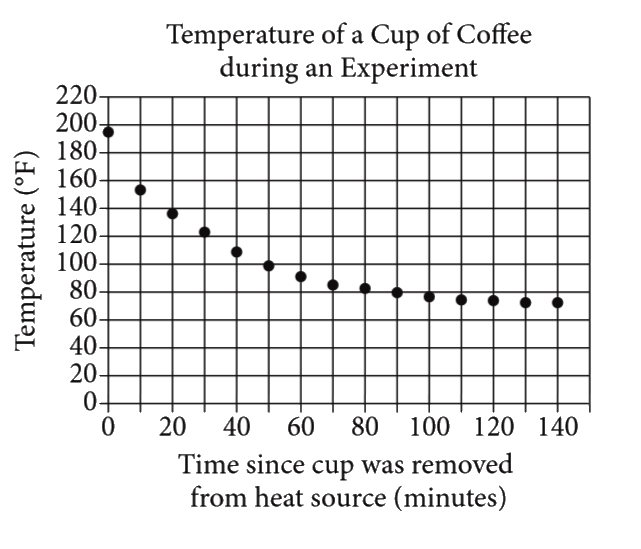
In an experiment, a heated cup of coffee is removed from a heat source, and the cup of coffee is then left in a room that is kept at a constant temperature. The graph above shows the temperature, in degrees Fahrenheit (.∘F), of the coffee immediately after being removed from the heat source and at 10-minute intervals thereafter.
During which of the following 10-minute intervals does the temperature of the coffee decrease at the greatest average rate?View SolutionA circus wishes to develop a new clown act. Fig. (1) shows a diagram of the proposed setup. A clown will be shot out of a cannot with velocity v0 at a trajectory that makes an angle θ=45∘ with the ground. At this angile, the clown will travell a maximum horizontal distance. The cannot will accelerate the clown by applying a constant force of 10,000N over a very short time of 0.24s. The height above the ground at which the clown begins his trajectory is 10m.
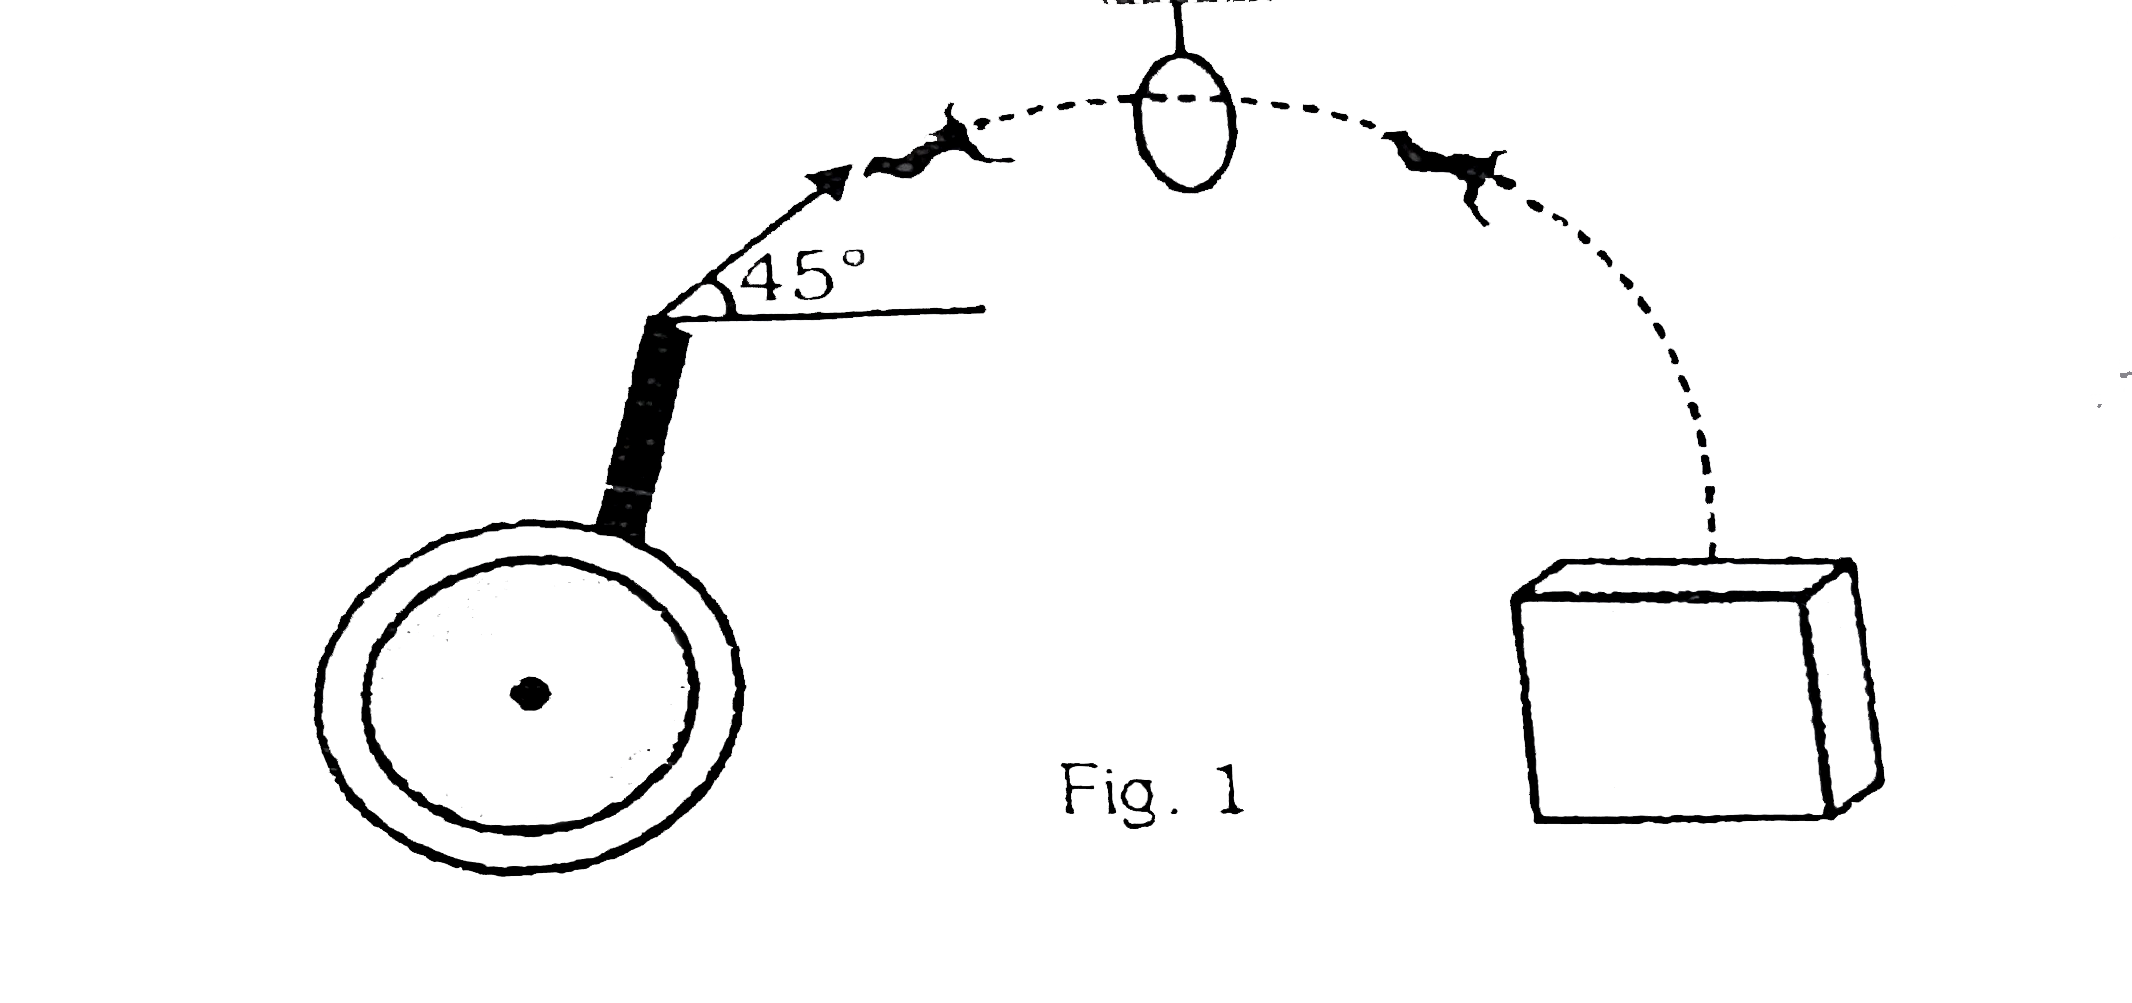
A large hoop is to be suspended from the celling by a massless cable at just the right place so that the clown will be able to dive through it when he reaches a maximum height above the ground. After passing through the hoop he will then continue on his trajectory until arriving at the safety net. Fig (2) shows a graph of the vertical component of the clown's velocity as a function of time between the cannon and the hoop. Since the velocity depends on the mass of the particular clown performing the act, the graph shows data for serveral different masses.
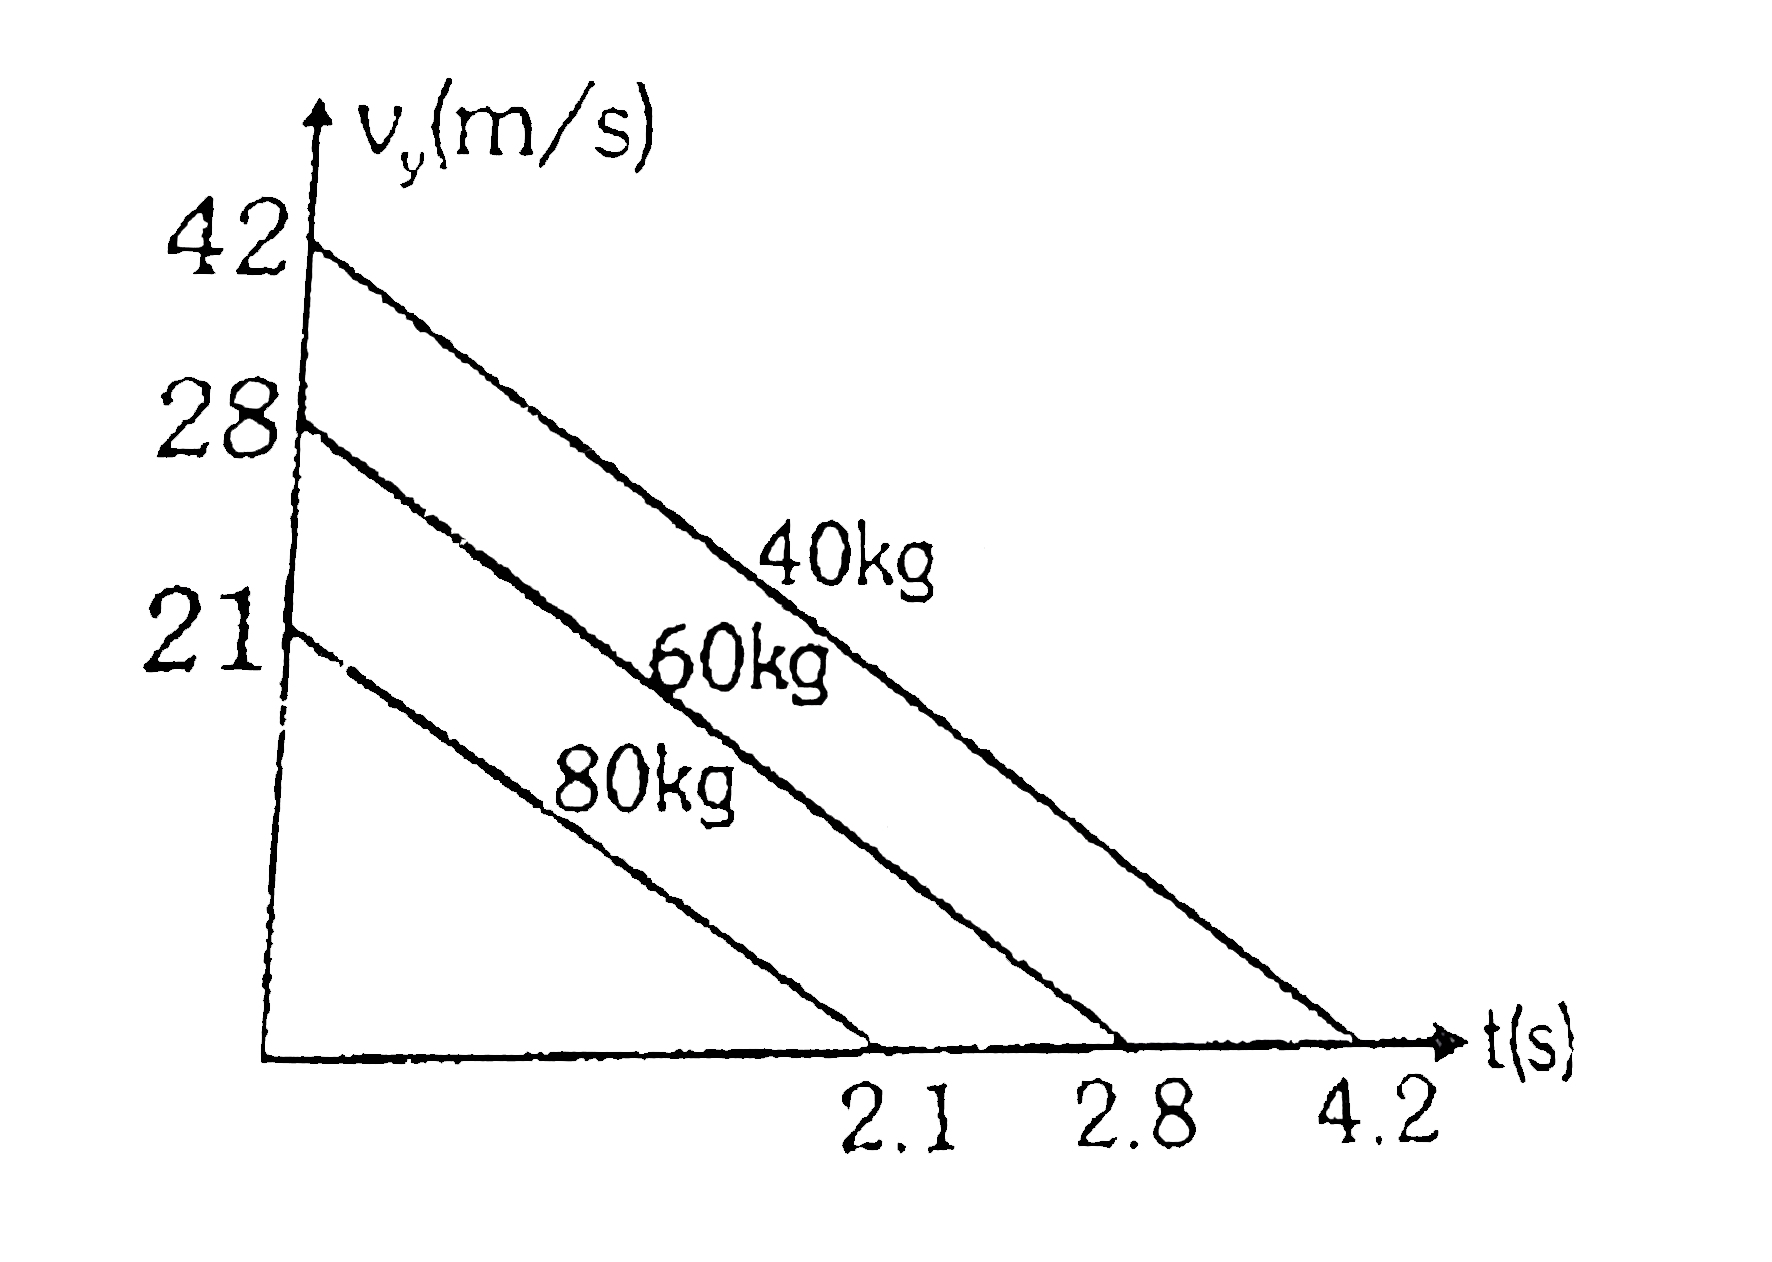
If the angle the cannot makes with the horiaontal is increased from 45∘, the hoop will have to beView SolutionA circus wishes to develop a new clown act. Fig. (1) shows a diagram of the proposed setup. A clown will be shot out of a cannot with velocity v0 at a trajectory that makes an angle θ=45∘ with the ground. At this angile, the clown will travell a maximum horizontal distance. The cannot will accelerate the clown by applying a constant force of 10,000N over a very short time of 0.24s. The height above the ground at which the clown begins his trajectory is 10m.
A large hoop is to be suspended from the celling by a massless cable at just the right place so that the clown will be able to dive through it when he reaches a maximum height above the ground. After passing through the hoop he will then continue on his trajectory until arriving at the safety net. Fig (2) shows a graph of the vertical component of the clown's velocity as a function of time between the cannon and the hoop. Since the velocity depends on the mass of the particular clown performing the act, the graph shows data for serveral different masses.
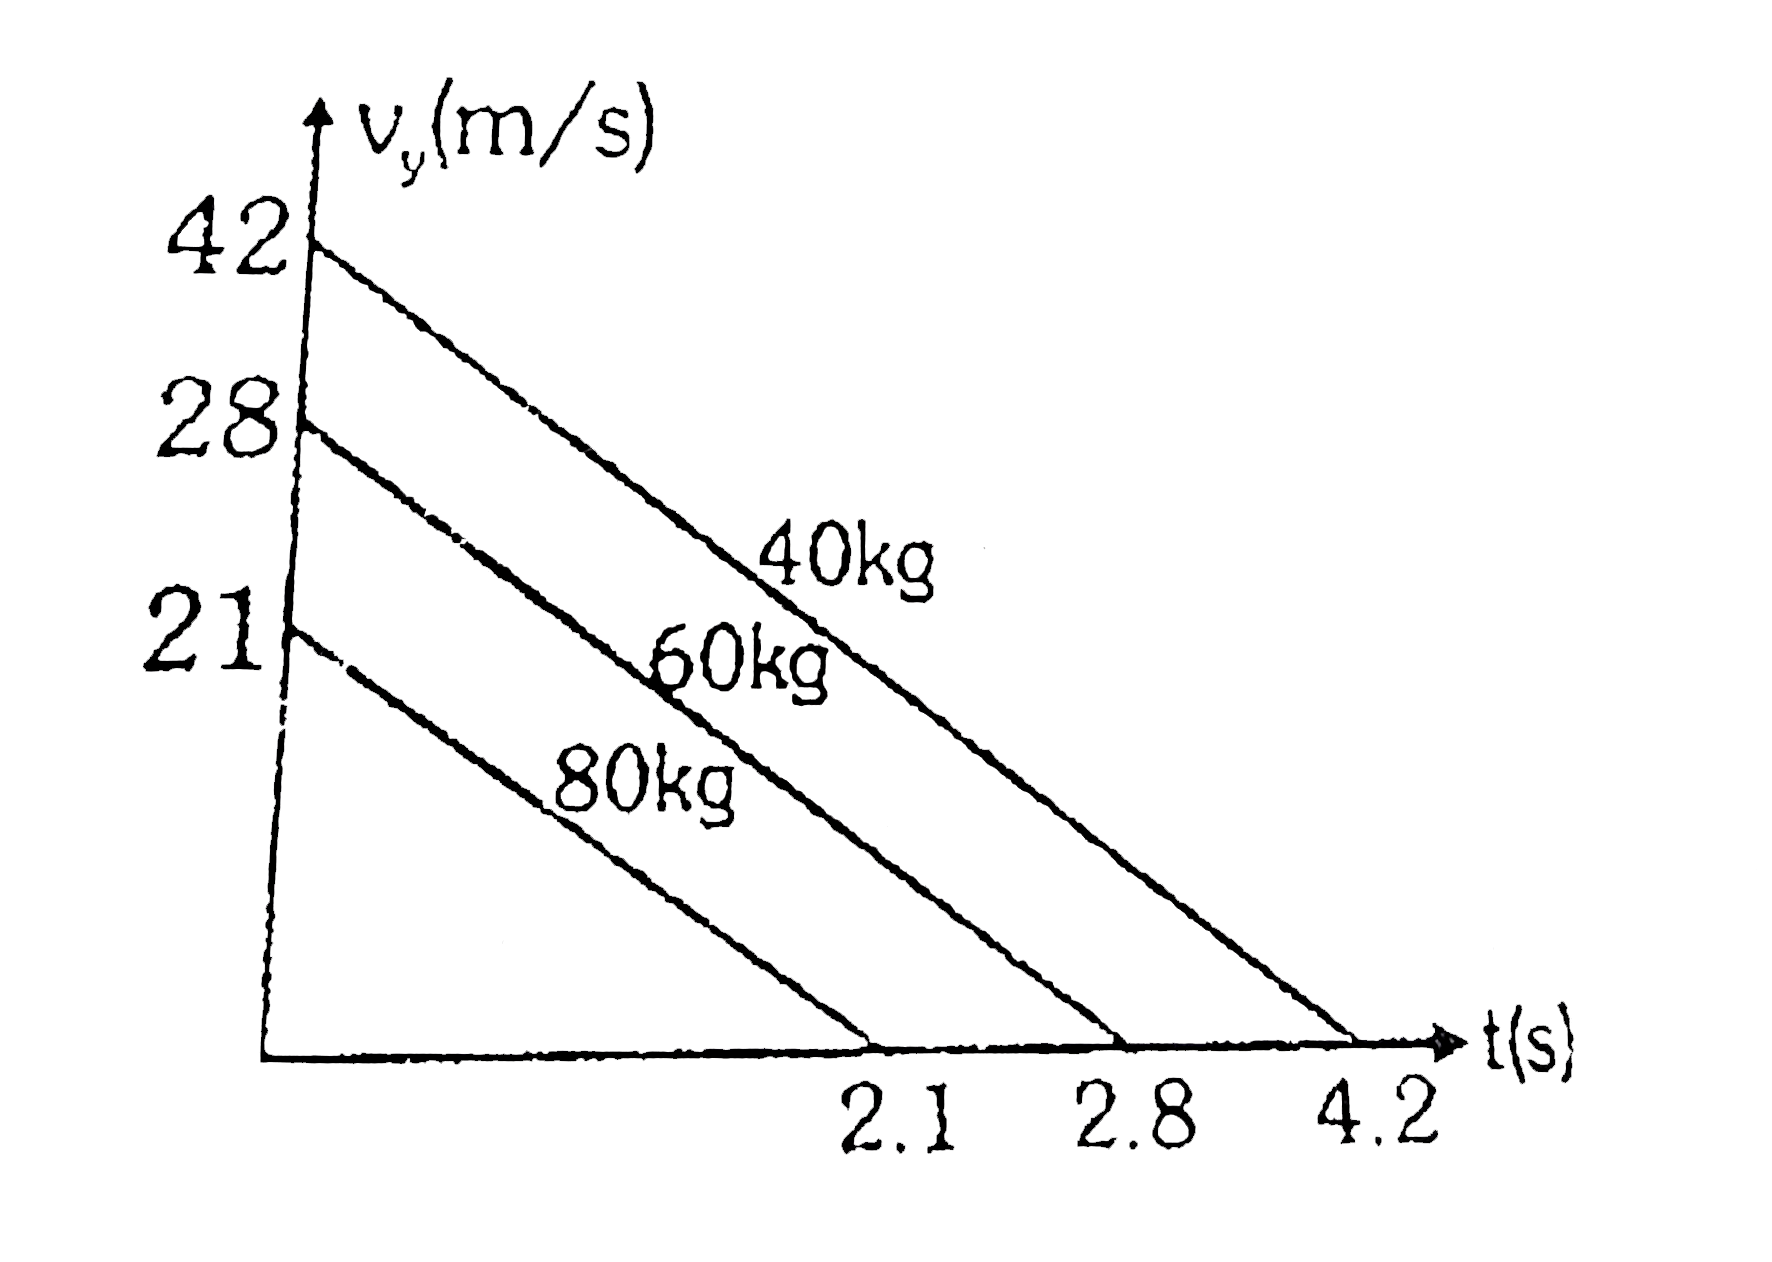
From figure 2, approximately how much time will it take for clown with a mass of 60 kg to reach the safety net located 10m below the height of the cannot?View Solution

