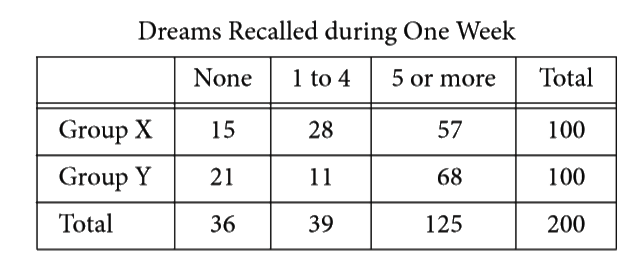
The data in the table above were produced by a sleep researcher studying the number of dreams people recall when asked to record their dreams for one week. Group X consisted of 100 people who observed early bedtimes, and Group Y consisted of 100 people who observed later bedtimes. If a person is chosen at random from those who recalled at least 1 dream, what is the probability that the person belonged to Group Y ?
68100
79100
79164
164200
The correct Answer is:C
Step by step video, text & image solution for The data in the table above were produced by a sleep researcher studying the number of dreams people recall when asked to record their dreams for one week. Group X consisted of 100 people who observed early bedtimes, and Group Y consisted of 100 people who observed later bedtimes. If a person is chosen at random from those who recalled at least 1 dream, what is the probability that the person belonged to Group Y ? by Maths experts to help you in doubts & scoring excellent marks in Class 12 exams.
Updated on:21/07/2023Similar Questions
The inequation represented by the graph given below is :
View SolutionThe inequation that best describes the graph given below is _________
View SolutionThe inequation that best describes the following graph is _________
View SolutionWhich inequations represent the shaded region in the given figure
View SolutionWhat is the distance OA for the square shown in figure :- ltimg src="https://d10lpgp6xz60nq.cloudfront.net/physics_images/ALN_PHY_R05_E01_015_Q01.png" width="80%"gt
View SolutionFrom the following figure, the correct observation is :- ltimg src="https://d10lpgp6xz60nq.cloudfront.net/physics_images/ALN_PHY_R03_E08_015_Q01.png" width="80%"gt
View SolutionWhat is the distance OA for the square shown in figure :- ltimg src="https://d10lpgp6xz60nq.cloudfront.net/physics_images/ALN_PHY_R05_E01_015_Q01.png" width="80%"gt
View Solution
