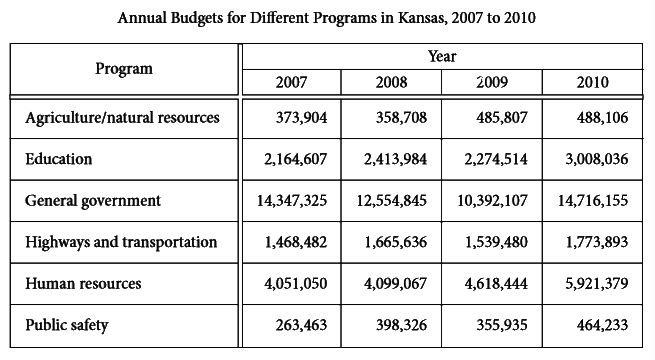
Annual Budgets for Different Programs in Kansas, 2007 to 2010

The table above lists the annual budget, in thousands of dollars, for each of six different state programs in Kansas from 2007 to 2010.
Which of the following best approximates the average rate of change in the annual budget for agriculture/natural resources in Kansas from 2008 to 2010 ?
$50,000,000 per year
$65,000,000 per year
$75,000,000 per year
$130,000,000 per year
The correct Answer is:B
Similar Questions
Match the following Column A to Column B

View SolutionThe inequation represented by the graph given below is :
View SolutionThe inequation that best describes the graph given below is _________
View SolutionThe inequation that best describes the following graph is _________
View SolutionWhich inequations represent the shaded region in the given figure
View SolutionFrom the following figure, the correct observation is :- ltimg src="https://d10lpgp6xz60nq.cloudfront.net/physics_images/ALN_PHY_R03_E08_015_Q01.png" width="80%"gt
View SolutionAnnual Budgets for Different Programs in Kansas, 2007 to 2010

The table above lists the annual budget, in thousands of dollars, for each of six different state programs in Kansas from 2007 to 2010.
Of the following, which program’s ratio of its 2007 budget to its 2010 budget is closest to the human resources program’s ratio of its 2007 budget to its 2010 budget?
View Solution
