A researcher conducted a survey to determine whether people in a certain large town prefer watching sports on television to attending the sporting event. The researcher asked 117 people who visited a local restaurant on a Saturday, and 7 people refused to respond. Which of the following factors makes it least likely that a reliable conclusion can be drawn about the sports-watching preferences of all people in the town?
Sample size
Population size
The number of people who refused to respond
Where the survey was given
To determine which factor makes it least likely that a reliable conclusion can be drawn about the sports-watching preferences of all people in the town, we need to analyze the context of the survey conducted by the researcher. Here’s a step-by-step breakdown of the reasoning:
Step 1: Identify the Sample
The researcher surveyed 117 people who visited a local restaurant on a Saturday. This sample size is significant, but we need to consider the context of how this sample was selected.
Hint: Think about whether the location and timing of the survey could influence the type of people surveyed.
Step 2: Consider the Refusal to Respond
Out of the 117 people surveyed, 7 refused to respond. This non-response could introduce bias, but it is not the primary concern regarding the reliability of the conclusion.
Hint: Reflect on how the refusal to respond might affect the overall results, but also consider other factors.
Step 3: Evaluate the Location of the Survey
The survey was conducted in a restaurant. This location may not represent the entire population of the town, as people who go to restaurants might have different preferences compared to those who do not.
Hint: Ask yourself if the location of the survey could skew the results towards a specific demographic.
Step 4: Analyze the Implications of the Survey Location
Since the survey was conducted in a restaurant, it is likely that the respondents are not a random sample of the entire town. People who frequent restaurants might have different sports-watching preferences than those who prefer to watch sports at home or do not go out to eat.
Hint: Consider how the characteristics of people who visit a restaurant might differ from those who do not.
Step 5: Conclusion
The factor that makes it least likely that a reliable conclusion can be drawn about the sports-watching preferences of all people in the town is the location of the survey (the restaurant). This location may not accurately reflect the preferences of the entire population of the town.
Final Answer: The location where the survey was conducted (the restaurant) makes it least likely that a reliable conclusion can be drawn about the sports-watching preferences of all people in the town.
The researcher surveyed 117 people who visited a local restaurant on a Saturday. This sample size is significant, but we need to consider the context of how this sample was selected.
Out of the 117 people surveyed, 7 refused to respond. This non-response could introduce bias, but it is not the primary concern regarding the reliability of the conclusion.
The survey was conducted in a restaurant. This location may not represent the entire population of the town, as people who go to restaurants might have different preferences compared to those who do not.
Since the survey was conducted in a restaurant, it is likely that the respondents are not a random sample of the entire town. People who frequent restaurants might have different sports-watching preferences than those who prefer to watch sports at home or do not go out to eat.
The factor that makes it least likely that a reliable conclusion can be drawn about the sports-watching preferences of all people in the town is the location of the survey (the restaurant). This location may not accurately reflect the preferences of the entire population of the town.
Similar Questions
किसी कॉलोनी में किये गए सर्वेक्षण से प्राप्त निम्नलिखित आँकड़ो पर विचार कीजिये : खेलों को देखना अधिक पसंद किया जाता हैं या उनमे भाग लेना ?

View SolutionConsider this data collected from a survey of a colony.

Which is more preferred, watching or participating in sports?
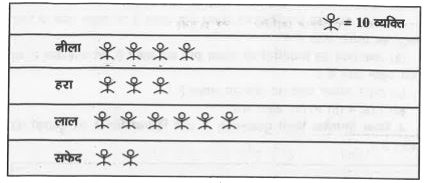
View Solutionकिसी मोहल्ले के व्यक्तियों द्वारा पसंद किए गए फ्रिज़ों (Fridges) के रंगों की सूचना निम्न लिखित चित्रआलेख द्वारा दर्शाई गई है :

कितने व्यक्ति लाल रंग पसंद करते हैं ?
View SolutionConsider this data collected from a survey of a colony

Which is more preferred, watching or participating in sports ?
View SolutionSome people like to watches television all day.
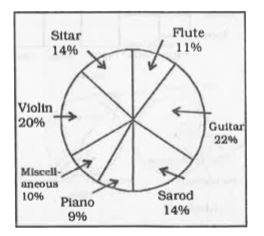
View SolutionThe following pie-chart shows the preference of musical instruments of 60,000 people surveyed over whole India. Examine the chart and answer the questions.

If 1623% of the people who prefer Piano, would go with the people who prefer Flute, the percentage of people who prefer Flute would have been
View SolutionThis pie-chart shows the results of an online survey in which people were asked about their favorite author. The favorite author of most of the people surveyed is sports?
View SolutionThis pie-chart shows the results of an online survey in which people were asked about their favorite author. What is the total number of people who responded to the survey?
View Solution
