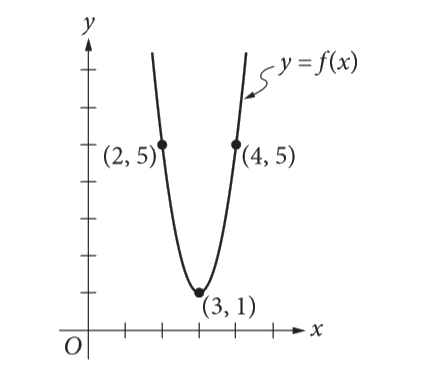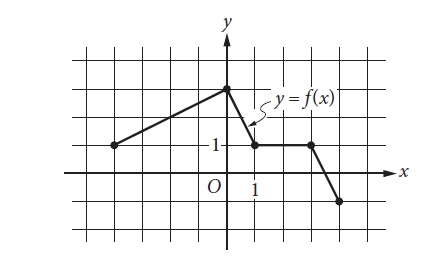
The complete graph of the function f is shown in the xy-plane above. Which of the following are equal to 1 ?
I. f(−4)
II. f(32)
III. f(3)
III only
I and III only
II and III only
I, II, and III
Choice D is correct. The definition of the graph of a function f in the xyplane is the set of all points (x, f (x)). Thus, for −4 ≤ a ≤ 4, the value of f(a) is 1 if and only if the unique point on the graph of f with x-coordinate a has y-coordinate equal to 1. The points on the graph of f with x-coordinates −4, 32 , and 3 are, respectively, (−4, 1), (32,1) , and (3, 1). Therefore, all of the values of f given in I, II, and III are equal to 1.
Choices A, B, and C are incorrect because they each omit at least one value of x for which f(x) = 1.
Similar Questions
Knowledge Check
- Question 1 - Select One
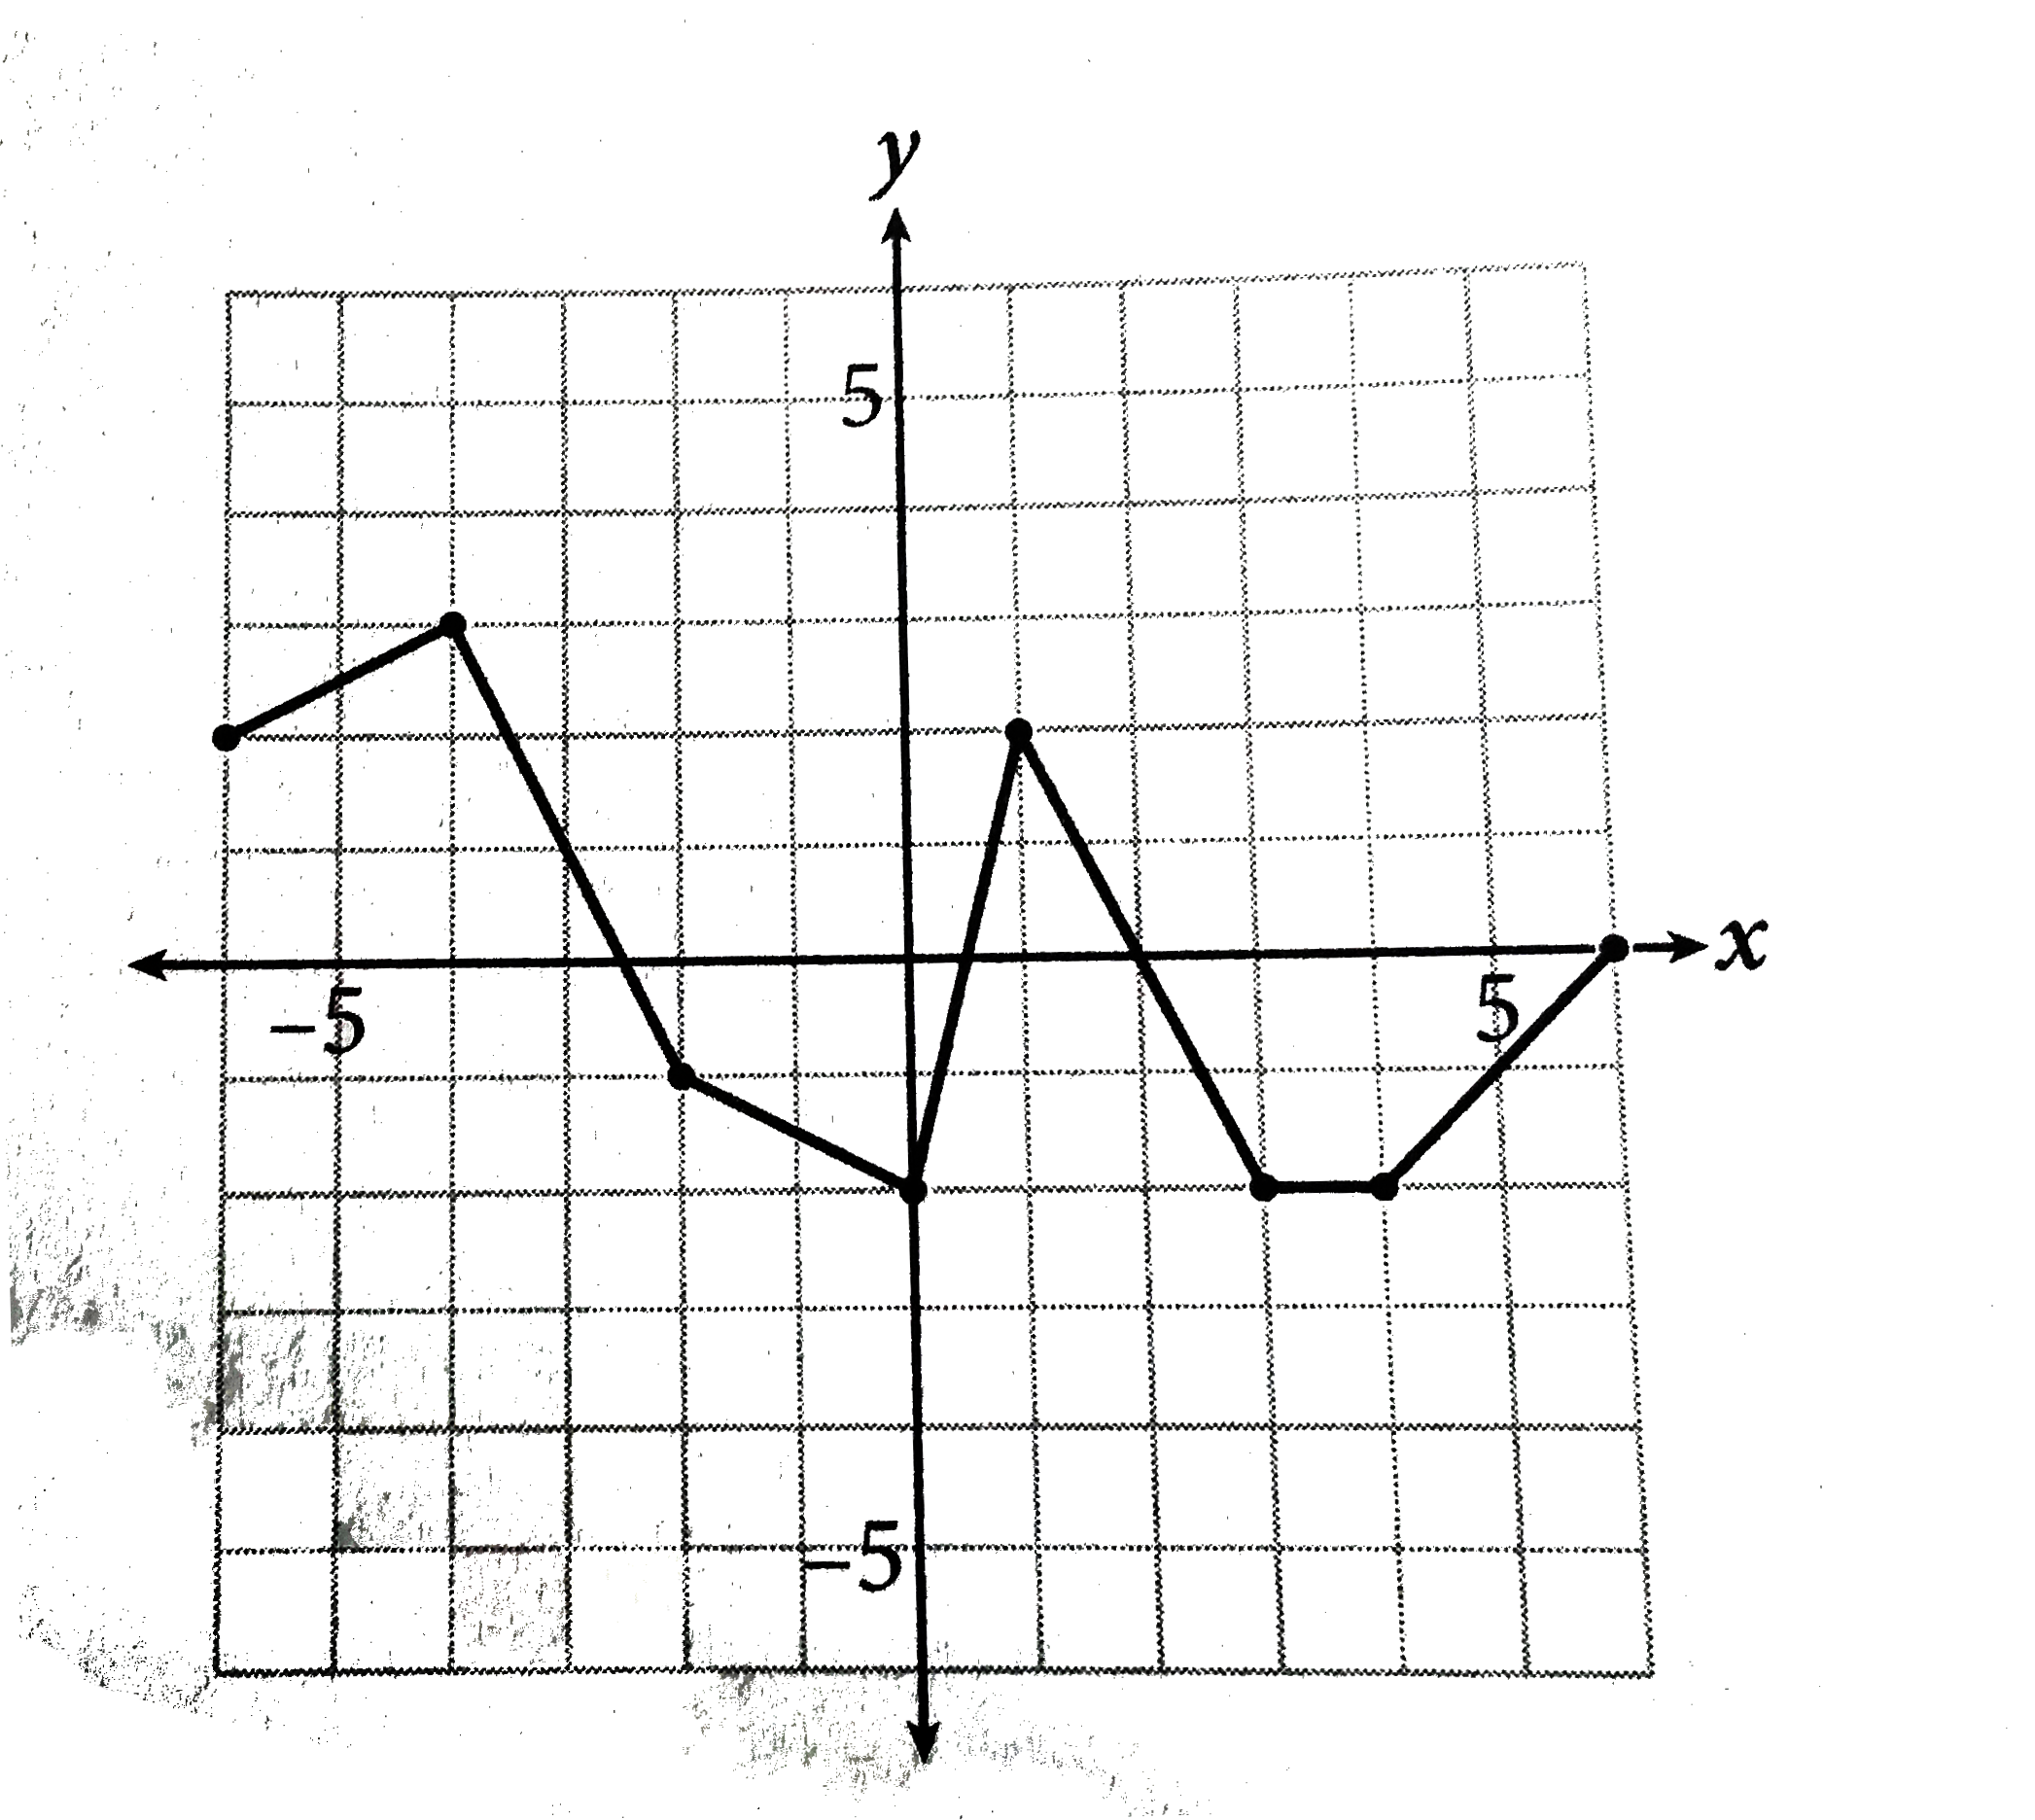
The complete graph of the function f is shown in the xy-plane above. For what value of x is the value of f(x) at its minimum?A−5B−3C−2D3 - Question 2 - Select One
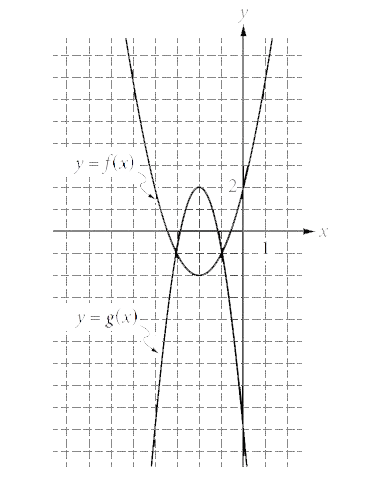
Graphs of the functions f and g are shown in the xy-plane above. For which of the following values of x does f(x)+g(x)=0 ?A−3B−2C−1D0 - Question 3 - Select One
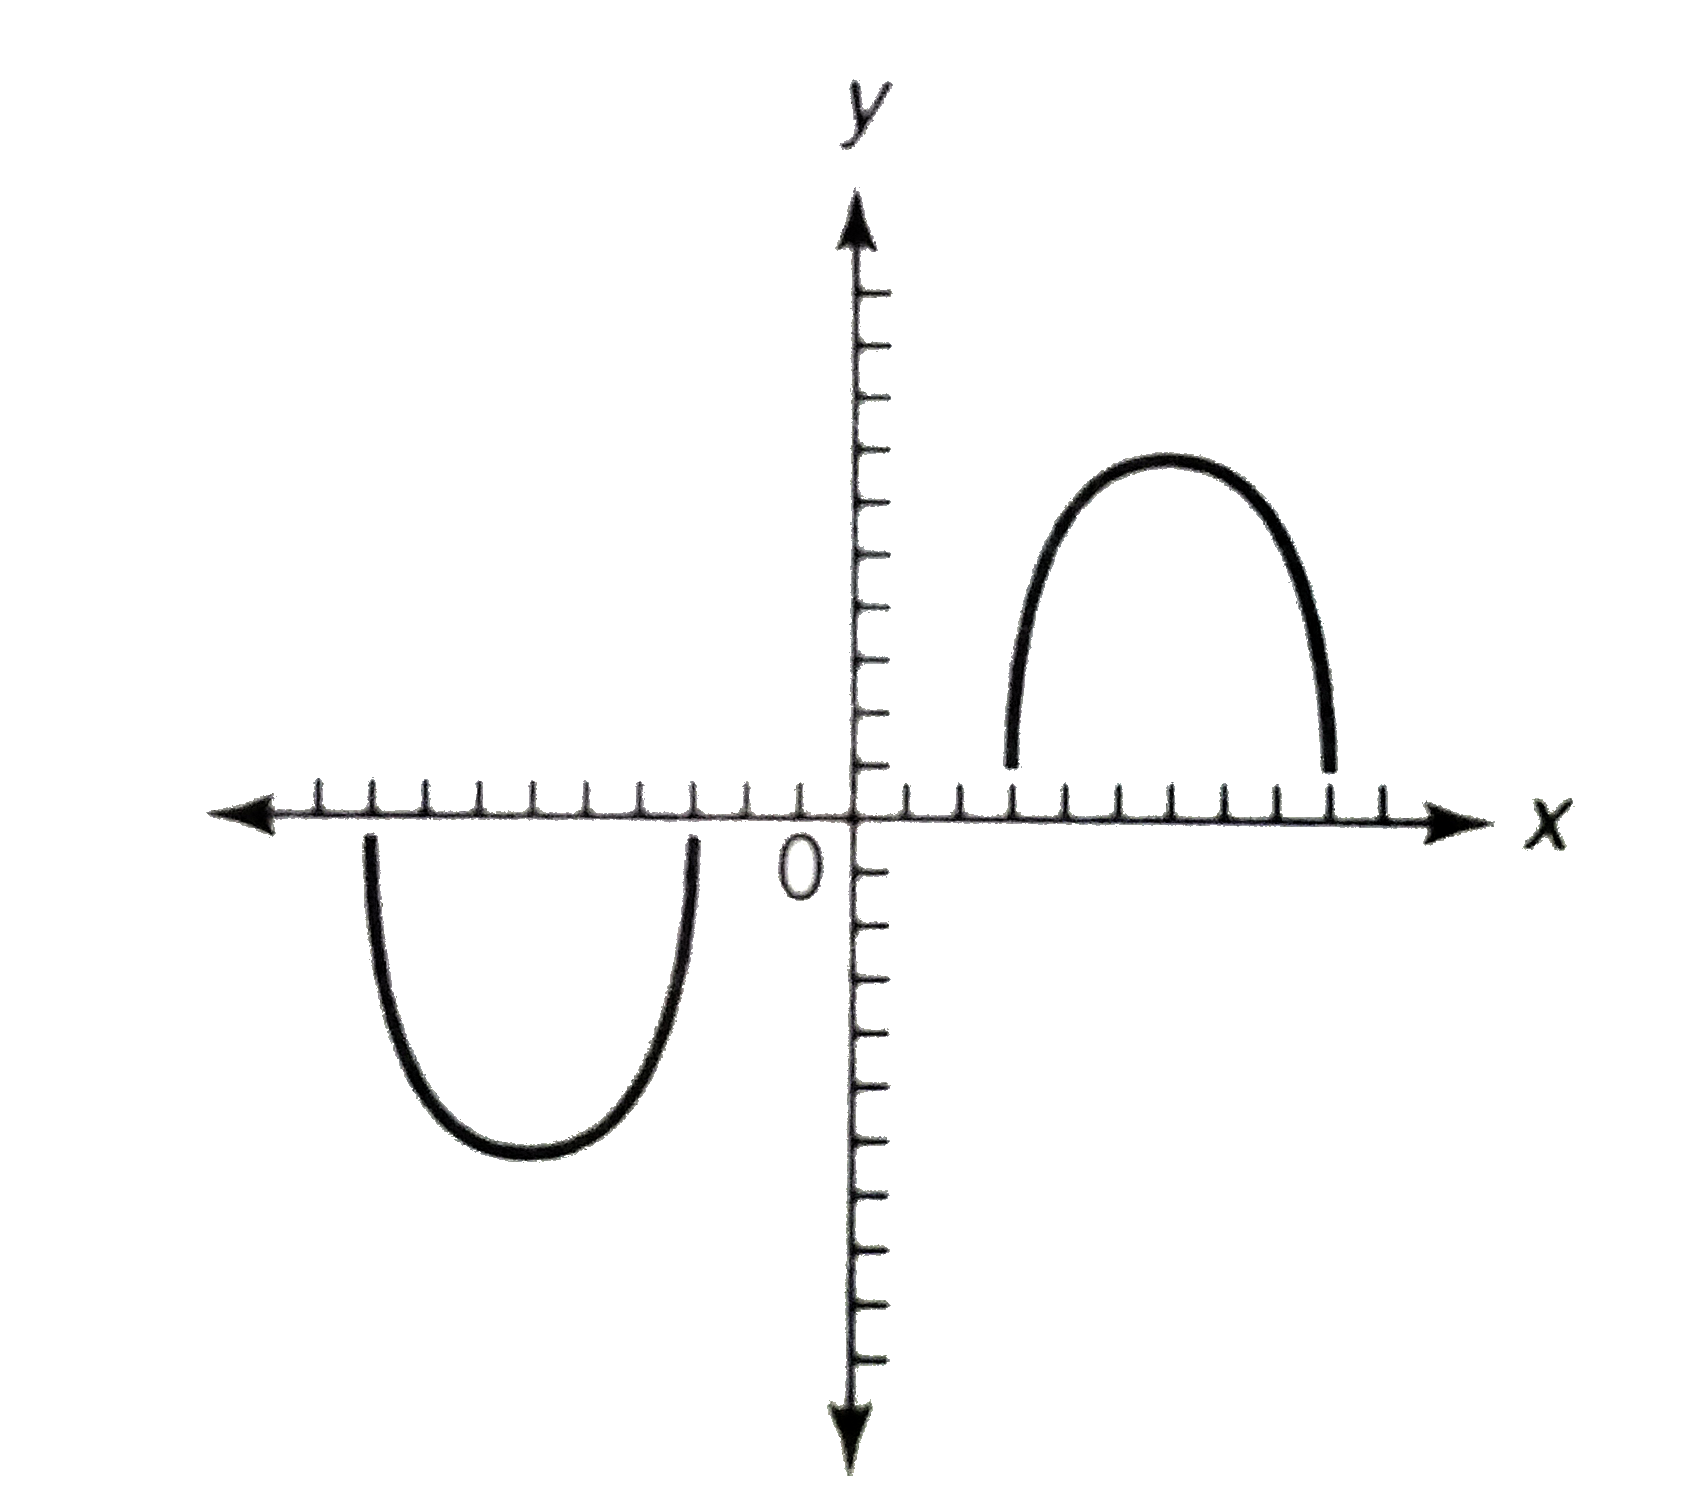
The graph of the function f is shown above. Which of the following could represent the graph of y=|f(x)|?A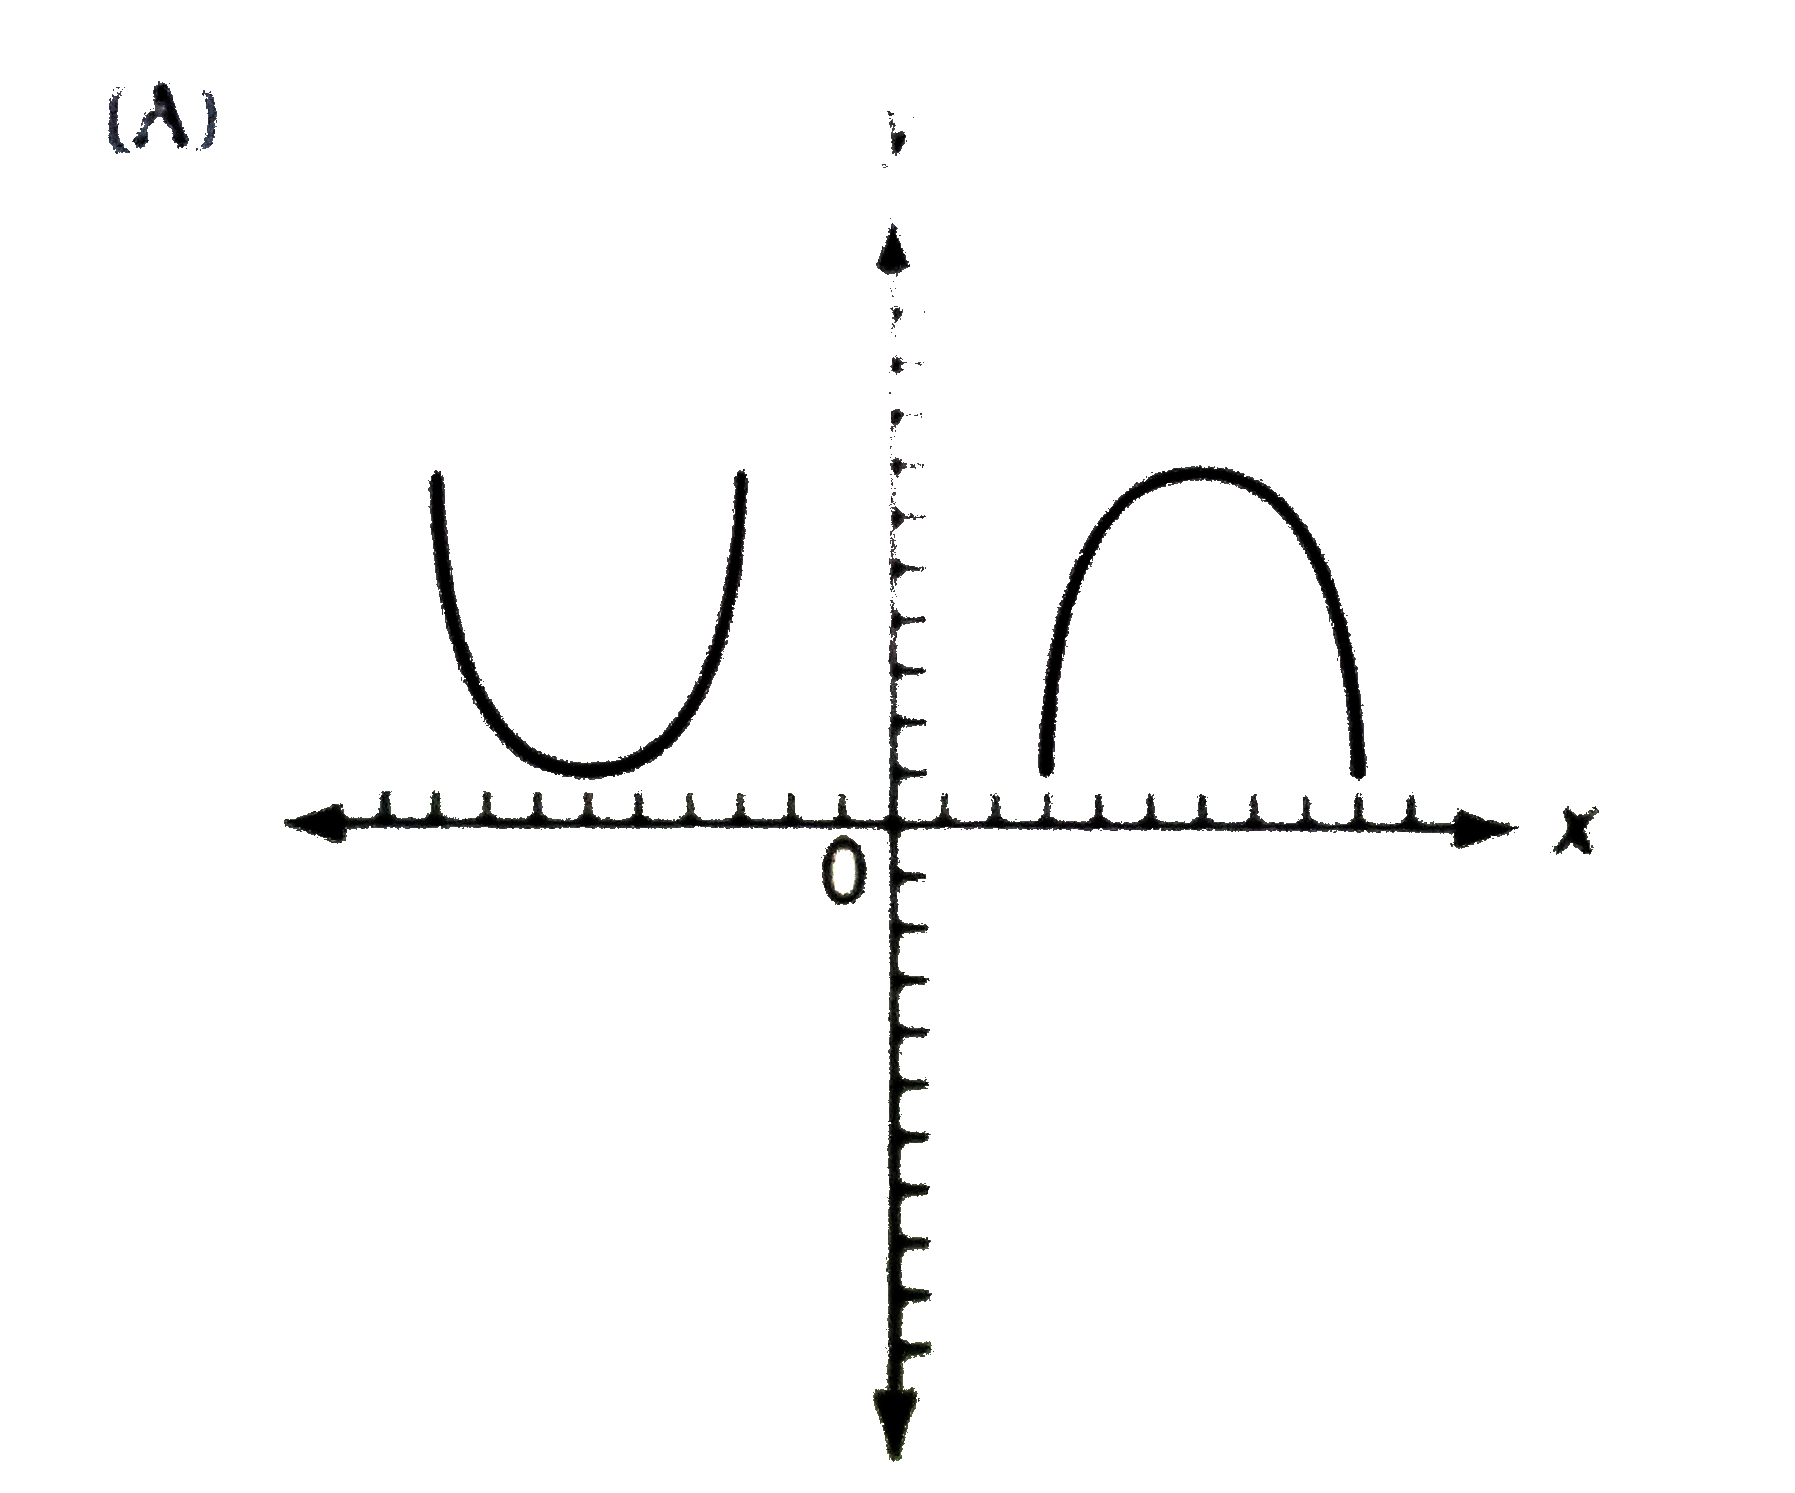 B
B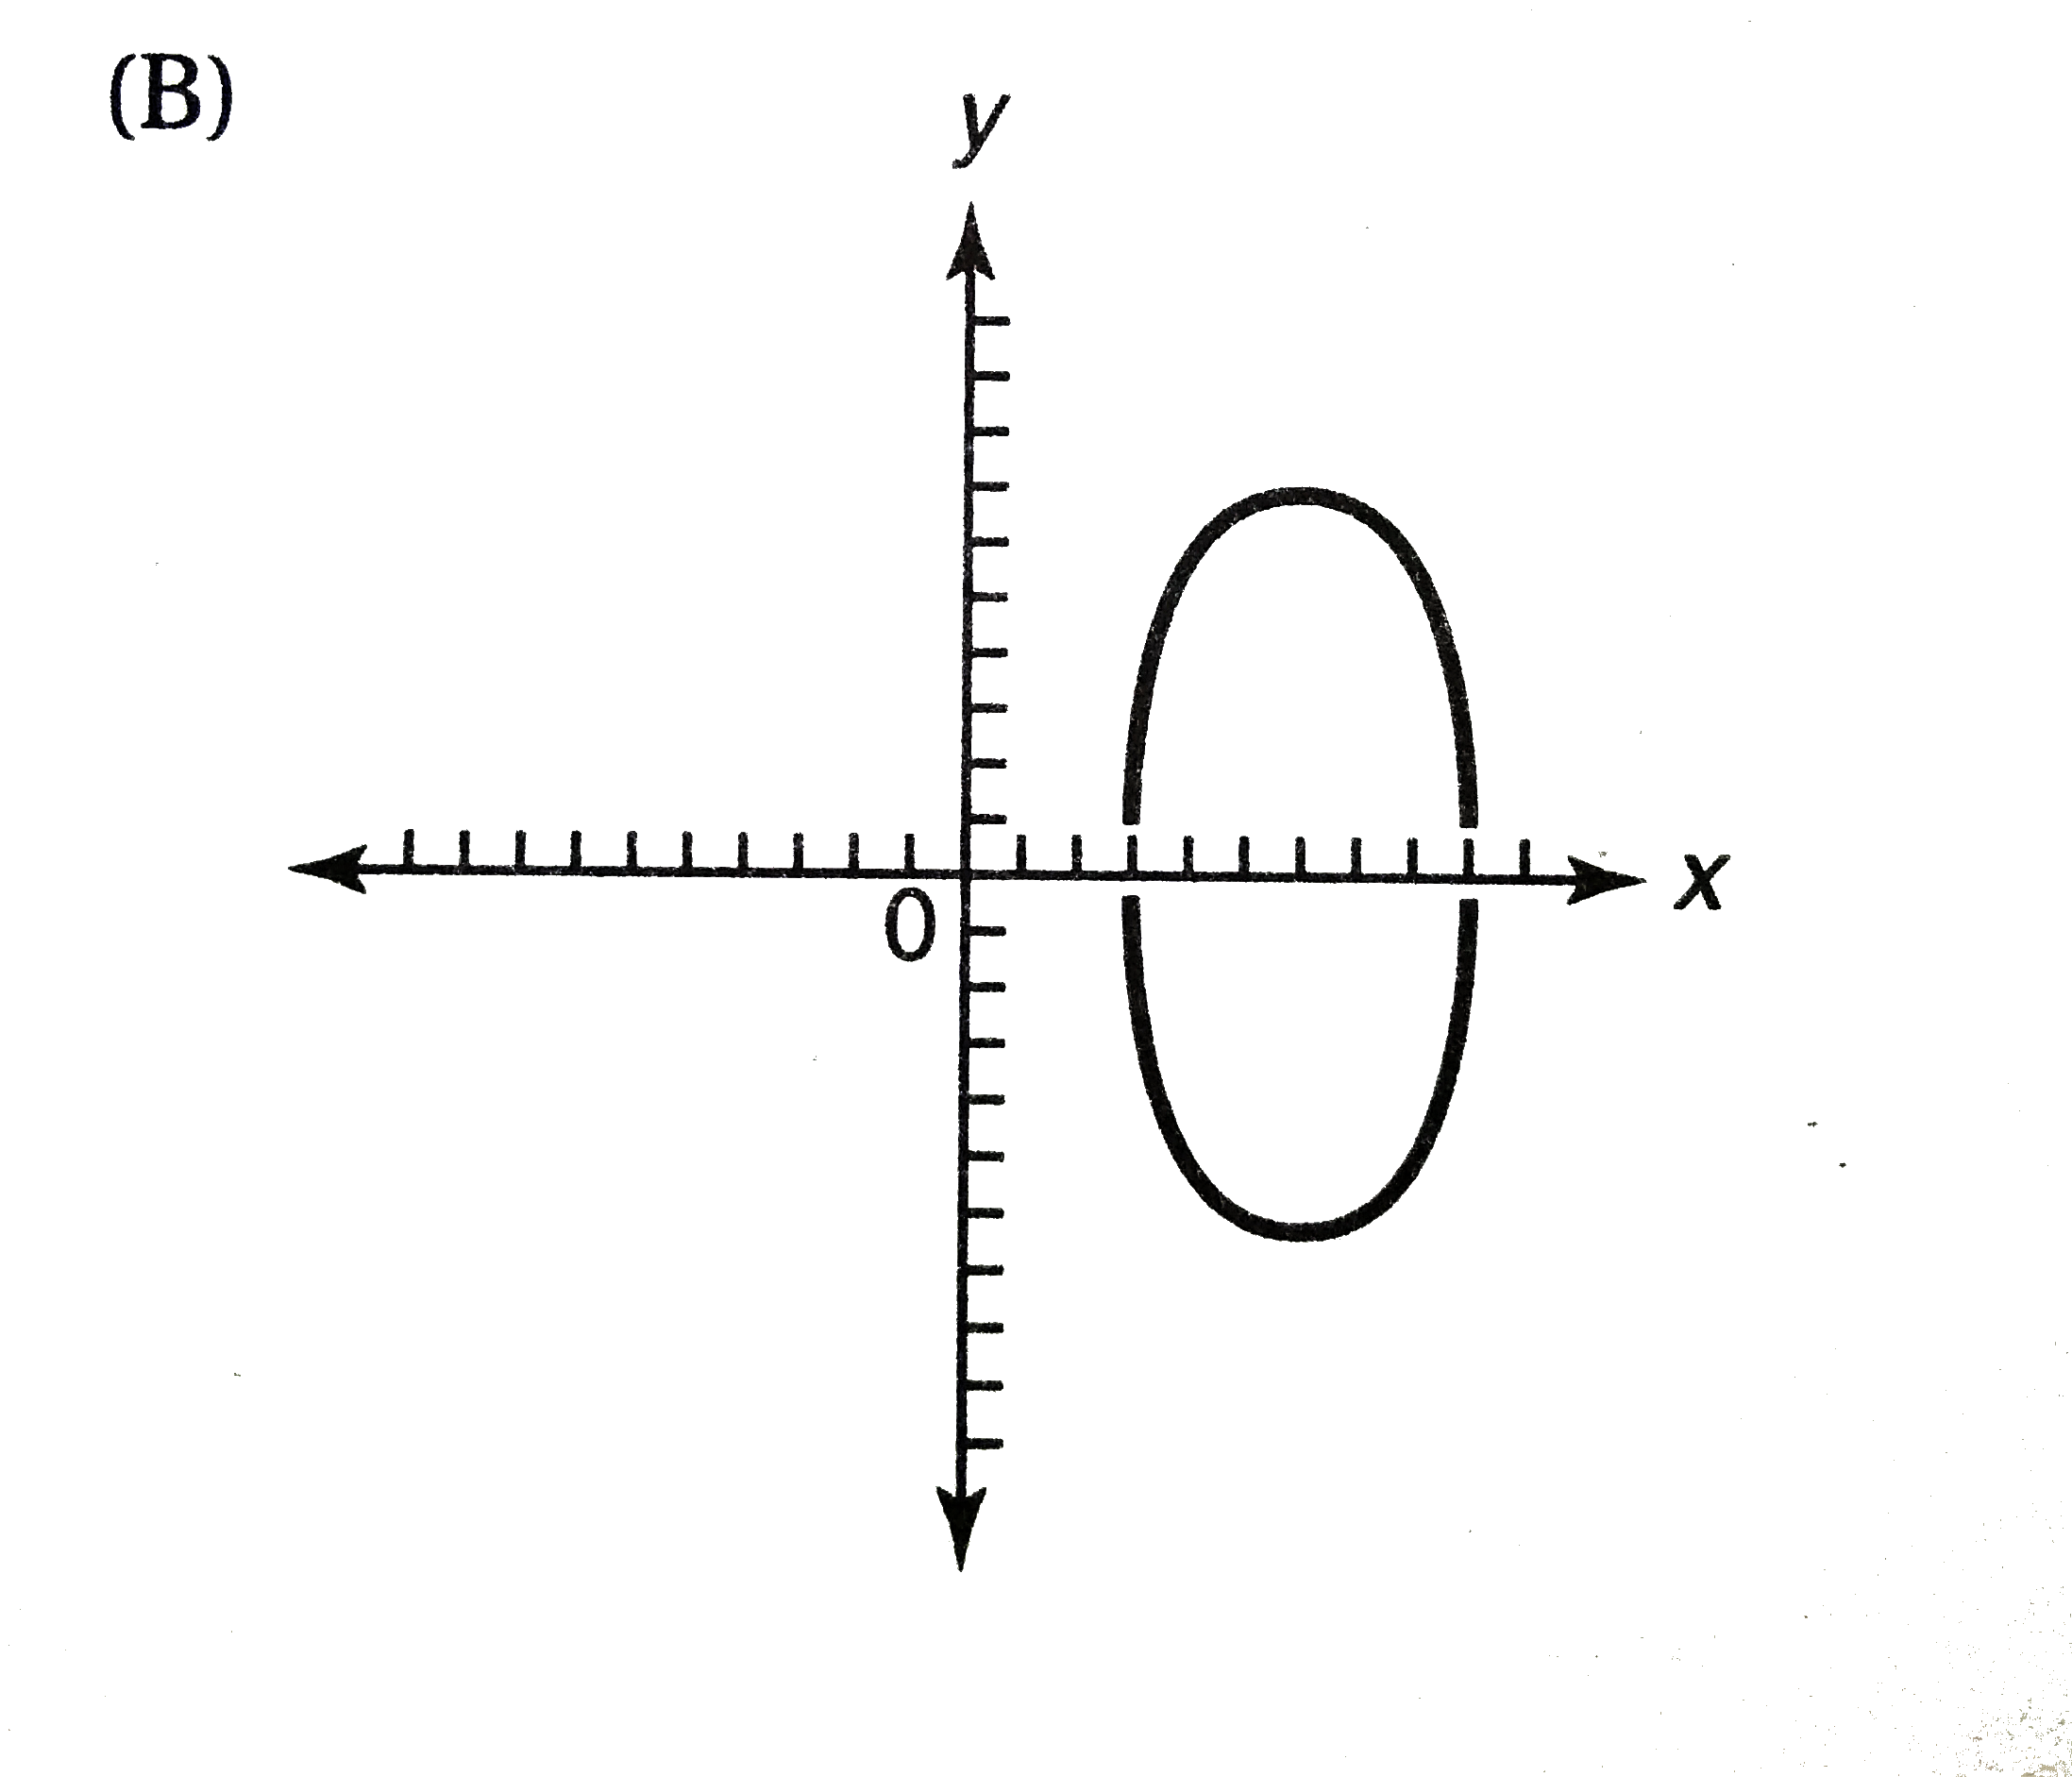 C
C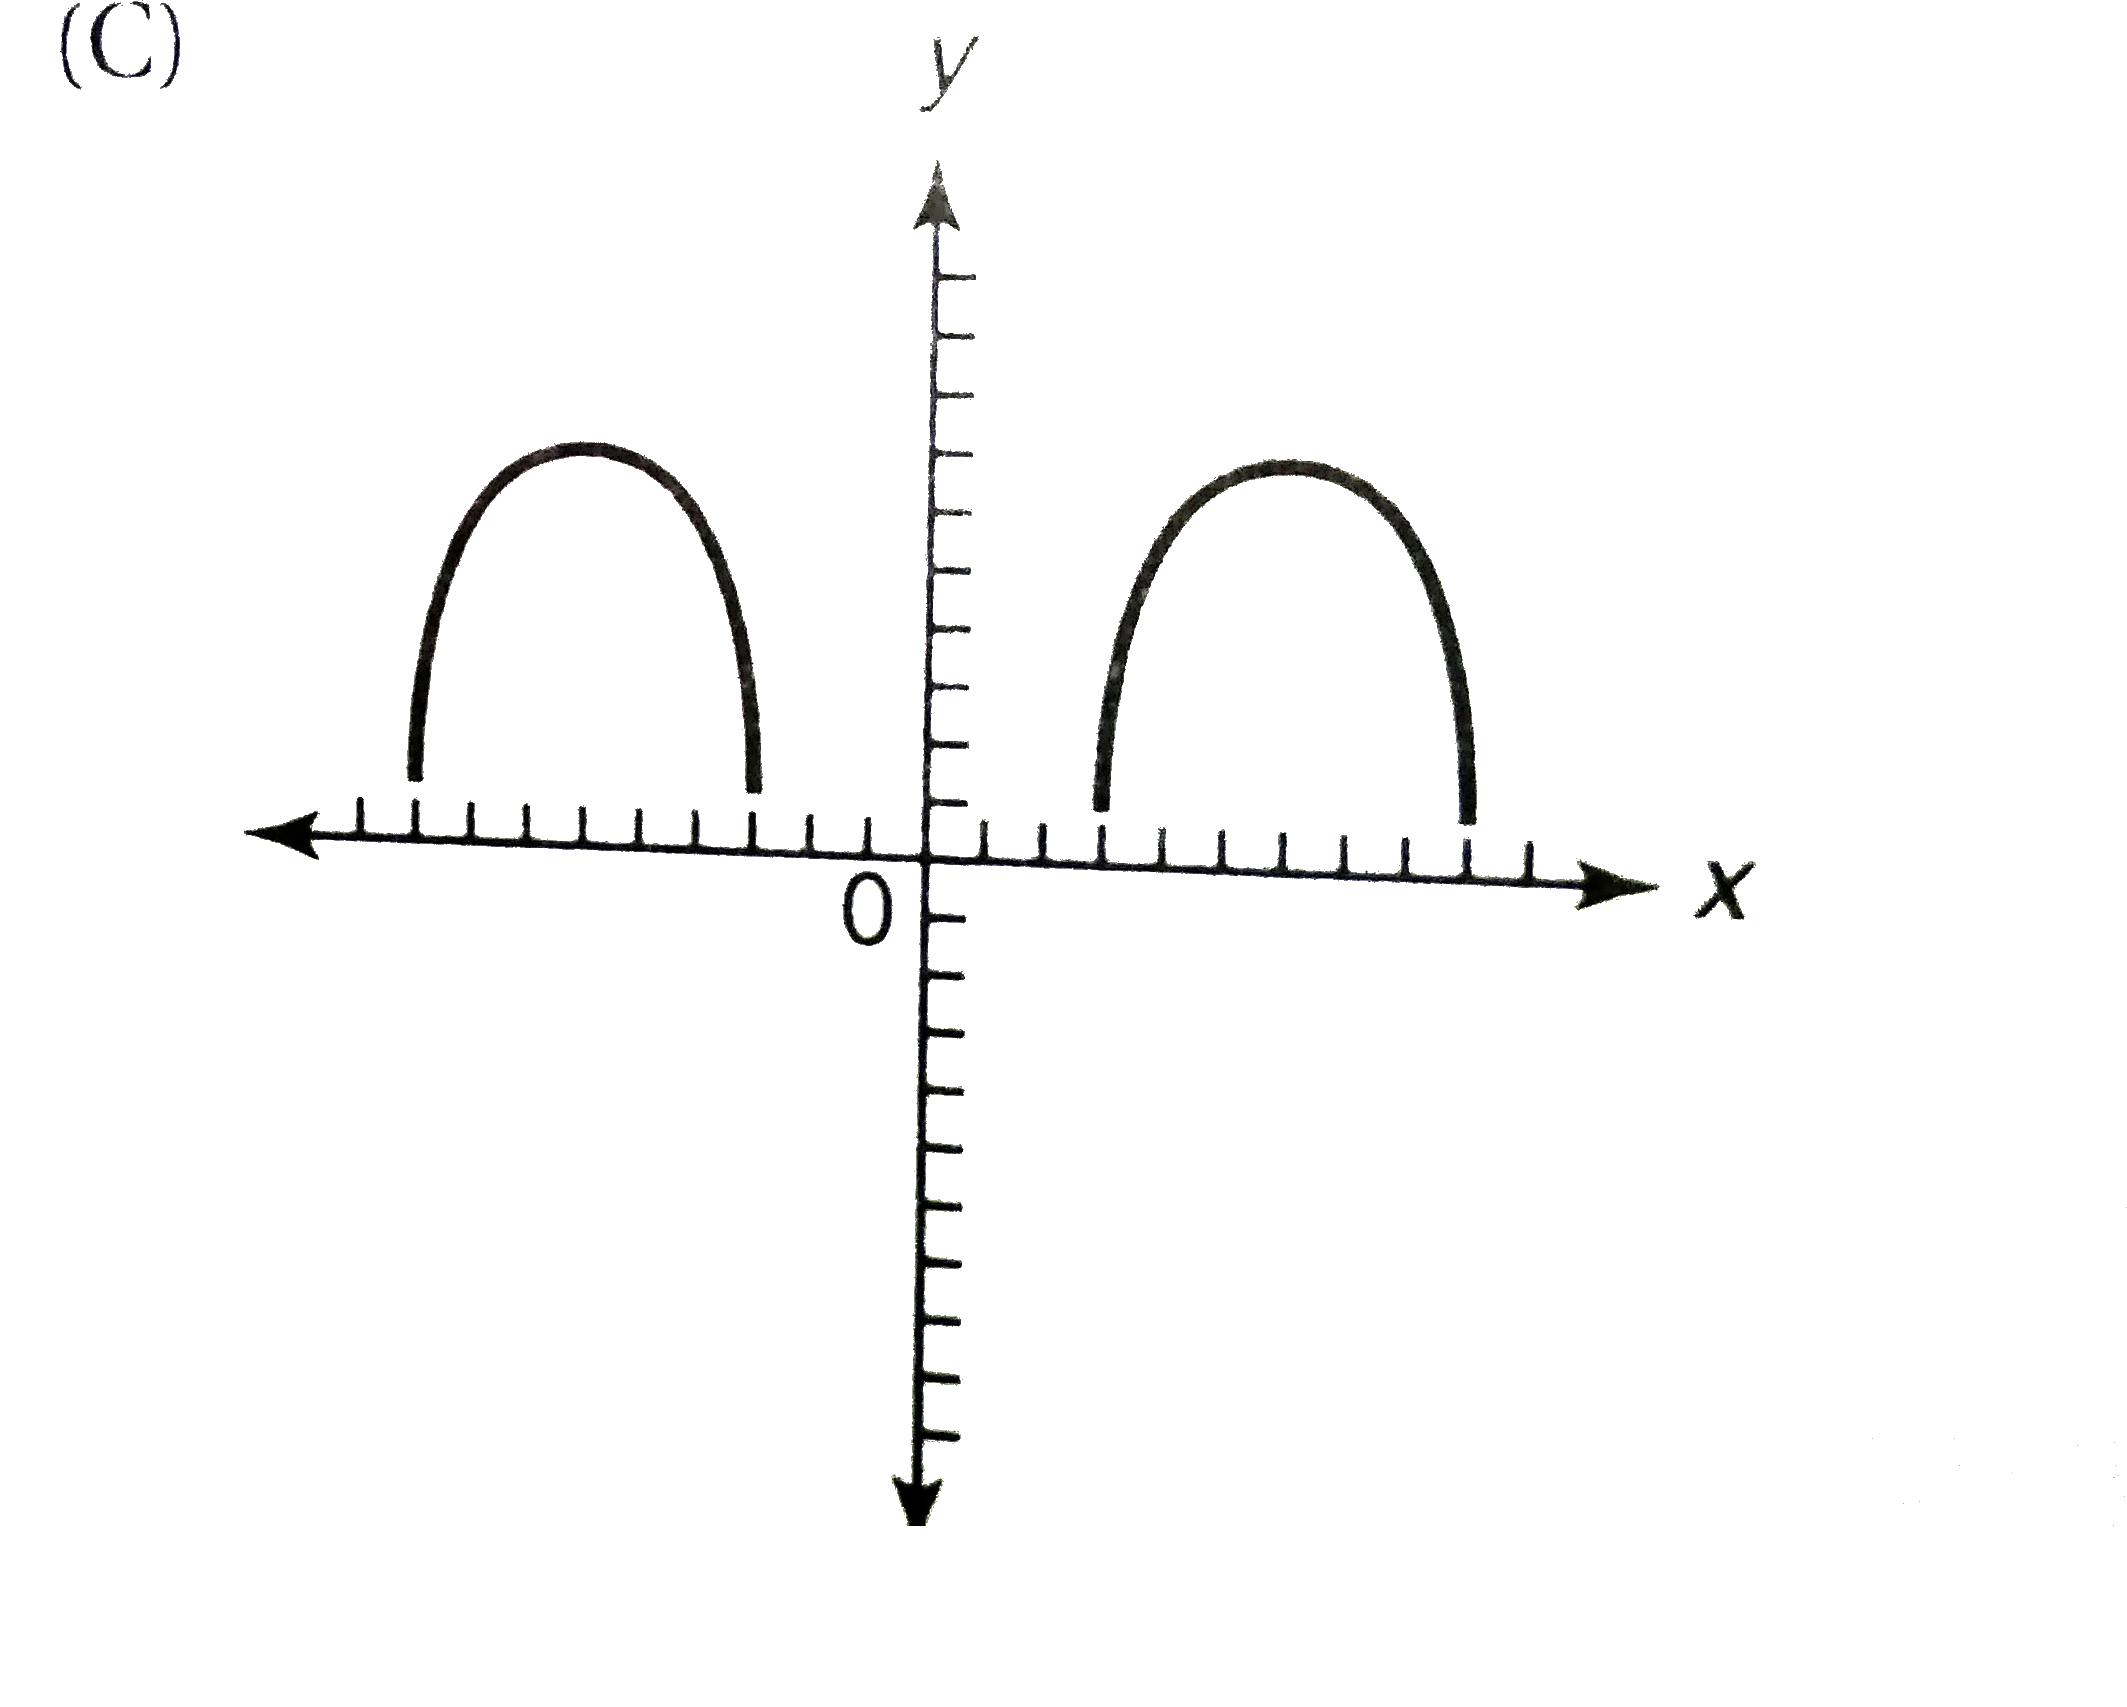 D
D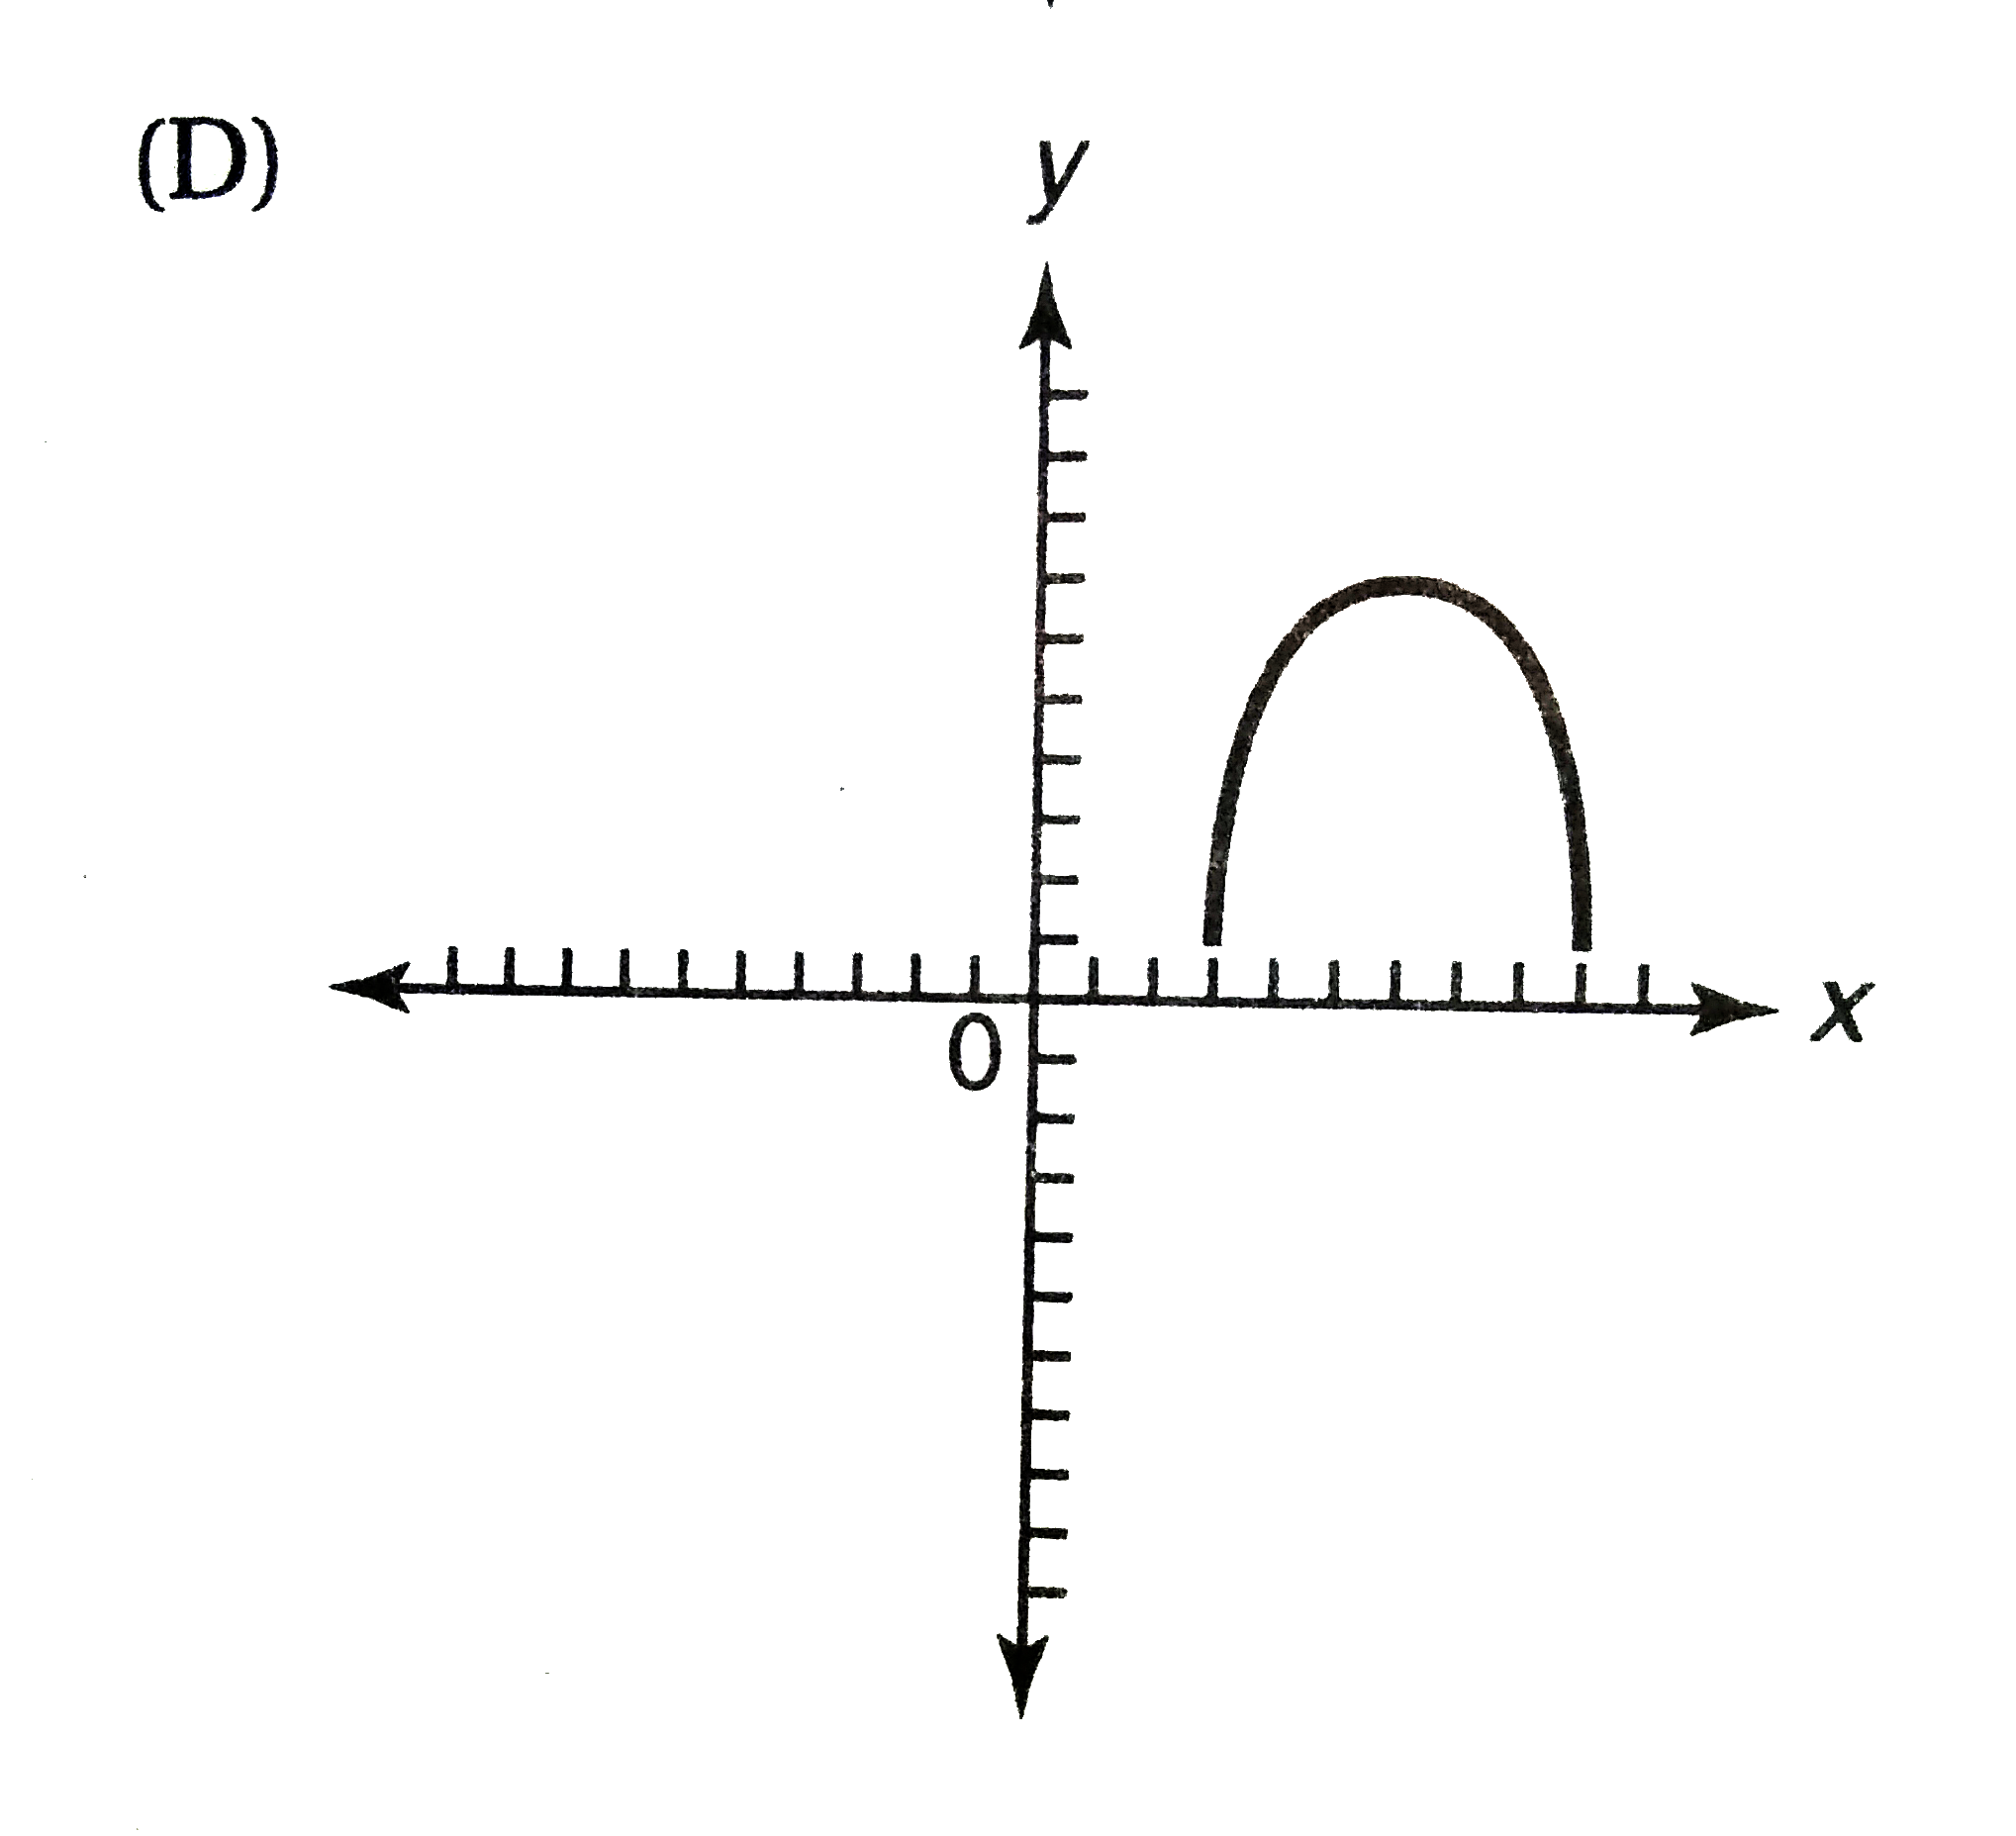
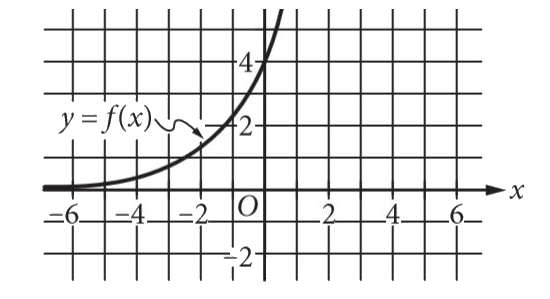
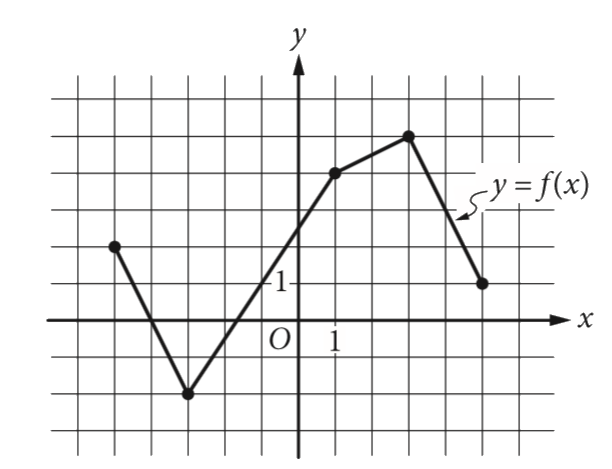
The graph of y = f (x) is shown in the xy -plane. What is the value of f (0) ?View Solution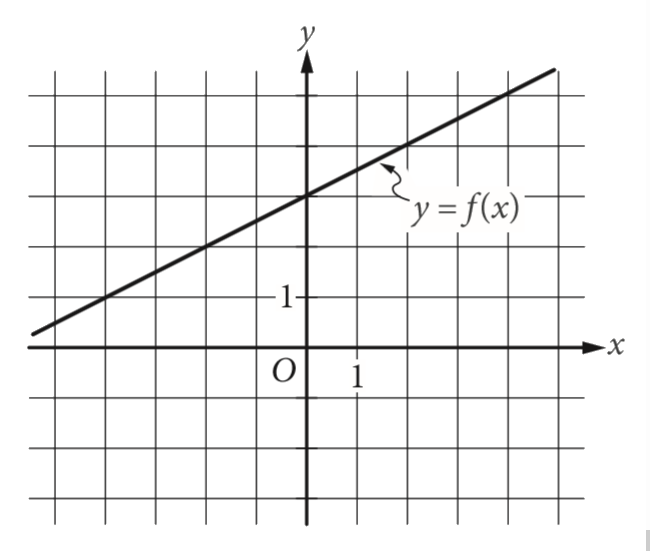
The graph of the linear functions f is shown in the xy-plane above. The slope of the graph of the linear function g is 4 times the slope of the graph of f. IF the graph of g passes through the point (0,-4) what is the value of g(9)?View SolutionIn the xy-plane, the graph of function f has x-intercepts at -3, -1, and 1. Which of the following could define f ?
View Solution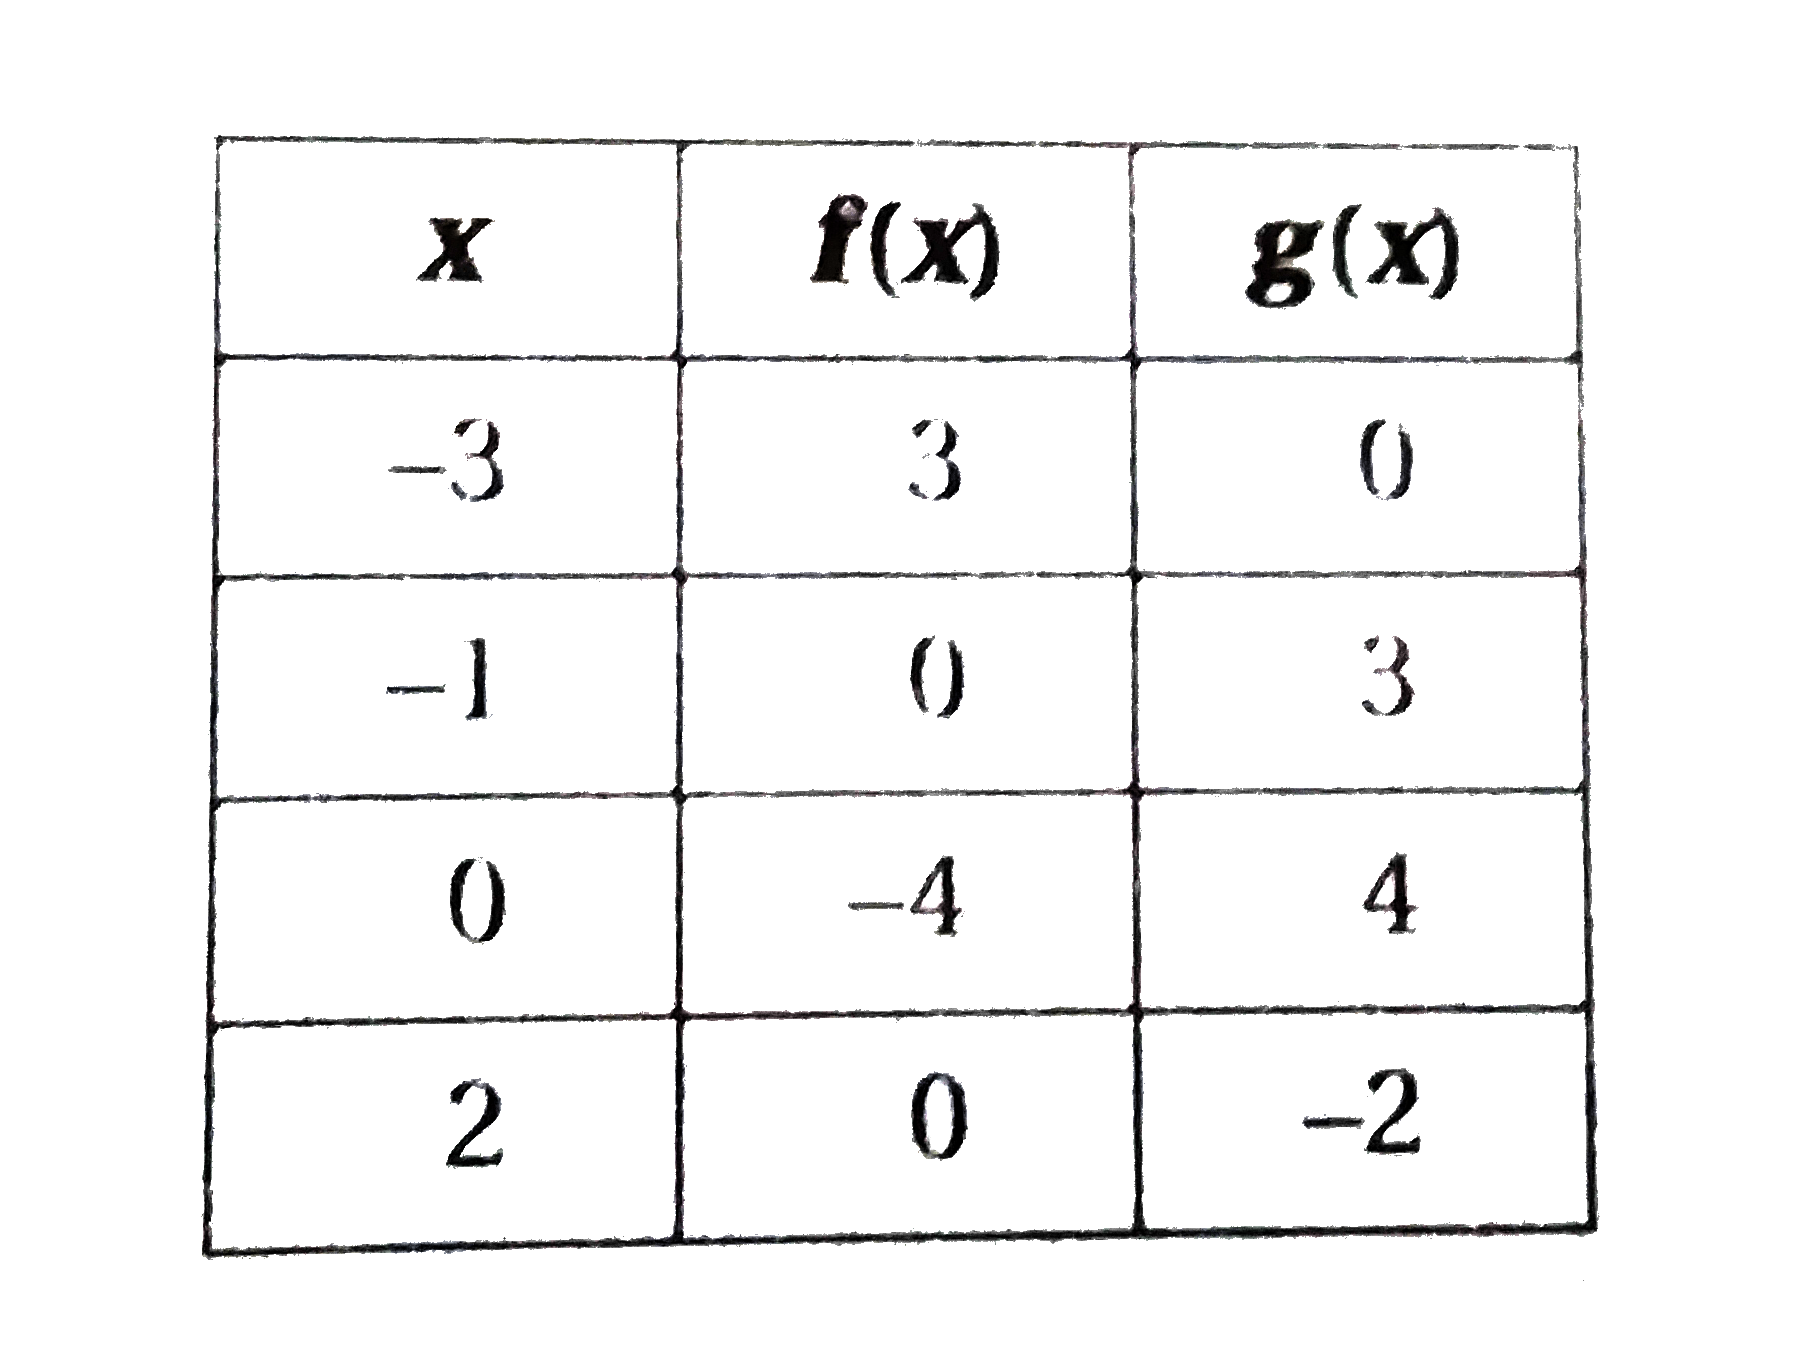
Several values of x, and the corresponding values for polynomial functions f and g are shown in the table above. Which of the following statements is true?
I. f(0)+g(0)=0
II. f(x) is divisible by x+2
III. g(x) is divisible by x+3.View Solution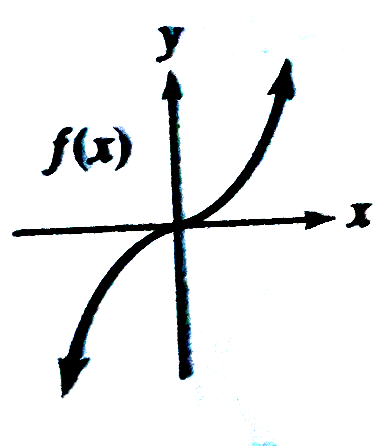
The graph of f(x) is shown above , Which of the following represents the graph of f(x-3) ?View Solution


