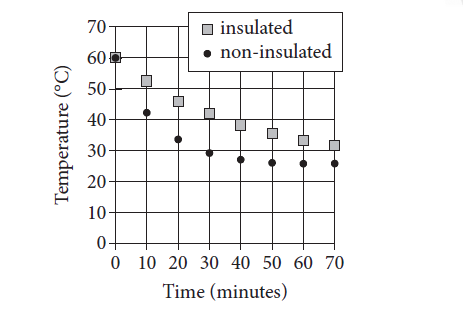
Two samples of water of equal mass are heated to 60 degrees Celsius (°C). One sample is poured into an insulated container, and the other sample is poured into a non-insulated container. The samples are then left for 70 minutes to cool in a room having a temperature of 25°C. The graph above shows the temperature of each sample at 10-minute intervals. Which of the following statements correctly compares the average rates at which the temperatures of the two samples change?
In every 10-minute interval, the magnitude of the rate of change of temperature of the insulated sample is greater than that of the non-insulated sample.
In every 10-minute interval, the magnitude of the rate of change of temperature of the non-insulated sample is greater than that of the insulated sample.
In the intervals from 0 to 10 minutes and from 10 to 20 minutes, the rates of change of temperature of the insulated sample are of greater magnitude, whereas in the intervals from 40 to 50 minutes and from 50 to 60 minutes, the rates of change of temperature of the non-insulated sample are of greater magnitude.
In the intervals from 0 to 10 minutes and from 10 to 20 minutes, the rates of change of temperature of the non-insulated sample are of greater magnitude, whereas in the intervals from 40 to 50 minutes and from 50 to 60 minutes, the rates of change of temperature of the insulated sample are of greater magnitude.
Choice D is correct. According to the graph, in the interval from 0 to 10 minutes, the non-insulated sample decreased in temperature by about 18°C, while the insulated sample decreased by about 8°C, in the interval from 10 to 20 minutes, the non-insulated sample decreased in temperature by about 9°C, while the insulated sample decreased by about 5°C, in the interval from 40 to 50 minutes, the non-insulated sample decreased in temperature by about 1°C, while the insulated sample decreased by about 3°C, and in the interval from 50 to 60 minutes, the non-insulated sample decreased in temperature by about 1°C, while the insulated sample decreased by about 2°C. The description in choice D accurately summarizes these rates of temperature change over the given intervals. (Note that since the two samples of water have equal mass and so must lose the same amount of heat to cool from 60°C to 25°C, the faster cooling of the non-insulated sample at the start of the cooling process must be balanced out by faster cooling of the insulated sample at the end of the cooling process.)
Choices A, B, and C are incorrect. None of these descriptions accurately compares the rates of temperature change shown in the graph for the 10-minute intervals.
Similar Questions
Water at 100∘C cools in 10 minutes to 88∘C in a room temperature of 25∘C .Find the temperature of water after 20 minutes.
View SolutionThe mean speed of the molecules of a hydrogen sample equals the mean speed of the molecules of a helium sample. Calculate the ratio of the temperature of the hydrogen sample to the temperature of the helium sample.
View Solution
Knowledge Check
A block of ice, initially at −20∘C, is heated a steady rate until the temperature of the sample reaches 120∘C. Which of the following graphs best illustrates the temperature of the sample as a function of time?
A B
B C
C D
D
A sample of a gas is kept in a closed container and temperature is increased. Which of the following is true?
APressure is increased because momentum transferred per collision to wall is increased.BPressure is decreasedCPressure is increased because frequency of collision is decreasedDBoth (A) and (C) are correctA sample contains two substances and has uniform properties. The sample is
Aa compoundBa heterogeneous mixtureCan elementDa homogeneous mixture.
The mean speed of the molecules of a hydrogen sample equals the mean speed of the molecules of a helium sample. Calculate the ratio of the temperature of the hydrogen sample to the temperature of the helium sample.
View SolutionThe mean speed of the molecules of a hydrogen sample equals the mean speed of the molecules of a helium sample. Calculate the ratio of the temperature of the hydrogen sample to the temperature of the helium sample.
View SolutionTwo samples of sulphur are heated separately startirig at 60∘C. One sample is found to melt at 114∘C and the other one melts at 119∘C. How do you account for this
View SolutionA sample of water contains sodium chlorde. It is
View SolutionA sample of air containing certain amount of water vapour is saturated at a particular temperatures. If the temperature of the sample is raised further, then
View Solution
