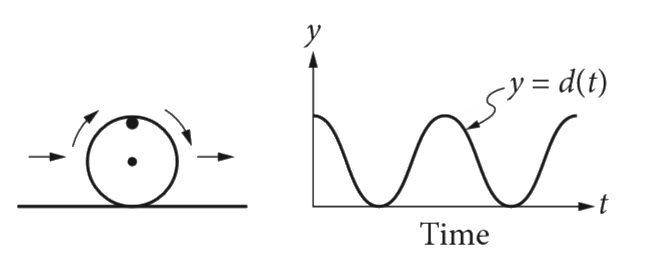
The figure on the left above show saw heel with a mark on its rim. The wheel is rolling on theground at a constant rate along a level straight path from a starting point to an ending point. The graph of y=d(t)on the right could represent which of the following as a function of time from when the wheel began to roll?
The speed at which the wheel is rolling
The distance of the wheel from its starting point
The distance of the mark on the rim from the centre of the wheel
The distance of the mark on the rim from the ground
Step by step video & image solution for The figure on the left above show saw heel with a mark on its rim. The wheel is rolling on theground at a constant rate along a level straight path from a starting point to an ending point. The graph of y=d(t)on the right could represent which of the following as a function of time from when the wheel began to roll? by Maths experts to help you in doubts & scoring excellent marks in Class 12 exams.
Updated on:21/07/2023Similar Questions
The inequation that best describes the following graph is _________
View SolutionWhich inequations represent the shaded region in the given figure
View SolutionWhich of the following statement is not correc for following straight line graph :-
ltimg src="https://d10lpgp6xz60nq.cloudfront.net/physics_images/ALN_PHY_R04_E01_015_Q01.png" width="80%"gt
View SolutionThe equation of straight line shown in figure is :
ltimg src="https://d10lpgp6xz60nq.cloudfront.net/physics_images/ALN_PHY_R04_E01_020_Q01.png" width="80%"gt
View SolutionAt point P, the value of (dy)/(dx) is : ltimg src="https://d10lpgp6xz60nq.cloudfront.net/physics_images/ALN_PHY_R04_E01_025_Q01.png" width="80%"gt
View SolutionFrom the following figure, the correct observation is :- ltimg src="https://d10lpgp6xz60nq.cloudfront.net/physics_images/ALN_PHY_R03_E08_015_Q01.png" width="80%"gt
View SolutionWhich of the following statement is not correct for following straight line graph :-
ltimg src="https://d10lpgp6xz60nq.cloudfront.net/physics_images/ALN_PHY_R04_E01_015_Q01.png" width="80%"gt
View Solution